Embed Size (px)
DESCRIPTION
Introduction to the CVS-EEP Entry Tool. version 2.2.7 by Michael Lee October 7, 2009. Don't have a copy of the tool? Get it here: http://cvs.bio.unc.edu/methods.htm. OBJECTIVES. We'll go through each part of the Entry Tool for Level 1 Sampling Protocol: Planted Woody Stems - PowerPoint PPT Presentation
Citation preview

Introduction to theCVS-EEP Entry Tool
version 2.2.7
by Michael Lee
October 7, 2009
Don't have a copy of the tool? Get it here: http://cvs.bio.unc.edu/methods.htm

OBJECTIVES
• We'll go through each part of the Entry Tool for Level 1 Sampling Protocol: Planted Woody Stems– Explanation of the Data Entry Tool– Setting up the Data Entry Tool
• Data Entry Steps:– Step 1: Project Planning– Step 2: Level Protocol Choice– Step 3: Data Entry
• Brief introduction to Level 2 Data Entry• Error Checking and Report Generation.

What is the Entry Tool?
• A Microsoft Access* database.• Don't be intimidated! It doesn't feel like a
database.• Based on VegBank (www.vegbank.org) data
structure.• Modified to fit our needs – we continue
modification as the protocol evolves.• It is a single file on your computer, with the
extension .mdb. This file can be downloaded, copied as a backup, and sent to others so that they can see or use your data.
*Designed in Access version 2003, works also in 2007, 2002 (XP) and 2000. Not supported in Access 97 or earlier.

What does the Entry Tool do?
• Organizes the entry process with the Main Menu.• Forms that allow efficient data entry – lookup data
quickly and avoid redundant typing.• Data validation ensures that problems are flagged and
then resolved.• Reports summarize the final data.• Reports also are printed to provide a basis for Monitoring
(VMD).• Download template data from CVS - plots, communities.
ALL THIS SAVES TIME AND MONEY AND DELIVERS BETTER QUALITY DATA!
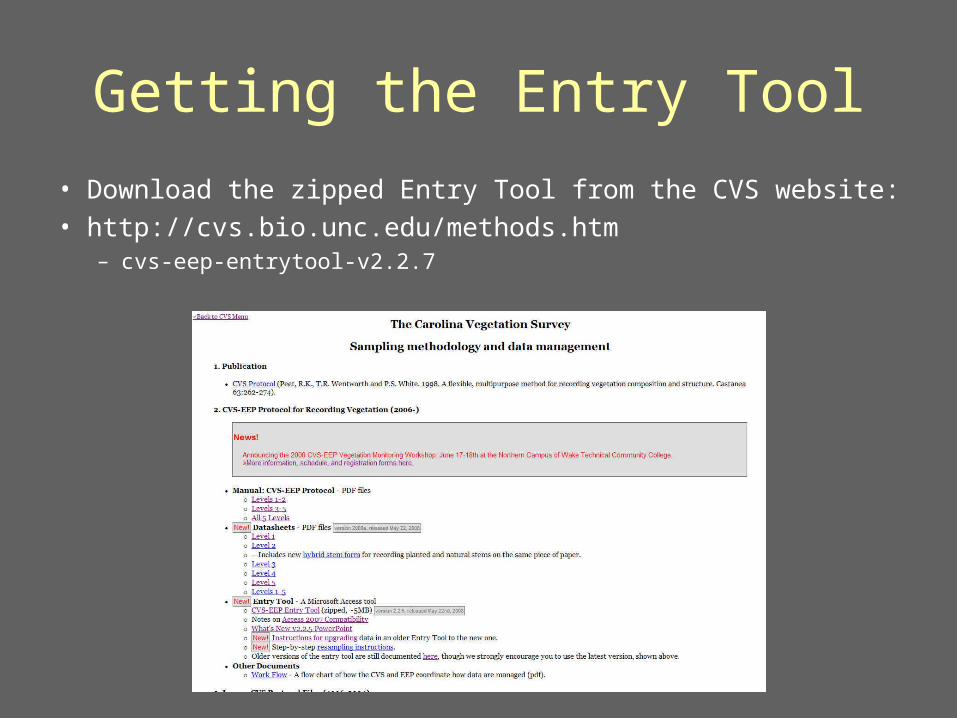
Getting the Entry Tool
• Download the zipped Entry Tool from the CVS website:• http://cvs.bio.unc.edu/methods.htm
– cvs-eep-entrytool-v2.2.7
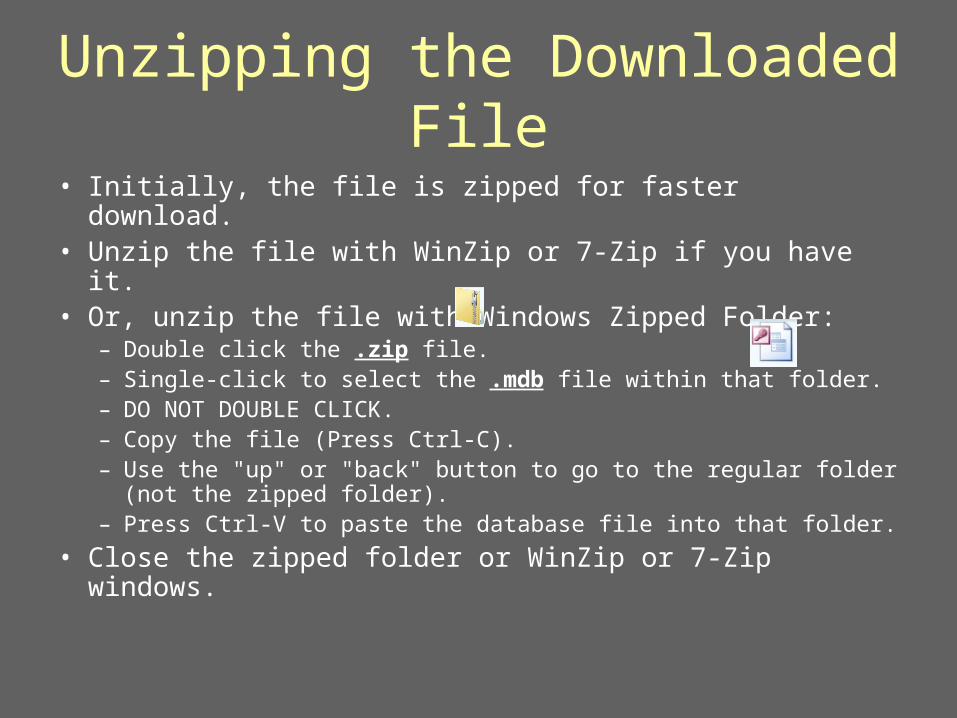
Unzipping the Downloaded File
• Initially, the file is zipped for faster download.• Unzip the file with WinZip or 7-Zip if you have it.• Or, unzip the file with Windows Zipped Folder:
– Double click the .zip file.– Single-click to select the .mdb file within that folder.– DO NOT DOUBLE CLICK.– Copy the file (Press Ctrl-C).– Use the "up" or "back" button to go to the regular folder (not the
zipped folder).– Press Ctrl-V to paste the database file into that folder.
• Close the zipped folder or WinZip or 7-Zip windows.

Startup Issues - Access 2003
• You may get up to two dialog messages:
• Do you want to open a file with Macros?– CLICK "OPEN"
• Do you want to block unsafe expressions?– CLICK "NO"
• These can be turned off, see Access help on security.
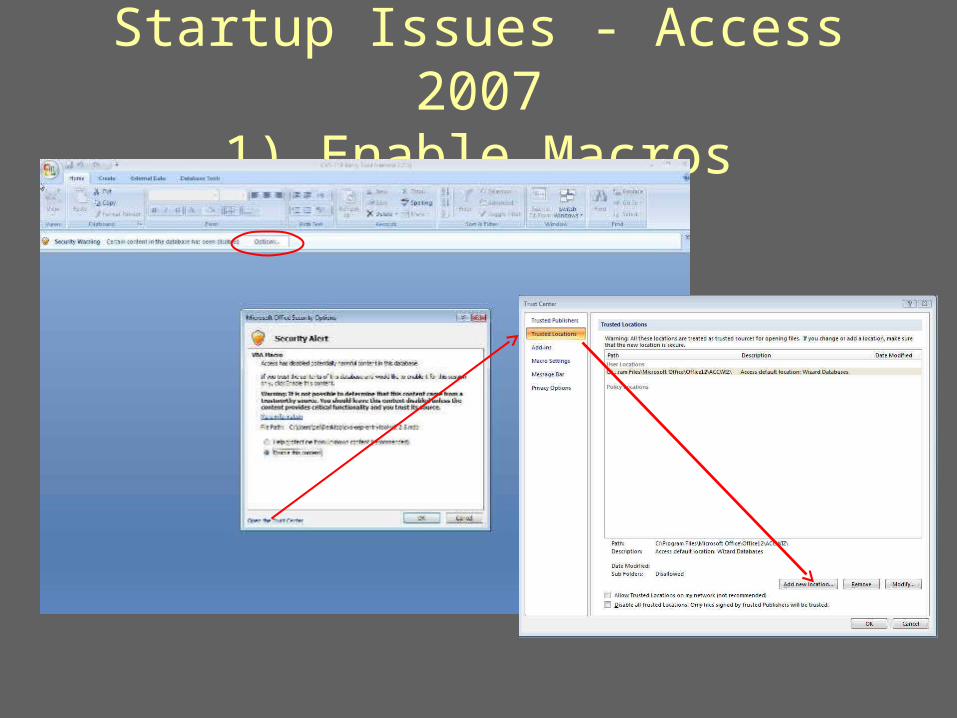
Startup Issues - Access 20071) Enable Macros
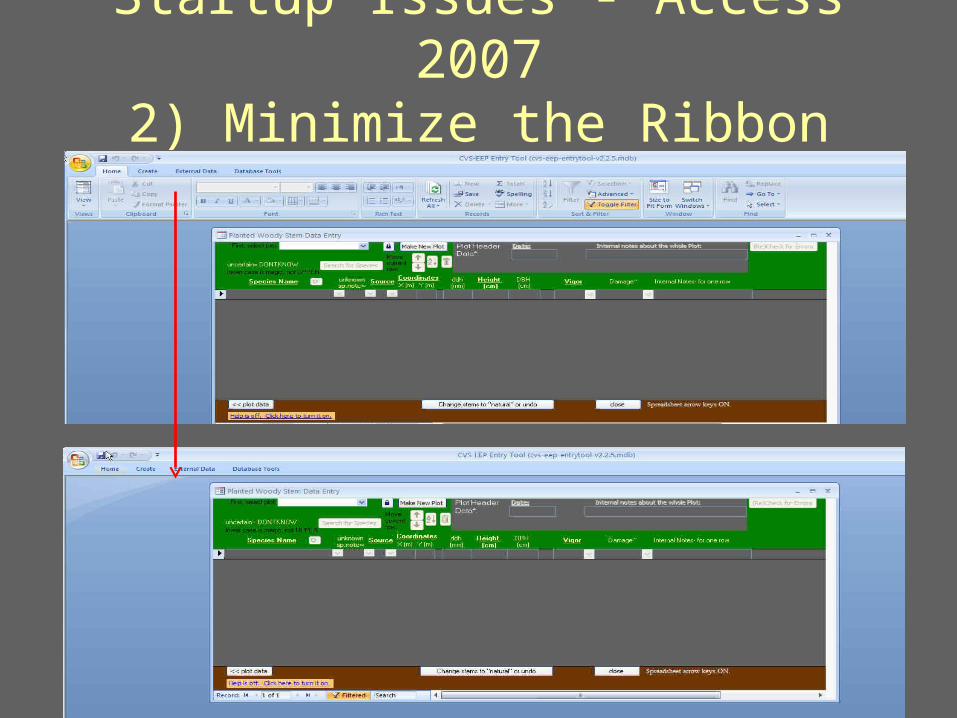
Startup Issues - Access 20072) Minimize the Ribbon (Ctrl-F1)

Startup Issues - All Access versions
• If Access is new on your computer, it may ask for your name as part of the Office setup.
• Confirmation Messages are a part of Access that asks you to be sure you want to edit data in certain ways.– e.g., deleting rows, updating
a lot of data at once.• These need to be turned off to use
the entry tool.• Click "Yes, turn
off confirmation messages" ifprompted.
• Messages will be turned back on after closing the entry tool.

Login
• The Entry Tool keeps track of when records are added or updated, and by whom.
• This can help track down what happened with data that may not make sense.
• Select your name if it's inthe list, or enter your initials and name.
• You can check the box to log you in automatically next time.
• Make sure the date and time are correct.
Unzip and open the entry tool

The Main Menu• Step 1: Project
Planning
• Step 2: CVS Level
• Step 3: Data Entry
• Step 4: Extras
• Step 5: Reports
• Options
• Shows who is logged in• Message Center• Shows Entry Tool version• Links to CVS and EEP
Websites
Main Menu How to find this form
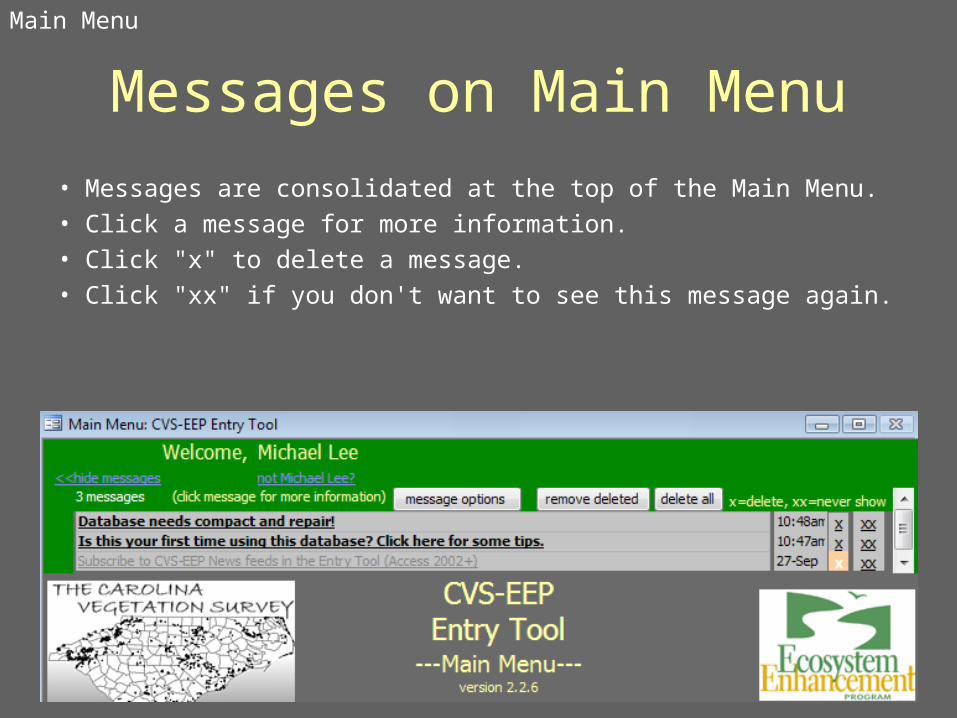
Messages on Main Menu
• Messages are consolidated at the top of the Main Menu. • Click a message for more information.• Click "x" to delete a message.• Click "xx" if you don't want to see this message again.
Main Menu

Step 1: Project Planning
• View projects or add project manually– Calculate required number of plots
• Delete project or year(s) of project
• Download projects and plots to monitor
Main Menu > Planning > View Existing Projects

Calculate Required Number of Plots
• Fill in data for a single project.– Or use as a calculator.
• Enter standard units (ft).– Or use alternate units.– Or specify area.
• Press "calculate!"– rules for calculation
are available.****For riparian projects only, wetlands are different.****
Main Menu > Planning > Calculate Required Number of Plots
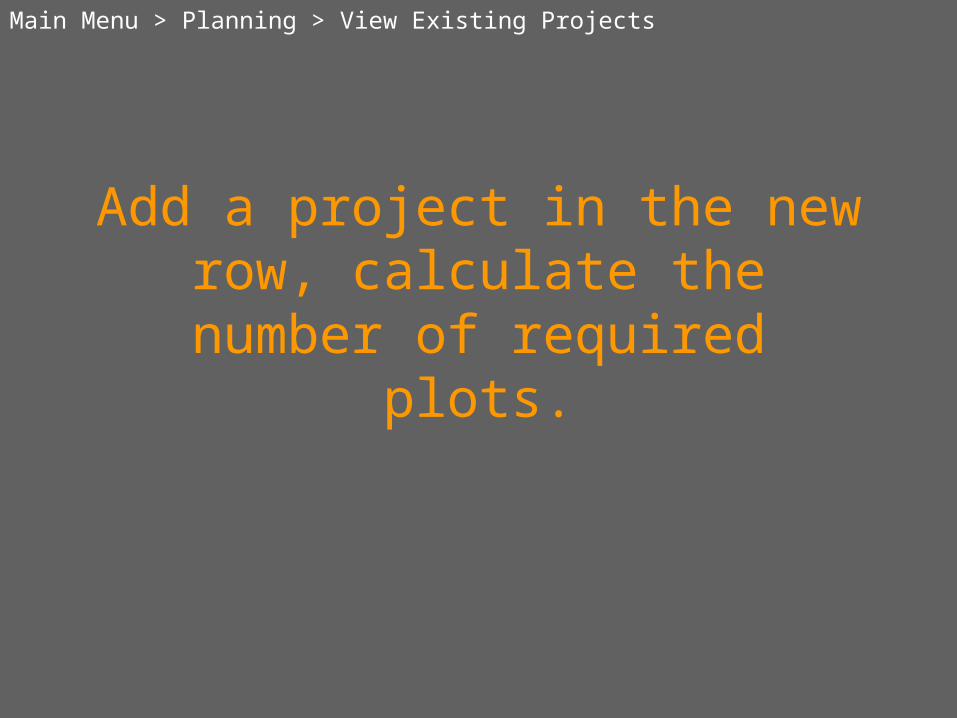
Add a project in the new row, calculate the number of required
plots.
Main Menu > Planning > View Existing Projects
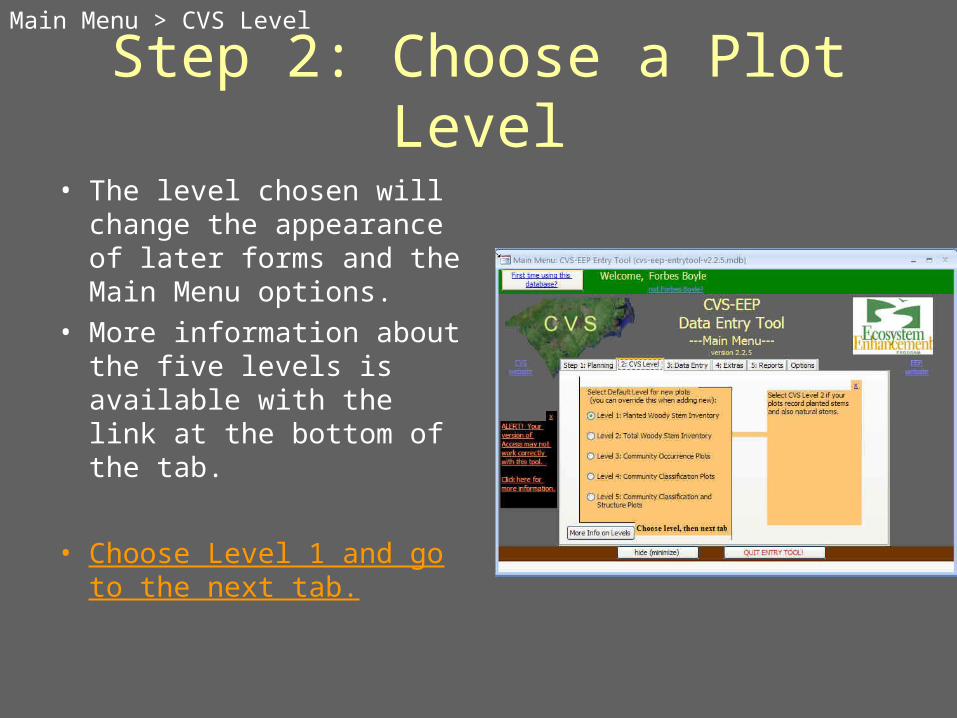
Step 2: Choose a Plot Level
• The level chosen will change the appearance of later forms and the Main Menu options.
• More information about the five levels is available with the link at the bottom of the tab.
• Choose Level 1 and go to the next tab.
Main Menu > CVS Level

Step 3: Data Entry: Level 1
• Plot Data• Planted Woody Stems• You can also check for and view logical
errors on this tab.• The "extras" tab can be
used to enter people, projects, references, species, etc.
• Click "Plot Data"
Main Menu > Data Entry
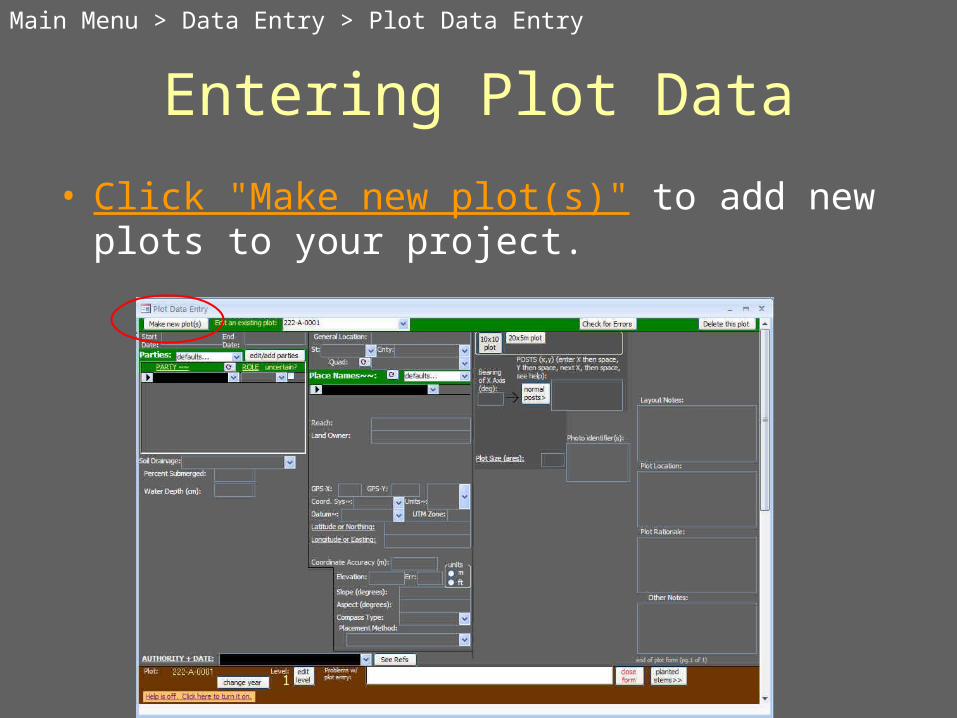
Entering Plot Data
• Click "Make new plot(s)" to add new plots to your project.
Main Menu > Data Entry > Plot Data Entry

Adding New Plots
• You must specify project, team, plot, plot level, and year number. – Fills in next plot number and current plot level.– Add a few plots.
Main Menu > Data Entry > Plot Data Entry > Make new plots

Basic Plot Data Entry Tips
• The Plot Form matches the Plot Data Sheets closely.
• Tab between boxes (Ctrl-Tab out of big ones).
• Use Alt-Down Arrow on your keyboard to see the contents of a picklist without the mouse.
Main Menu > Data Entry > Plot Data Entry

Basic Plot Data Entry Tips
Any keystrokePicklist: Just start typing and pick the character. Alt-down arrow
Black arrow: Record is ready for editing, and is being saved while entered.
Pencil: Record is being editedAsterick: New record
Main Menu > Data Entry > Plot Data Entry
Basic Plot Data Entry Tips
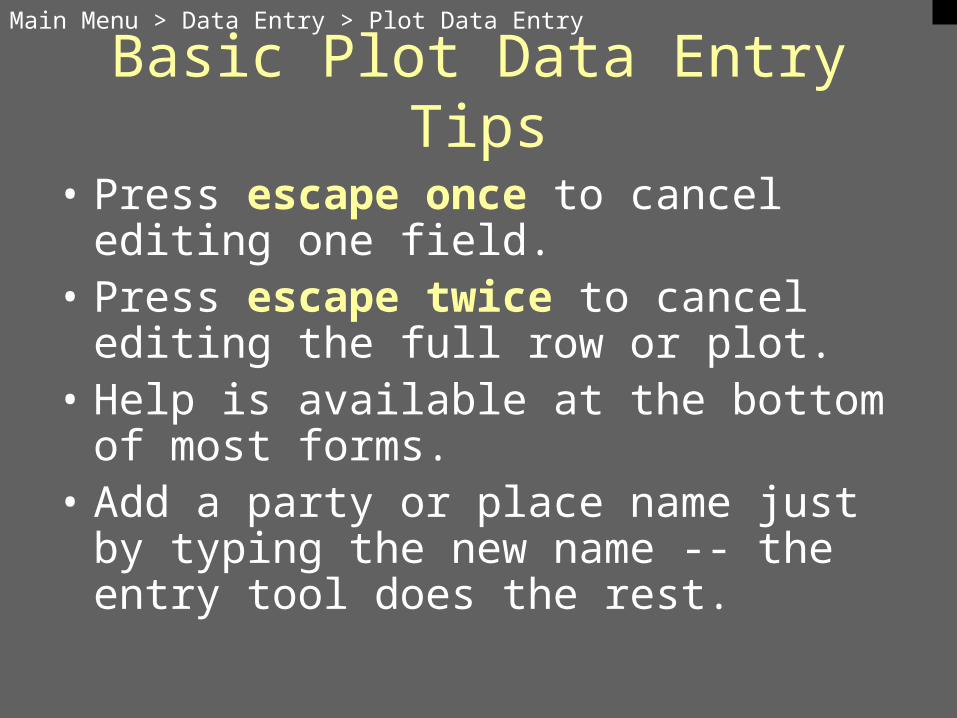
• Press escape once to cancel editing one field.
• Press escape twice to cancel editing the full row or plot.
• Help is available at the bottom of most forms.
• Add a party or place name just by typing the new name -- the entry tool does the rest.
Main Menu > Data Entry > Plot Data Entry
Picklists: Selecting Multiple Items
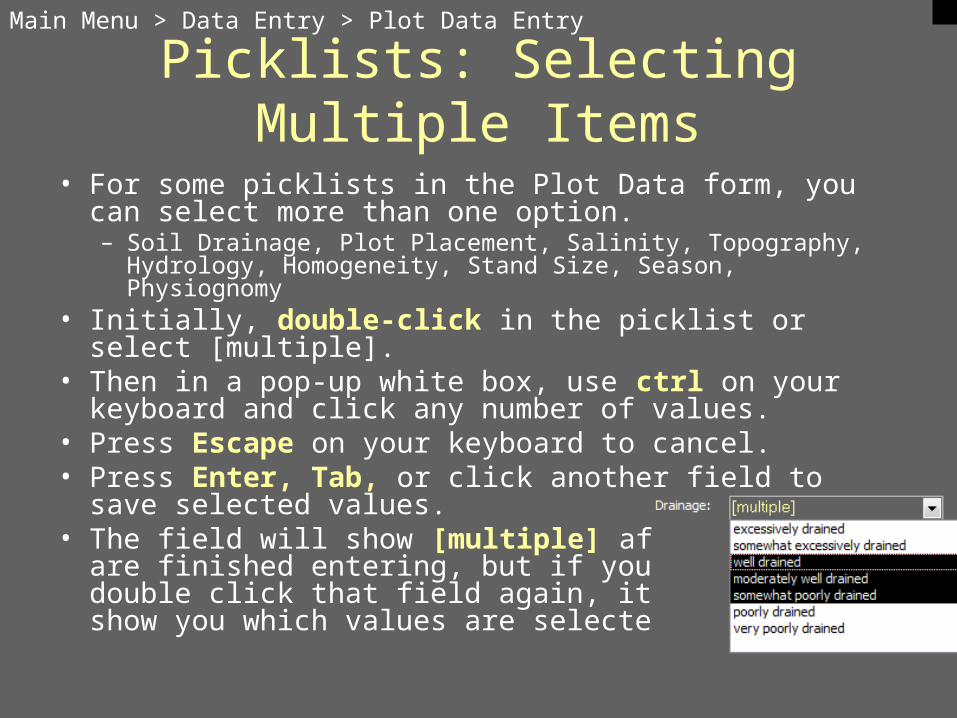
• For some picklists in the Plot Data form, you can select more than one option.– Soil Drainage, Plot Placement, Salinity, Topography, Hydrology,
Homogeneity, Stand Size, Season, Physiognomy• Initially, double-click in the picklist or select [multiple].• Then in a pop-up white box, use ctrl on your keyboard
and click any number of values.• Press Escape on your keyboard to cancel.• Press Enter, Tab, or click another field to save selected
values.• The field will show [multiple] after you
are finished entering, but if you double click that field again, it will show you which values are selected.
Main Menu > Data Entry > Plot Data Entry

Help and Errors
• Turn on help at the bottom of the main forms, move mouse over something and you’ll see more information about it (orange box).
• Check for errors (optionally after each plot, see Main Menu > options)
Main Menu > Data Entry > Plot Data Entry / Planted Woody Stem Entry

Fill in plot data for your new plots
• Parties• Places• Location• Methods• Size• Shape• Environment• Advanced:
– Multiple values picklist– Try help feature
Main Menu > Data Entry > Plot Data Entry

Planted Woody Stems
• There's a link directly from the Plot Data– Or you can link from
the Main Menu (Data Entry tab)
• Click "planted stems>>" on the Plot Data form or the Main Menu
Main Menu > Data Entry > Planted Woody Stem Entry

Planted Woody Stem Entry Tips
• You can add new stems on the blank bottom line • Fields are truncated to correct number of digits.• Notes are available for uncertainty and internal
comments• Use keyboard arrow keys, and the "Enter" key.• Help is available at the bottom of the form.
Main Menu > Data Entry > Planted Woody Stem Entry

Magic Species Picklist
• Species names are difficult in picklists:– Many species names.– The names are often quite
similar (e.g., same genus).• The entry tool uses "Magic
Species Picklists" which limit the species based on the first two letters of genus and 2 letters of species (and one letter variety, if applicable).
• Enter 2 letters of the genus name and 2 letters of the species name and then arrow keys or mouse to select your species.
• If only one species matches, it is selected for you.
• Use CAPITAL LETTERS to disable this feature.
• Enter "*" to reset the list.• Configurable in Main Menu >
Options > Advanced Features
Main Menu > Data Entry > Planted Woody Stem Entry

Can’t Find Your Species?• What if S. alba was recorded in the field? Genus?
Press "Search for species" and search the full list of species, or just type a "?" after
(part of) a name.
You can search by common name too.
Main Menu > Data Entry > Natural Woody Stem Entry

Unknown Species
• There are three "unknown species" scenarios:– 1) Genus or family is known, but not the species.
• Fill in "sp." "sp. #2" or "sp. #3" etc. in the "unknown species" column. This separates distinct unknown species within the same genus (e.g. "Carya sp." "Carya sp. #2")
– 2) The data enterer can't understand what's written on the form (e.g., common name or unreadable)
• Use the species "DONTKNOW" which is a flag for a project director to make a determination later. Use notes field.
– 3) The species was not known in the field.• Use the "unknown" species.
• Applies to all forms where you enter species.
Main Menu > Data Entry > Planted Woody Stem Entry

A stem isn't planted after all
• Sometimes stems are added in the Planted Stems Form, but later someone determines that it should be included as a natural stem instead.
• Previously, you had to delete this stem and add it in the Natural Stems Form.
• Now, you can change a stem to "natural" with a couple of clicks….
Main Menu > Data Entry > Planted Woody Stem Entry

Switch a planted stem to natural
• Bottom of the Planted Stems Form, click: Change stems to "natural"…
• A green picklist appears with "N" (natural stems) or "P" (planted). • Select N or P as required for a particular row (the default is planted).• Click the button again to change all stems on the plot to natural or
planted.• Natural stems will be flagged "Natural STEM: NOT PLANTED" and
will not be included in planted stem density in Excel reports, when printing monitoring reports, or in next year's resampling data.
Main Menu > Data Entry > Planted Woody Stem Entry

Add planted stems
• Select a species• Magic species picklist• Search for species• Fill in source, X, Y, ddh, Height, DBH
– Vigor, Damage, Notes
• Mark stems "natural"– toggle back to planted, switch entire plot
• Check for errors– fix errors, ignore errors, check for errors again
Main Menu > Data Entry > Planted Woody Stem Entry

Download Plots for Monitoring
• Download list of projects: this list updates as we receive new data.• Search in the blue search area or scroll through the list.• Select "import" to download those plots as a template for monitoring.
– This downloads plots completed in previous years. – Requires internet connection.
• Then press "Print VMD Datasheets"
Main Menu > Planning > View / Add Projects > Download ProjectsHow to find this form
Requires Internet
Connection
Demonstration of download
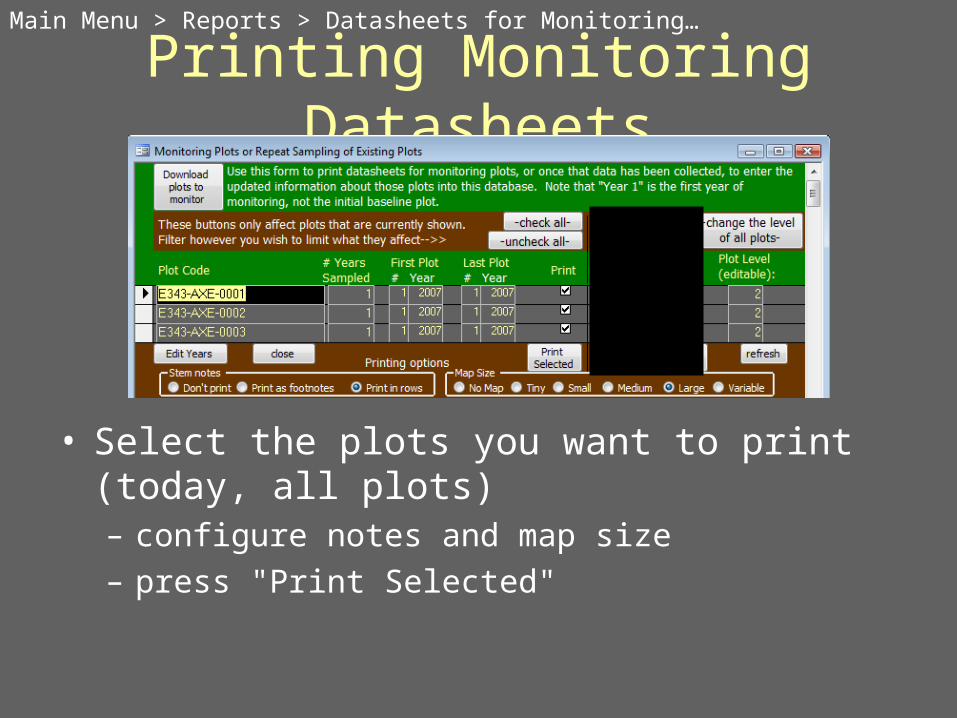
Printing Monitoring Datasheets
• Select the plots you want to print (today, all plots)– configure notes and map size– press "Print Selected"
Main Menu > Reports > Datasheets for Monitoring…

VMD Field DatasheetsMain Menu > Reports > Datasheets for Monitoring… > Print Selected

Resampling Plots
• Press "Resample Selected" to create a new version of the plot for this year's sampling.
Main Menu > Reports > Datasheets for Monitoring…

Print and Resample plots

Year 1 vs. Year 2
Main Menu > Reports > Datasheets for Monitoring… > Enter Data

Resampling Planted Stems
• Select the "new" plot from the picklist– You can configure the picklist to only show
new plots
• Cursor doesn't stop on prepopulated fields.– But, fix any updates to taxonomy or X,Y.
• Add header information with button at top.
• Add new stem with button at bottom.

Enter data on resampled plots

Level 2 Natural Stems Datasheet
• TOTAL WOODY STEM INVENTORY PLOTS: Planted woody stems + natural regeneration.
A stem is considered planted if there is positive confirmation or strong evidence otherwise it is considered natural.
web: http://cvs.bio.unc.edu/methods.htm#datasheets

Level 2 Natural Stems Entry• Don't forget the header info (especially minimum
stem size sampled = cut-off).
Main Menu > Data Entry > Natural Woody Stem Entry

Keyboard shortcuts
TAB / SPACE BAR: Move to next field commonly used (dashed border fields are skipped).
CTRL-TAB: Move to next field, even if it has a dashed border (fields are NOT skipped).
UP/DOWN ARROW: Adjacent Row
LEFT/RIGHT ARROW: Adjacent Column
ENTER: Next Species Row, First Field
Main Menu > Data Entry > Natural Woody Stem Entry

Efficient entry of large stems• Often, there is just one size category, or the smaller
categories are absent• To jump to a particular size:
– Press and hold ctrl, then enter the size of the stem class (lower bound, e.g. 30 or 45), then release ctrl
• If you enter a size less than 40cm, the default of 1 stem is filled in (you can change the number if not 1)
• If you enter a size of 40cm or greater, that size is entered in the first box for stems at least 40cm
Main Menu > Data Entry > Natural Woody Stem Entry

Sorting
• To move a record in stem or cover entry, use the blue up and down arrows in the header section– This moves the current row up or down
relative to the others
• If you sort manually using access functions, you can restore the normal order by pressing the (A-Z sort) button next to the up and down arrows.
Main Menu > Data Entry > Natural Woody Stem Entry

Enter Natural Stems
Error Checking - 1
• Check for errors in all plots in Main Menu > Data Entry. Some errors are just warnings that a stem is large.
• Fix errors by filling in required fields, confirming values, fixing mismatches, etc.
• Ignore errors that are not really errors, or nothing can be done about them.– Ignoring an error once ignores one error on one particular row.– Ignoring an error everywhere will ignore this type of error for all
the data in the entry tool (use caution!).– Just because you ignore an error doesn't make the problem go
away. If some systematic error was made, it would be good to explain it in the plot notes.
• Check for errors again, as fixing one error could have created a new one.
Main Menu > Data Entry

Error Checking - 2
Main Menu > Data Entry > Plot Data Entry

Automatic Error Checking
• Errors can be checked as you enter data.– This is not on by default, but can be turned on
here:– Main Menu > Options > Perform error
checking after I finish each plot
• Data is checked after you finish each line and after each plot.
Main Menu > Options > Perform error checking
Try error checking (all plots)

Using the Data Entry Tool to Generate Simple Reports
• Summary of stems per plot in Excel.– Can choose a subset of plots in "Configurable Stats."
• Can be copied and pasted into a Word document and used in larger written reports.
Main Menu > Reports

Using the Data Entry Tool to Generate Simple Reports
• Export to Excel to provide spreadsheets of stem data, including:
1) Plot Metadata (location, level, year, number of stems [planted and natural], stems per acre.
2) Total number of stems per acre by project
3) Tally of damage – no damage AND vigor categories of stems by species and type
4) Total number of planted/natural stems by plot
Main Menu > Reports

New Report for Appendix
• A new report has been created that exports data for each plot and each year, arranged in columns
Main Menu > Reports