Embed Size (px)
Citation preview
Foothill-De Anza Community College District, Office of Institutional Research & Planning Del Río-Parent, August 1, 2016 1 | P a g e
Introduction to the CCCCO MIS Data mart, The purpose of this document is to provide an overview of the information available at the California Community Colleges Chancellor’s Office (CCCCO) MIS data mart, http://datamart.cccco.edu/; in specific, data related to the MIS Student Success quarterly report or SSSP1 services. The document illustrates steps to perform basic queries and segregate student headcount figures by group or service. The document also shows how to use the “Advance Layout” feature of the data mart, which allows users to drilldown to selected subgroups in the report, and how to export the results to Excel.
Section A. Access Queries in the Data Mart
Step A1. Go to http://datamart.cccco.edu and click on “Queries.”
Step A2. Click on “Student Services”
1 “Student Success and Support Program (SSSP) (formerly Matriculation) is a process that enhances student access to the California Community Colleges and promotes and sustains the efforts of credit students to be successful in their educational endeavors. The goals of Student Success and Support Program (formerly matriculation) are to ensure that all students complete their college courses, persist to the next academic term, and achieve their educational objectives through the assistance of the student-direct components of the student success & support program (formerly matriculation) process: admissions, orientation, assessment and testing, counseling, and student follow-up.” (http://extranet.cccco.edu/Divisions/StudentServices/Matriculation.aspx)
The MIS Data Mart
allows users to query
the data submitted by
their district to the
CCCCO and
compare figures with
similar districts or
colleges.
Foothill-De Anza Community College District, Office of Institutional Research & Planning Del Río-Parent, August 1, 2016 2 | P a g e
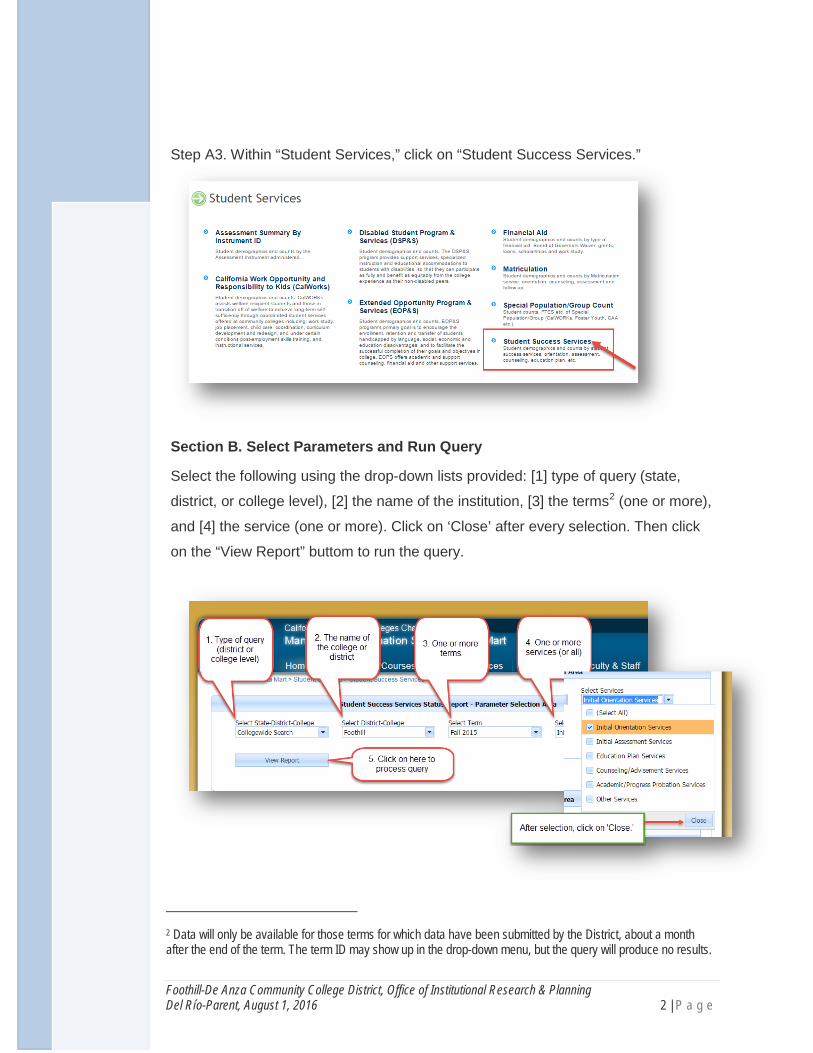
Step A3. Within “Student Services,” click on “Student Success Services.”
Section B. Select Parameters and Run Query
Select the following using the drop-down lists provided: [1] type of query (state,
district, or college level), [2] the name of the institution, [3] the terms2 (one or more),
and [4] the service (one or more). Click on ‘Close’ after every selection. Then click
on the “View Report” buttom to run the query.
2 Data will only be available for those terms for which data have been submitted by the District, about a month after the end of the term. The term ID may show up in the drop-down menu, but the query will produce no results.
Foothill-De Anza Community College District, Office of Institutional Research & Planning Del Río-Parent, August 1, 2016 3 | P a g e
Section C. Student Success, Basic Report
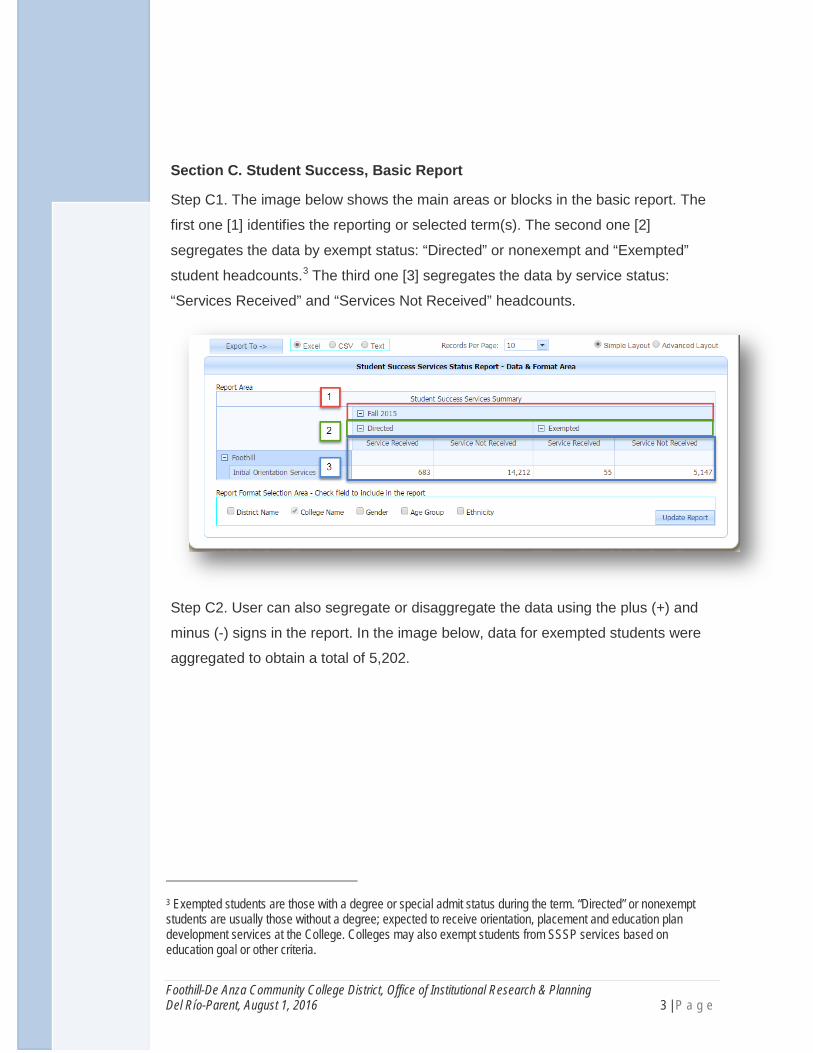
Step C1. The image below shows the main areas or blocks in the basic report. The
first one [1] identifies the reporting or selected term(s). The second one [2]
segregates the data by exempt status: “Directed” or nonexempt and “Exempted”
student headcounts.3 The third one [3] segregates the data by service status:
“Services Received” and “Services Not Received” headcounts.
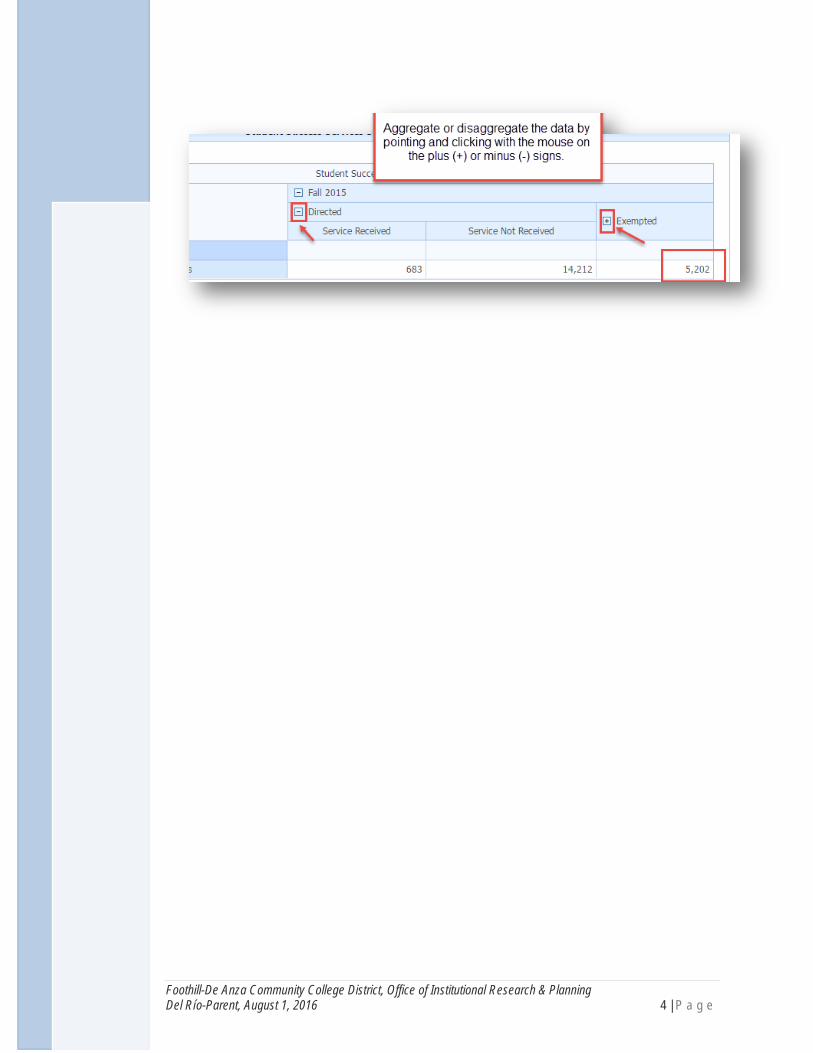
Step C2. User can also segregate or disaggregate the data using the plus (+) and
minus (-) signs in the report. In the image below, data for exempted students were
aggregated to obtain a total of 5,202.
3 Exempted students are those with a degree or special admit status during the term. “Directed” or nonexempt students are usually those without a degree; expected to receive orientation, placement and education plan development services at the College. Colleges may also exempt students from SSSP services based on education goal or other criteria.
Foothill-De Anza Community College District, Office of Institutional Research & Planning Del Río-Parent, August 1, 2016 4 | P a g e
Foothill-De Anza Community College District, Office of Institutional Research & Planning Del Río-Parent, August 1, 2016 5 | P a g e
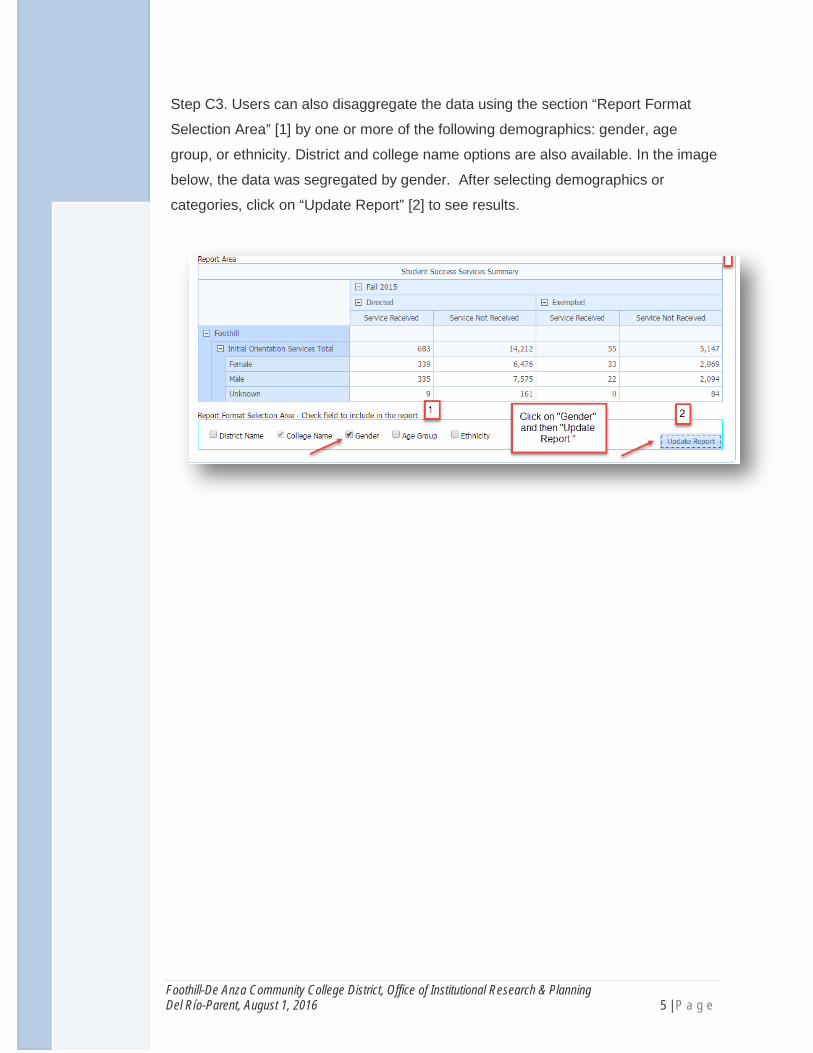
Step C3. Users can also disaggregate the data using the section “Report Format
Selection Area” [1] by one or more of the following demographics: gender, age
group, or ethnicity. District and college name options are also available. In the image
below, the data was segregated by gender. After selecting demographics or
categories, click on “Update Report” [2] to see results.
Foothill-De Anza Community College District, Office of Institutional Research & Planning Del Río-Parent, August 1, 2016 6 | P a g e
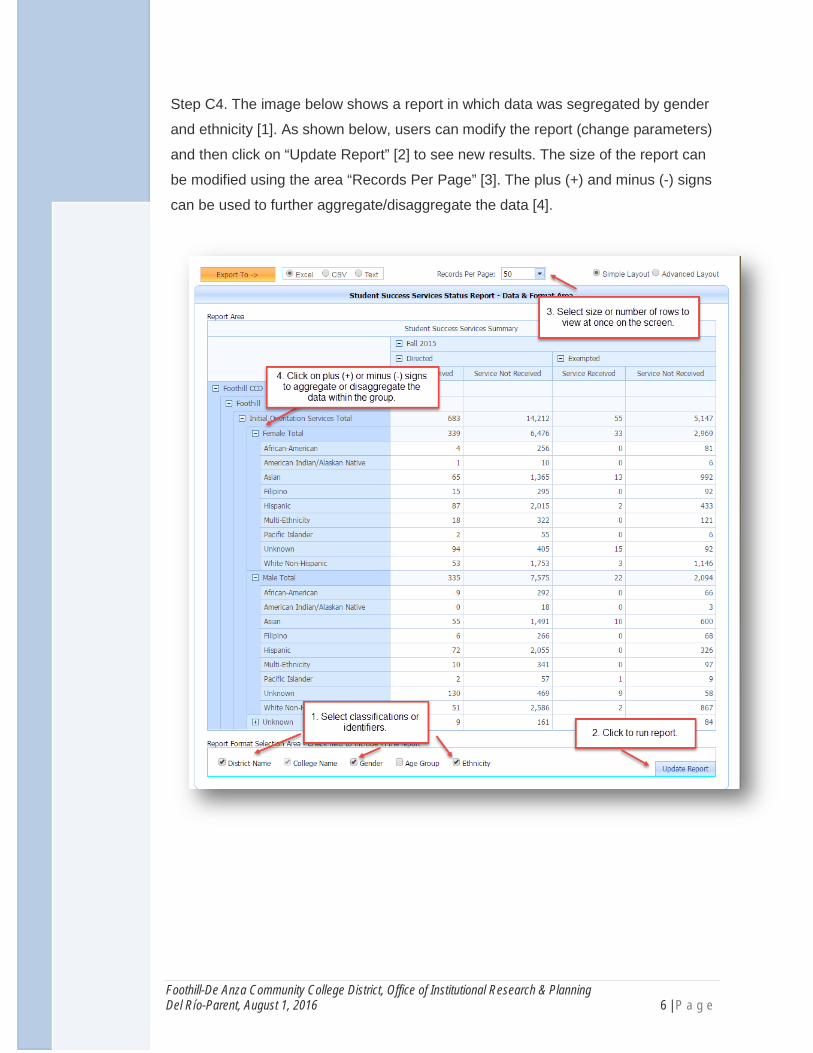
Step C4. The image below shows a report in which data was segregated by gender
and ethnicity [1]. As shown below, users can modify the report (change parameters)
and then click on “Update Report” [2] to see new results. The size of the report can
be modified using the area “Records Per Page” [3]. The plus (+) and minus (-) signs
can be used to further aggregate/disaggregate the data [4].
Foothill-De Anza Community College District, Office of Institutional Research & Planning Del Río-Parent, August 1, 2016 7 | P a g e
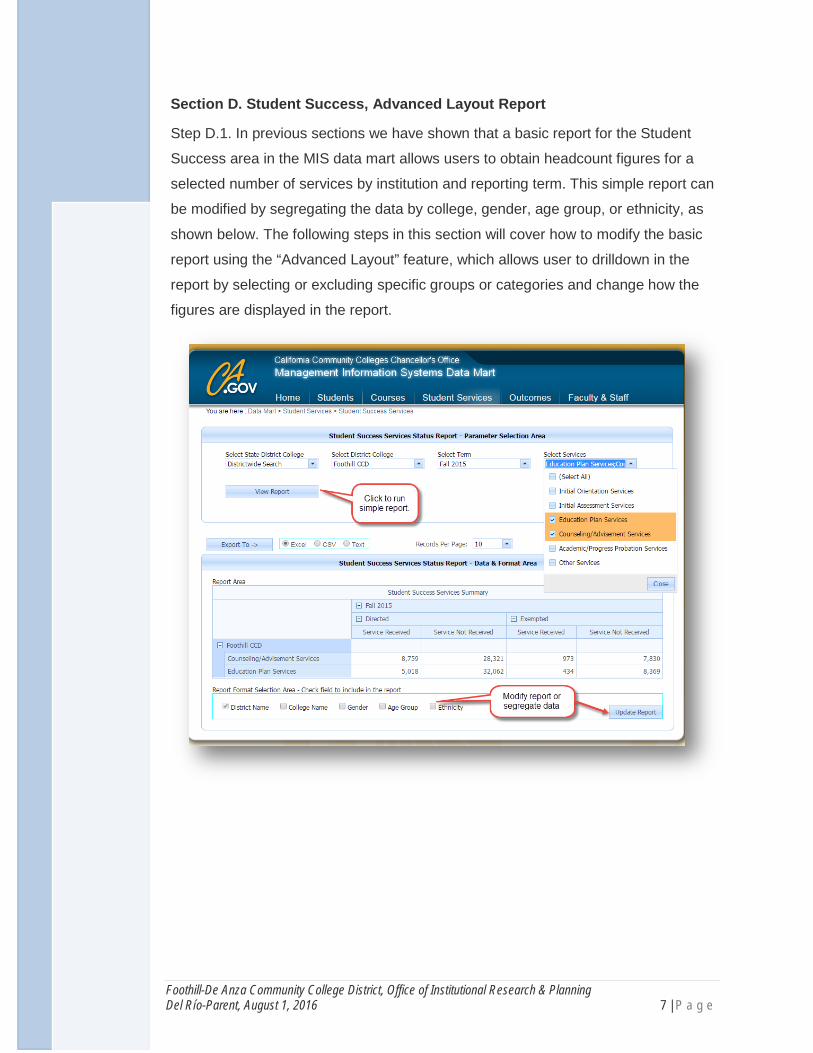
Section D. Student Success, Advanced Layout Report
Step D.1. In previous sections we have shown that a basic report for the Student
Success area in the MIS data mart allows users to obtain headcount figures for a
selected number of services by institution and reporting term. This simple report can
be modified by segregating the data by college, gender, age group, or ethnicity, as
shown below. The following steps in this section will cover how to modify the basic
report using the “Advanced Layout” feature, which allows user to drilldown in the
report by selecting or excluding specific groups or categories and change how the
figures are displayed in the report.
Foothill-De Anza Community College District, Office of Institutional Research & Planning Del Río-Parent, August 1, 2016 8 | P a g e
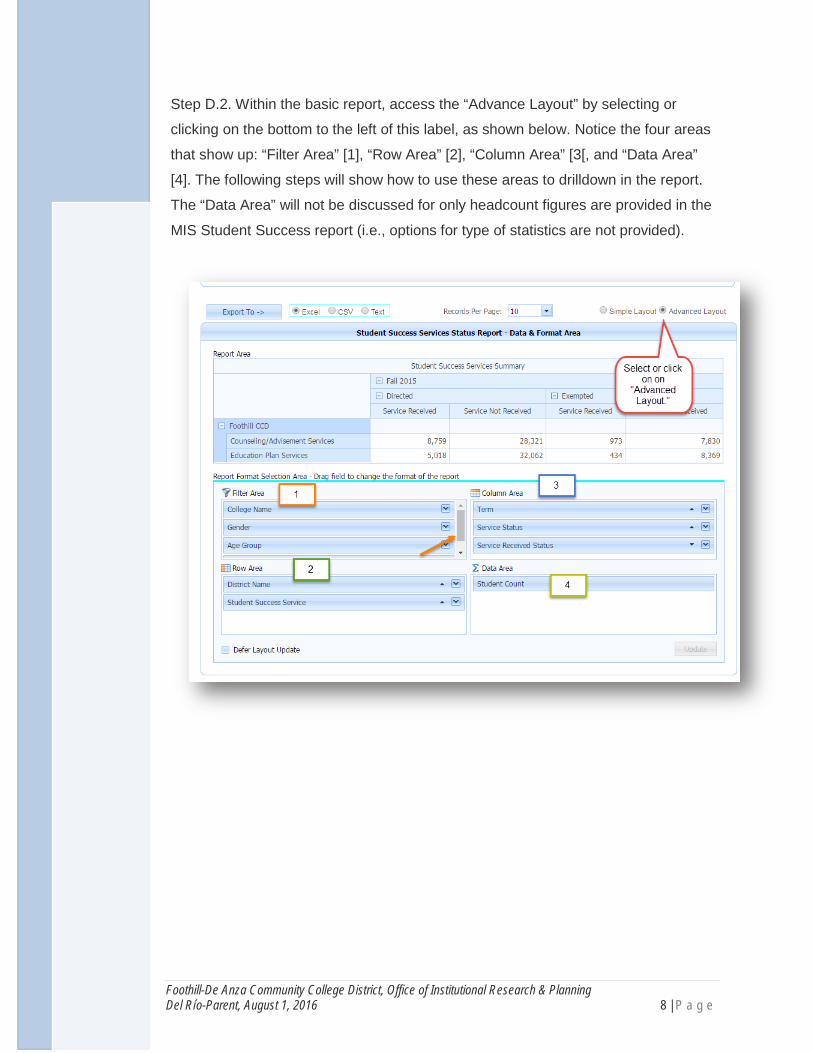
Step D.2. Within the basic report, access the “Advance Layout” by selecting or
clicking on the bottom to the left of this label, as shown below. Notice the four areas
that show up: “Filter Area” [1], “Row Area” [2], “Column Area” [3[, and “Data Area”
[4]. The following steps will show how to use these areas to drilldown in the report.
The “Data Area” will not be discussed for only headcount figures are provided in the
MIS Student Success report (i.e., options for type of statistics are not provided).
Foothill-De Anza Community College District, Office of Institutional Research & Planning Del Río-Parent, August 1, 2016 9 | P a g e
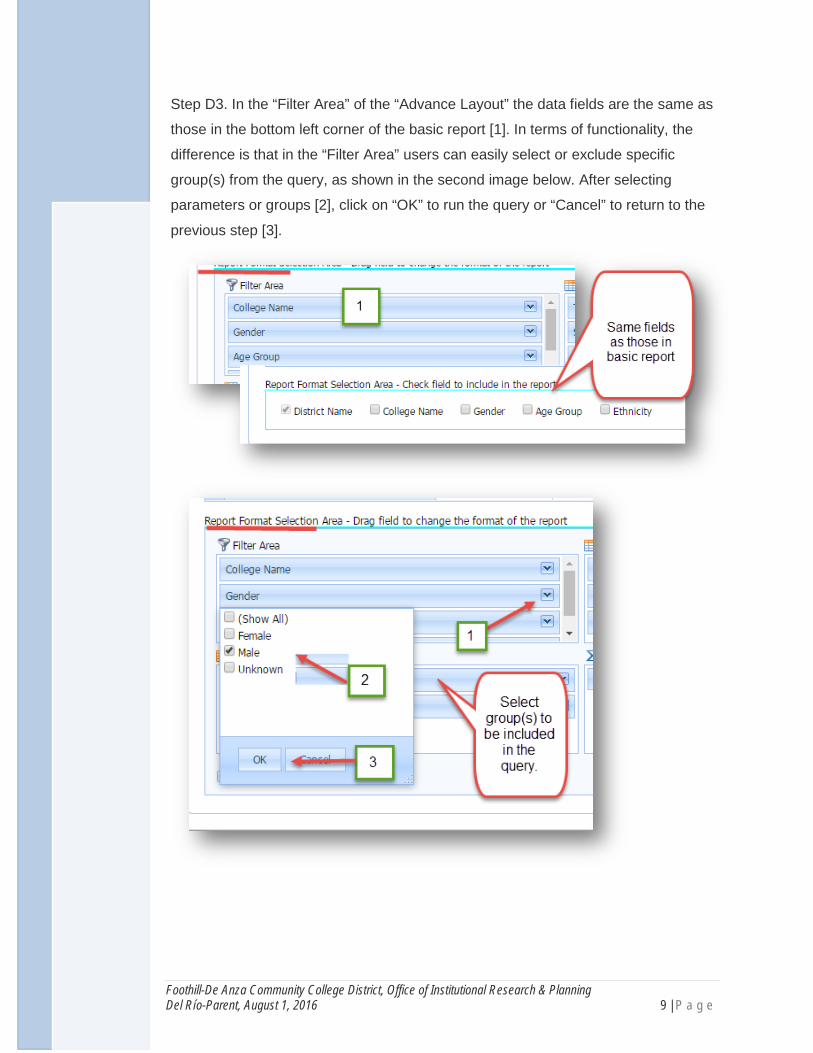
Step D3. In the “Filter Area” of the “Advance Layout” the data fields are the same as
those in the bottom left corner of the basic report [1]. In terms of functionality, the
difference is that in the “Filter Area” users can easily select or exclude specific
group(s) from the query, as shown in the second image below. After selecting
parameters or groups [2], click on “OK” to run the query or “Cancel” to return to the
previous step [3].
Foothill-De Anza Community College District, Office of Institutional Research & Planning Del Río-Parent, August 1, 2016 10 | P a g e
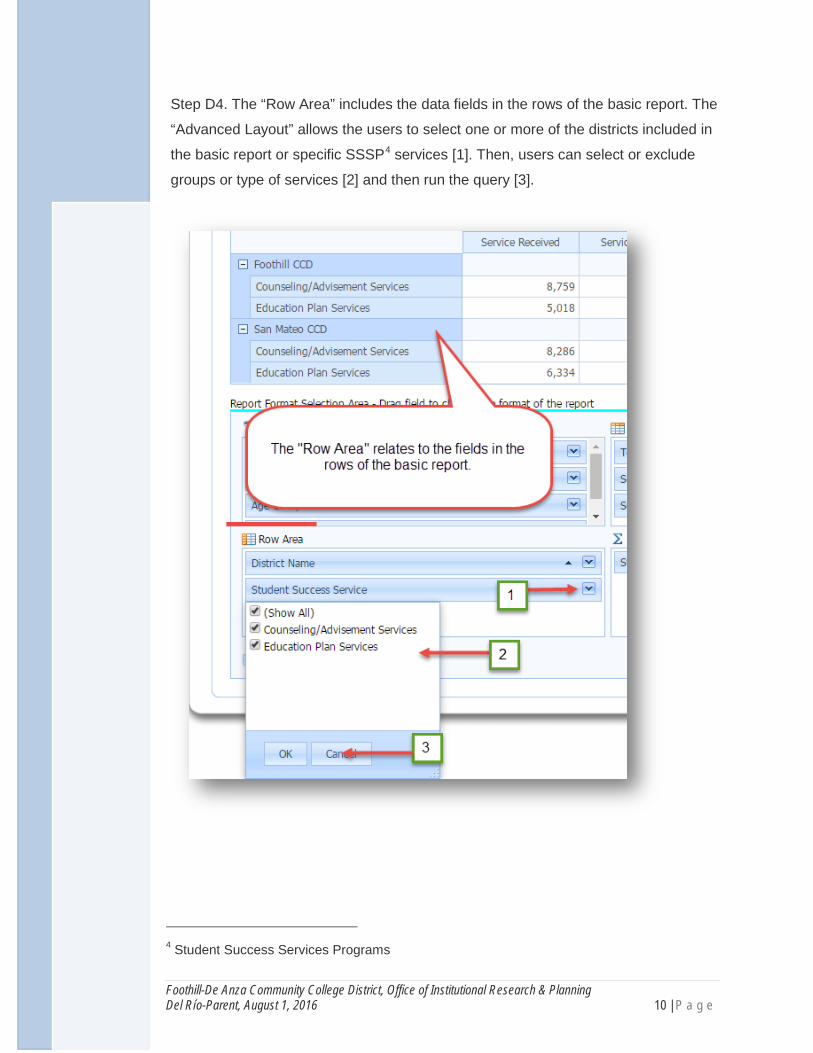
Step D4. The “Row Area” includes the data fields in the rows of the basic report. The
“Advanced Layout” allows the users to select one or more of the districts included in
the basic report or specific SSSP4 services [1]. Then, users can select or exclude
groups or type of services [2] and then run the query [3].
4 Student Success Services Programs
Foothill-De Anza Community College District, Office of Institutional Research & Planning Del Río-Parent, August 1, 2016 11 | P a g e
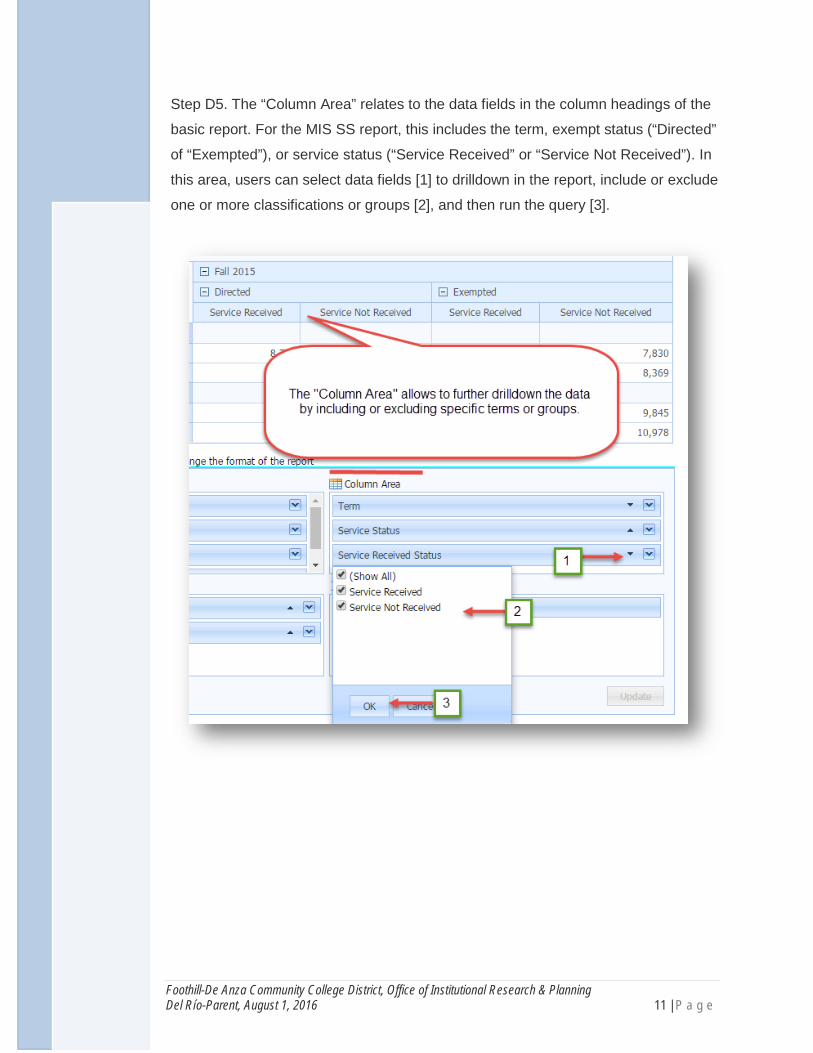
Step D5. The “Column Area” relates to the data fields in the column headings of the
basic report. For the MIS SS report, this includes the term, exempt status (“Directed”
of “Exempted”), or service status (“Service Received” or “Service Not Received”). In
this area, users can select data fields [1] to drilldown in the report, include or exclude
one or more classifications or groups [2], and then run the query [3].
Foothill-De Anza Community College District, Office of Institutional Research & Planning Del Río-Parent, August 1, 2016 12 | P a g e
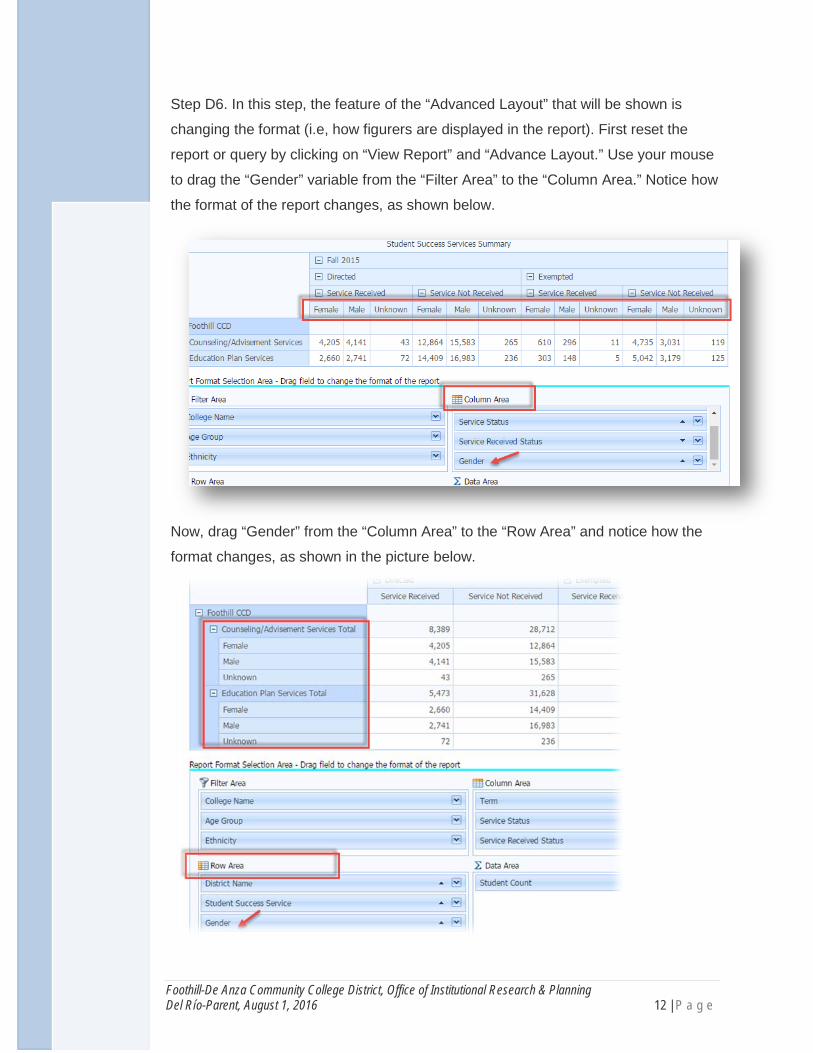
Step D6. In this step, the feature of the “Advanced Layout” that will be shown is
changing the format (i.e, how figurers are displayed in the report). First reset the
report or query by clicking on “View Report” and “Advance Layout.” Use your mouse
to drag the “Gender” variable from the “Filter Area” to the “Column Area.” Notice how
the format of the report changes, as shown below.
Now, drag “Gender” from the “Column Area” to the “Row Area” and notice how the
format changes, as shown in the picture below.
Foothill-De Anza Community College District, Office of Institutional Research & Planning Del Río-Parent, August 1, 2016 13 | P a g e
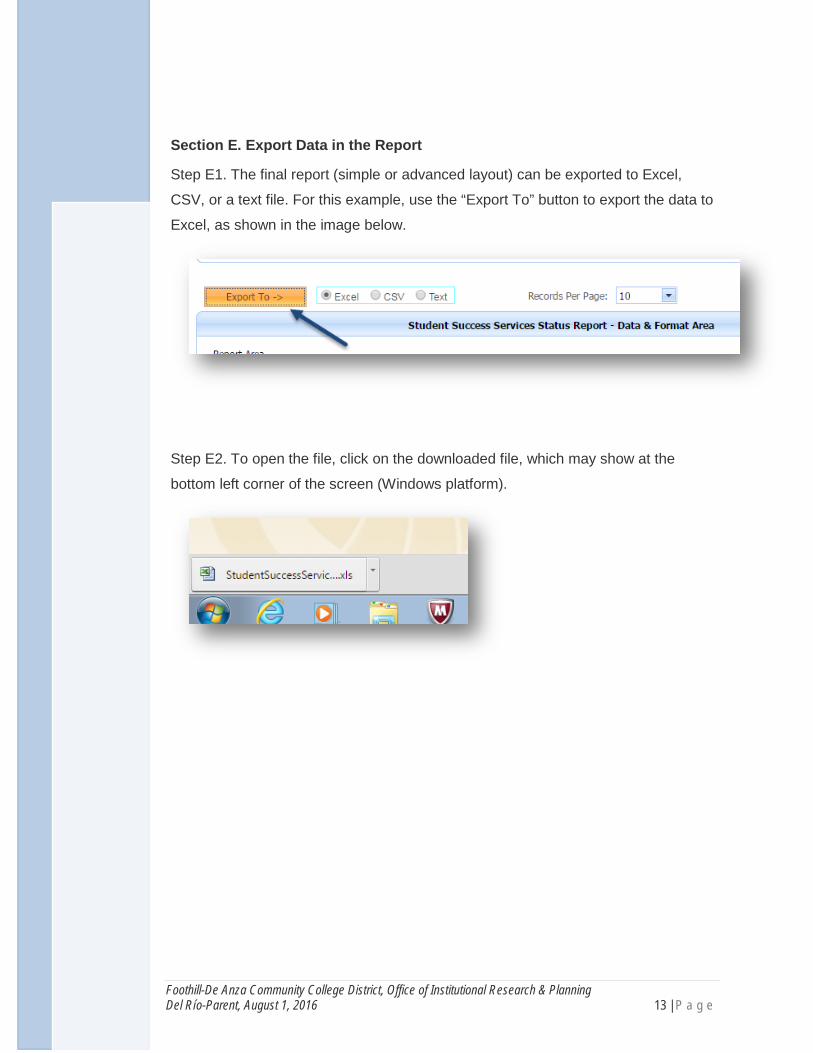
Section E. Export Data in the Report
Step E1. The final report (simple or advanced layout) can be exported to Excel,
CSV, or a text file. For this example, use the “Export To” button to export the data to
Excel, as shown in the image below.
Step E2. To open the file, click on the downloaded file, which may show at the
bottom left corner of the screen (Windows platform).
Foothill-De Anza Community College District, Office of Institutional Research & Planning Del Río-Parent, August 1, 2016 14 | P a g e
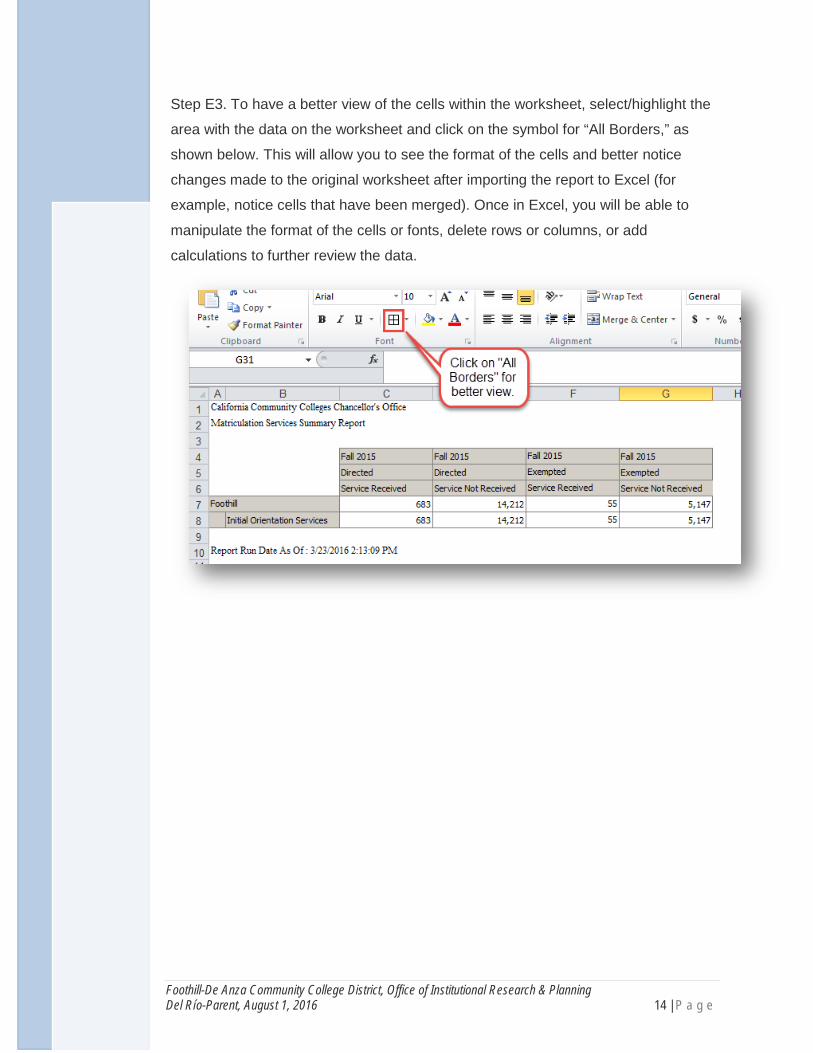
Step E3. To have a better view of the cells within the worksheet, select/highlight the
area with the data on the worksheet and click on the symbol for “All Borders,” as
shown below. This will allow you to see the format of the cells and better notice
changes made to the original worksheet after importing the report to Excel (for
example, notice cells that have been merged). Once in Excel, you will be able to
manipulate the format of the cells or fonts, delete rows or columns, or add
calculations to further review the data.
Foothill-De Anza Community College District, Office of Institutional Research & Planning Del Río-Parent, August 1, 2016 15 | P a g e
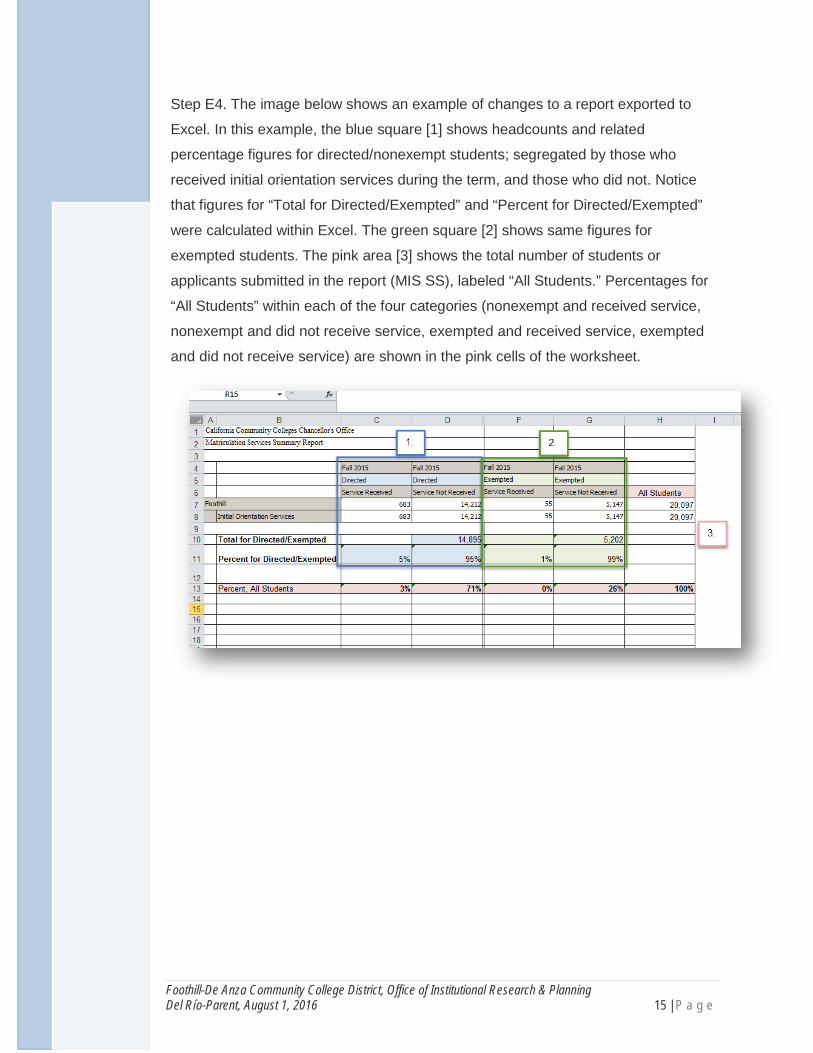
Step E4. The image below shows an example of changes to a report exported to
Excel. In this example, the blue square [1] shows headcounts and related
percentage figures for directed/nonexempt students; segregated by those who
received initial orientation services during the term, and those who did not. Notice
that figures for “Total for Directed/Exempted” and “Percent for Directed/Exempted”
were calculated within Excel. The green square [2] shows same figures for
exempted students. The pink area [3] shows the total number of students or
applicants submitted in the report (MIS SS), labeled “All Students.” Percentages for
“All Students” within each of the four categories (nonexempt and received service,
nonexempt and did not receive service, exempted and received service, exempted
and did not receive service) are shown in the pink cells of the worksheet.