Embed Size (px)
Citation preview

www.watersfoundation.org
Introduction to Systems Thinking for Early Childhood Leaders
CEELO Leadership Academy
Washington D.C. February 10 - 11, 2016
Facilitator:
Tracy Benson Ed.D. President/CEO
Waters Foundation Systems Thinking Group [email protected]
©2016 Waters Foundation, Systems Thinking in Education watersfoundation.org
CEELO Leadership Institute- 2016 Introduction to Systems Thinking
Session Learning Goals 1. Fellows will be able to identify ways Systems Thinking habits and tools can
positively influence and impact leadership and program development.2. Fellows will be able to identify ways Systems Thinking habits and tools apply to job-
embedded projects and the role of state level leadership.3. After the 2-day session, Fellows will leave with concrete ways systems thinking tools
and strategies can be applied to leadership work.
Expected Capacity-building Outcomes 1. Increase understanding of how mental models are developed overtime (Mental
models are deeply ingrained assumptions that influence how we understand theworld and how we take action.)
2. Investigate ways to understand and utilize the diverse perspectives people holdabout systems of interest
3. Identify the causal interdependencies that influence the behavior of systems4. Develop insights about short-term, long-term and unintended consequences of
decisions and actions.5. When working to achieve desired outcomes, discover ways to move from siloed
efforts to cohesive, systemic approaches6. Build skill in identifying and mapping essential, interdependent system components
Agenda Overview Day 1 Introduction and Check-in Framing the 2 day session Debrief Homework Characteristics of Complex Systems Importance of an Endogenous View Habits of a Systems Thinker Systems Thinking Tool Overview Mental Models and The Ladder of Inference Systems Thinking Iceberg Recognizing Patterns and Trends using Behavior-over-Time graphs
Day 2 Understanding interdependence in complex systems Connection Circles Casual Feedback: Reinforcing and Balancing Loops show interdependence and tell stories: Casual Loop Archetypes Iceberg completion and peer coaching Revisit Habits of a System thinker You know you are s systems thinker if you pay attention to… Closure
2
©2016 Waters Foundation, Systems Thinking in Education www.watersfoundation.org
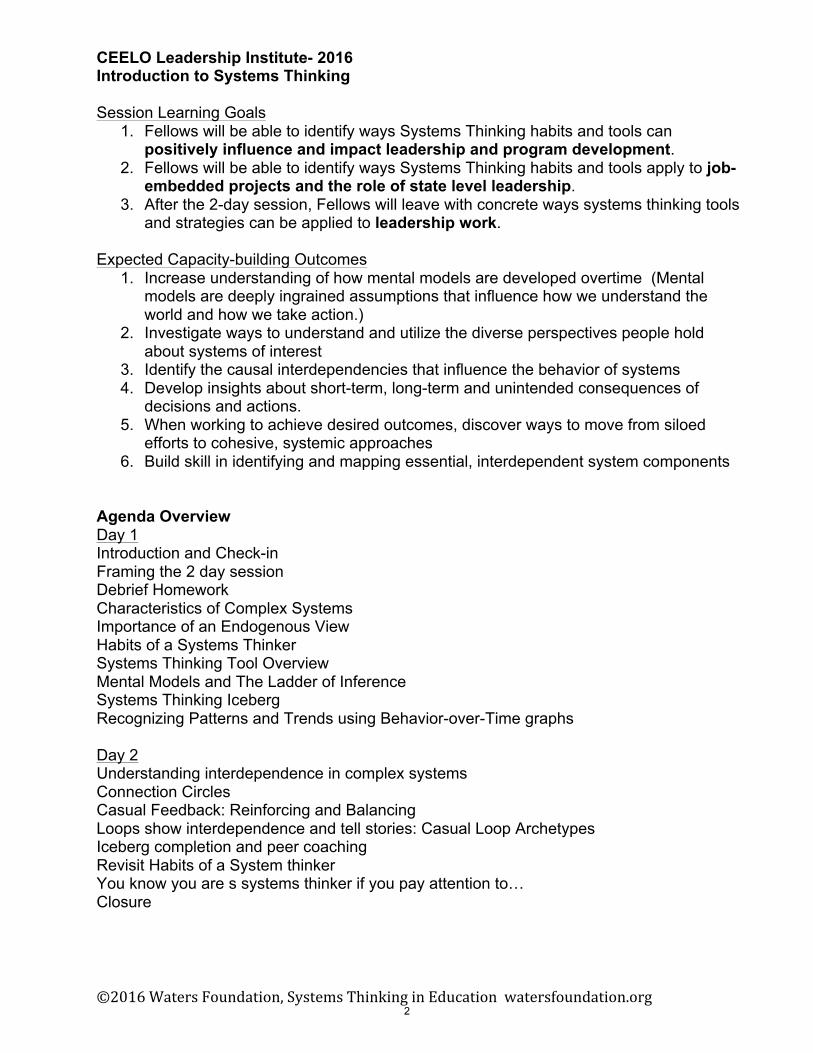
Characteristics of a System
All systems have boundaries. Most systems have subsystems that are nested and interconnected.
For example, schools are subsystems of school districts and classrooms are subsystems of schools.
Systems also have: Elements or Parts Examples include people, policies and resources.
Interconnections or Relationships among the Parts A system consists of interconnected parts. The word “interdependence” is sometimes used to describe system relationships.
Dynamics Systems tend not to stand still and continually change and adjust over time.
Goal or Purpose All systems have goals or purposes. Some goals are explicit and others are implicit.
The Importance of an Endogenous View
Your system…any system is perfectly designed to produce the results you are obtaining. (Adapted from Carr, 2008)
An Endogenous View Produced, originated or growing from within; having a cause internal to the system
An endogenous view (a systems that can view itself internally) helps one see what influences the behavior of the system, and helps one avoid the blaming of others when things go wrong.
When things are not going well in systems, an endogenous view helps people fully examine the internal causes that influence the system’s ill behavior.
This perspective creates a rich environment for productive decision-making and improvement.
3
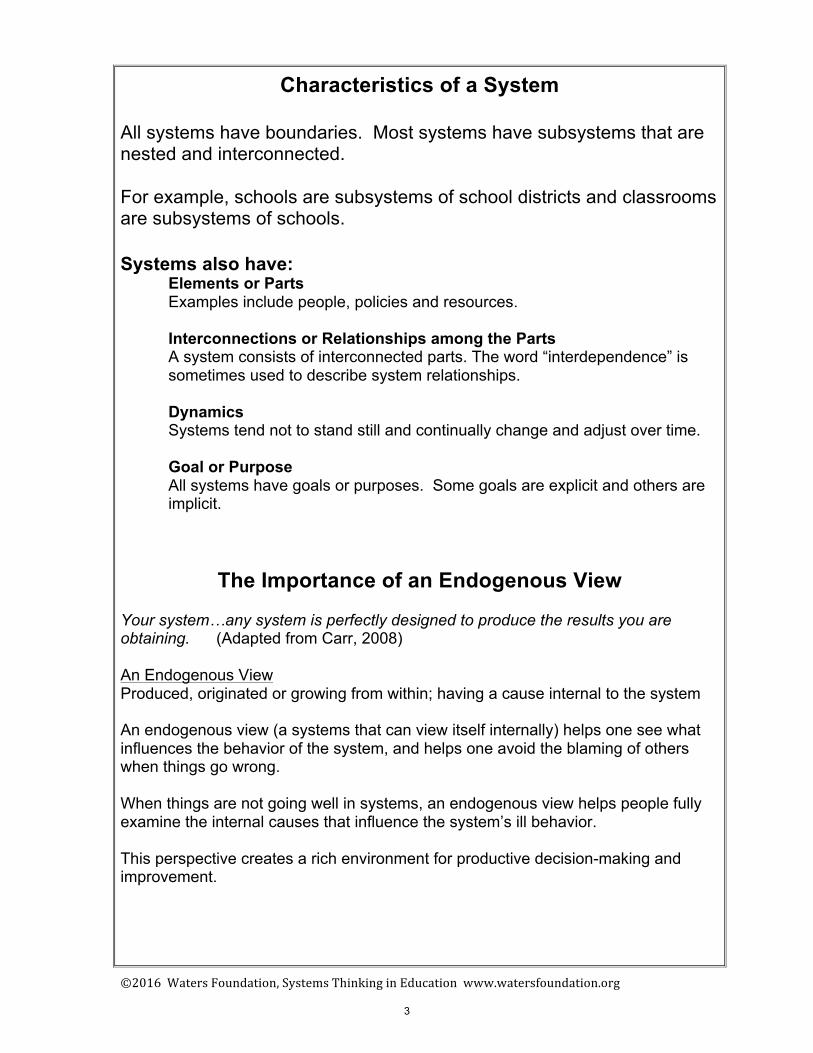
Seeks to understand the big picture
Observes how elements within systems change over time,
generating patterns and trends
Recognizes that a system’s structure generates its behavior
Considers an issue fully and resists the urge to come to a
quick conclusion
Surfaces and tests assumptions
Makes meaningful connections within and
between systems
Checks results and changes actions if needed:
“successive approximation”
Recognizes the impact of time delays when exploring cause
and effect relationships
Pays attention to accumulations and their rates
of change
Considers short-term, long-term and unintended consequences of actions
Uses understanding of system structure to identify possible
leverage actions
Considers how mental models affect current reality
and the future
Identifies the circular nature of complex cause and effect relationships
Changes perspectives to increase understanding
©2014 Waters Foundation
Sugar Vitamins
Cereal Star Super
©2014 Waters Foundation
©2014 Waters Foundation
BANK DonutShop
$$©2014 Waters Foundation
© 2
014
Wat
ers F
ound
atio
n
©20
14 W
ater
s Fo
unda
tion
©2014 Waters Foundation
©201
4 W
ater
s Fo
unda
tion
©2014 Waters Foundation
©20
14 W
ater
s Fo
unda
ti on
Habits of a Systems Thinker
Second Edition ©2014, 2010 Systems Thinking in Schools, Waters Foundation, www.watersfoundation.org
Years
Size
©2014 Waters Foundation
©2014 Waters Foundation
©20
14 W
a ter
s Fou
ndat
ion
©2014 Waters Foundation
4
©2016 Waters Foundation, Systems Thinking in Education www.watersfoundation.org
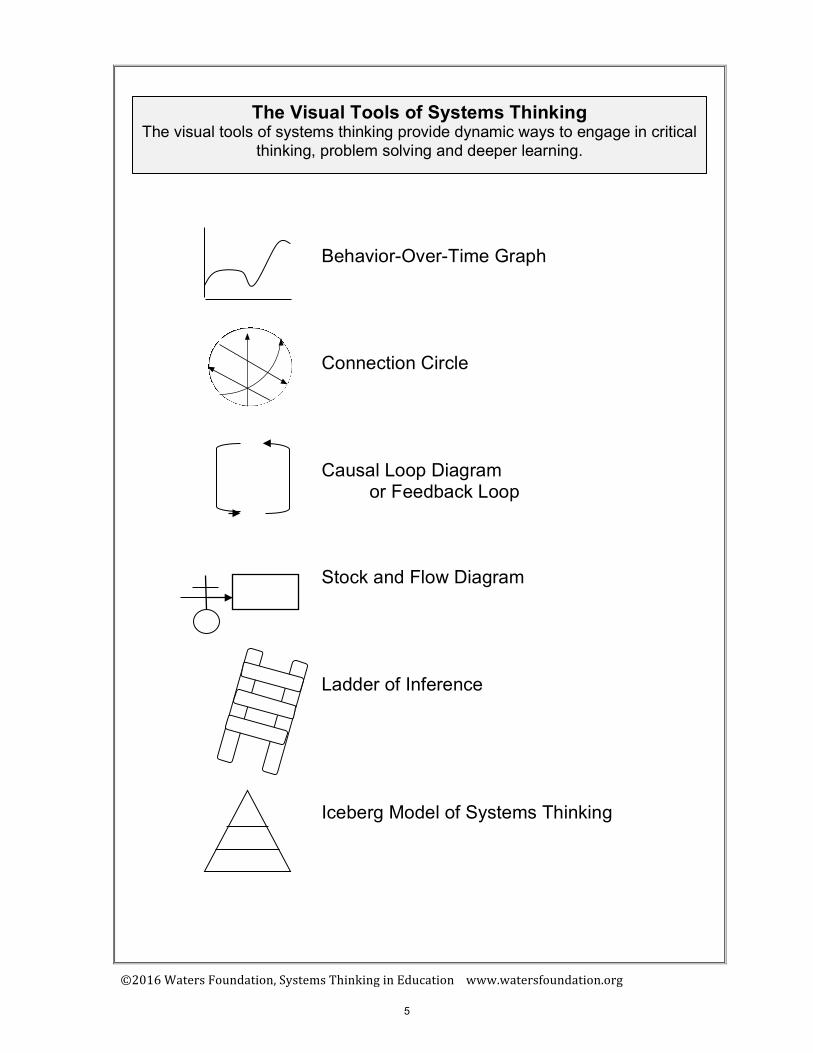
The Visual Tools of Systems Thinking The visual tools of systems thinking provide dynamic ways to engage in critical
thinking, problem solving and deeper learning.
Behavior-Over-Time Graph
Connection Circle
Causal Loop Diagram or Feedback Loop
Stock and Flow Diagram
Ladder of Inference
Iceberg Model of Systems Thinking
5
My
belie
fs a
ffect
wha
t I c
hoos
e to
not
ice
in th
e fu
ture
.
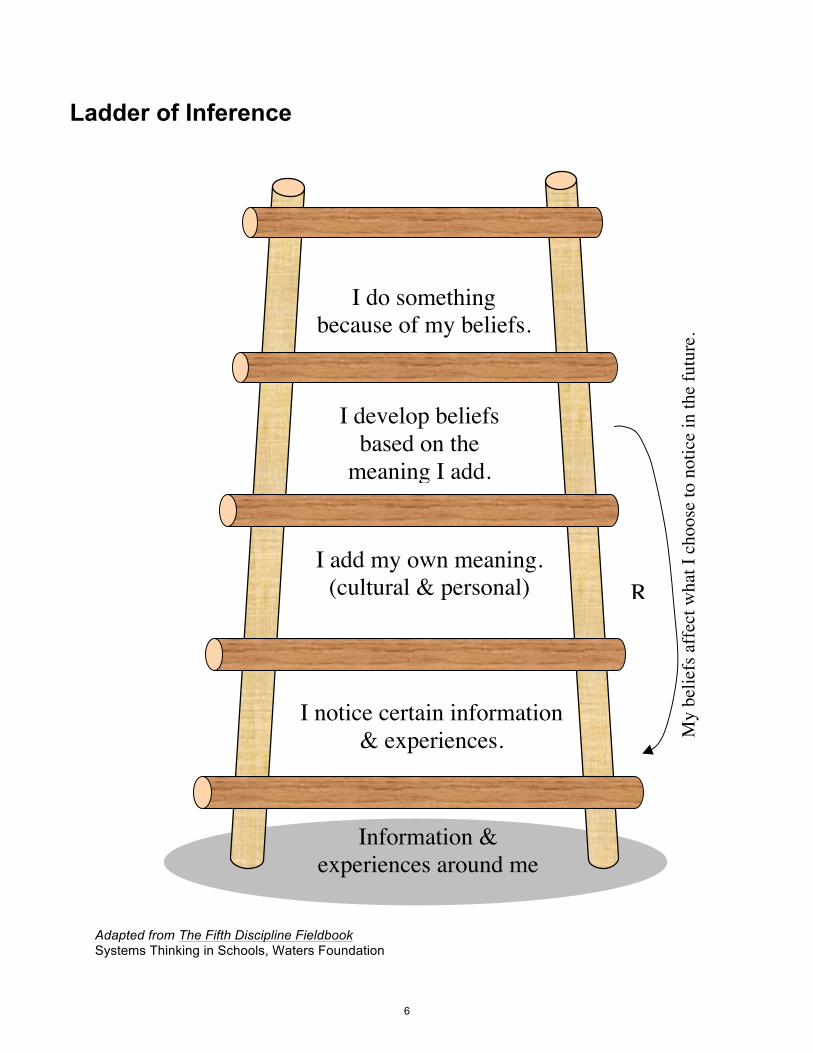
Information & experiences around me
I notice certain information & experiences.
I add my own meaning. (cultural & personal)
I develop beliefs based on the
meaning I add.
I do something because of my beliefs.
R
Ladder of Inference
Adapted from The Fifth Discipline Fieldbook Systems Thinking in Schools, Waters Foundation
6
©2015 Systems Thinking in Schools, Waters Foundation www.watersfoundation.org
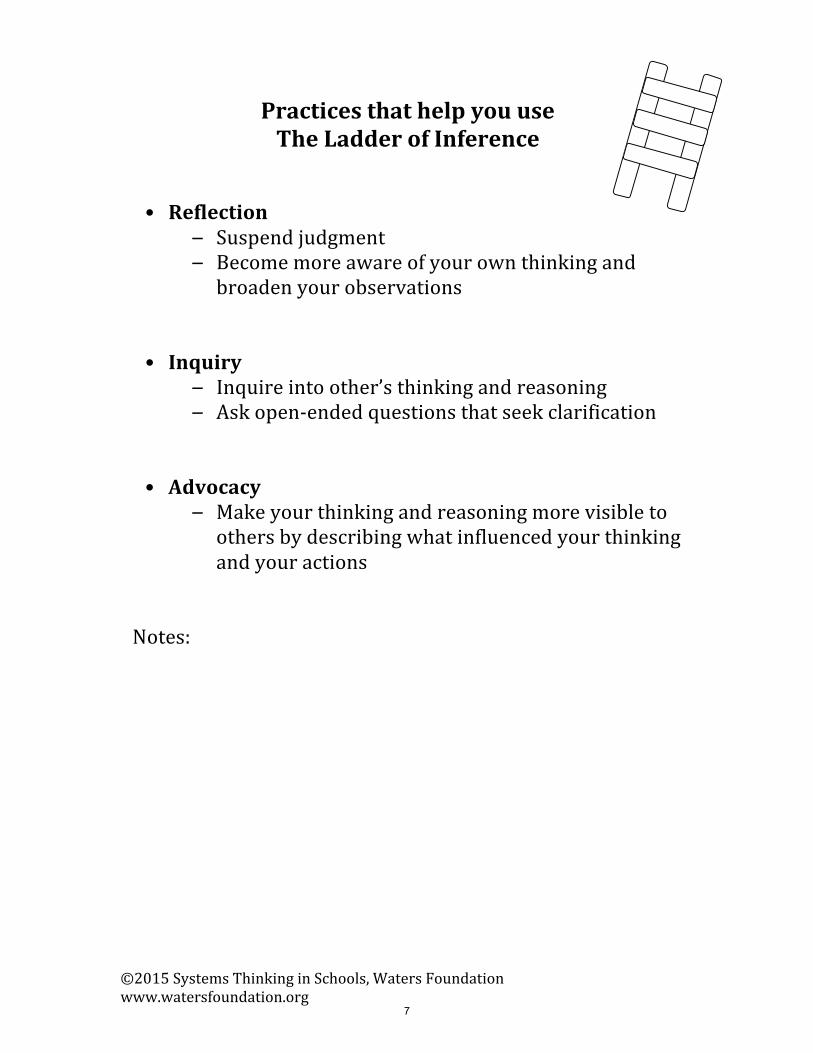
Practices that help you use The Ladder of Inference
• Reflection– Suspend judgment– Become more aware of your own thinking andbroaden your observations
• Inquiry– Inquire into other’s thinking and reasoning– Ask open-‐ended questions that seek clarification
• Advocacy– Make your thinking and reasoning more visible toothers by describing what influenced your thinkingand your actions
Notes:
7
My
belie
fs a
ffect
wha
t I c
hoos
e to
not
ice
in th
e fu
ture
.
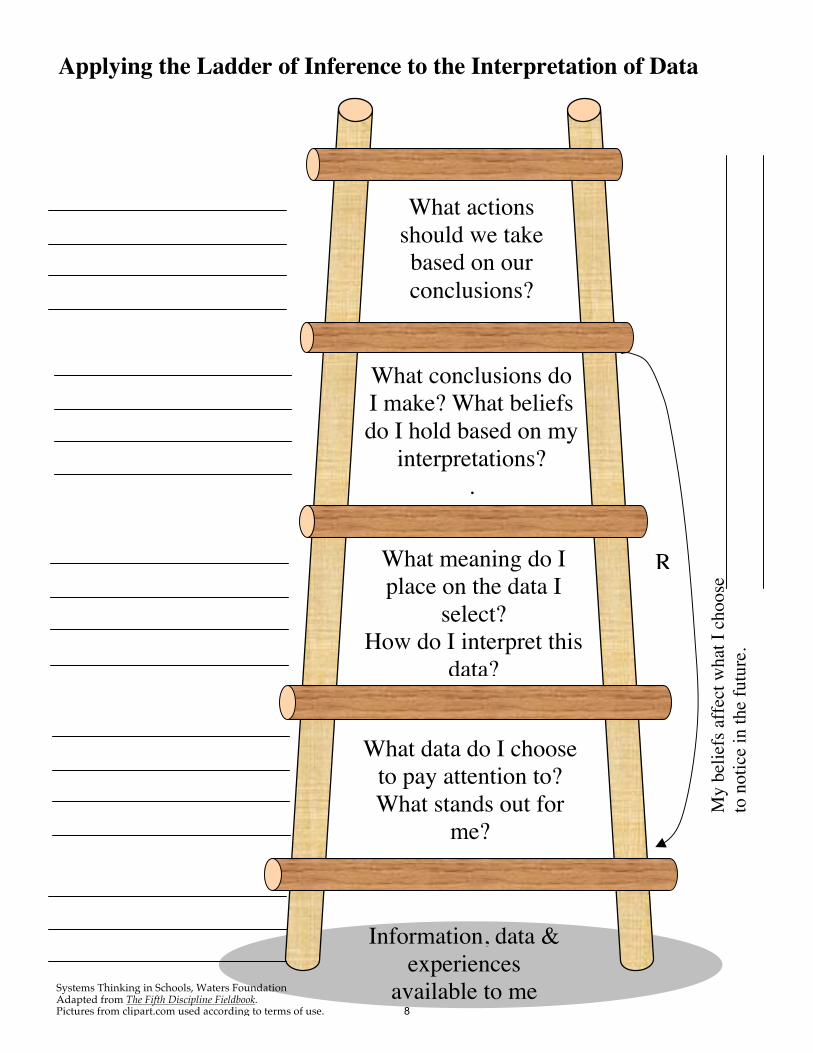
Information, data & experiences
available to me
What data do I choose to pay attention to? What stands out for
me?
What meaning do I place on the data I
select? How do I interpret this
data?
What conclusions do I make? What beliefs do I hold based on my
interpretations? .
What actions should we take based on our conclusions?
R
Applying the Ladder of Inference to the Interpretation of Data
Systems Thinking in Schools, Waters Foundation Adapted from The Fifth Discipline Fieldbook. Pictures from clipart.com used according to terms of use.
8
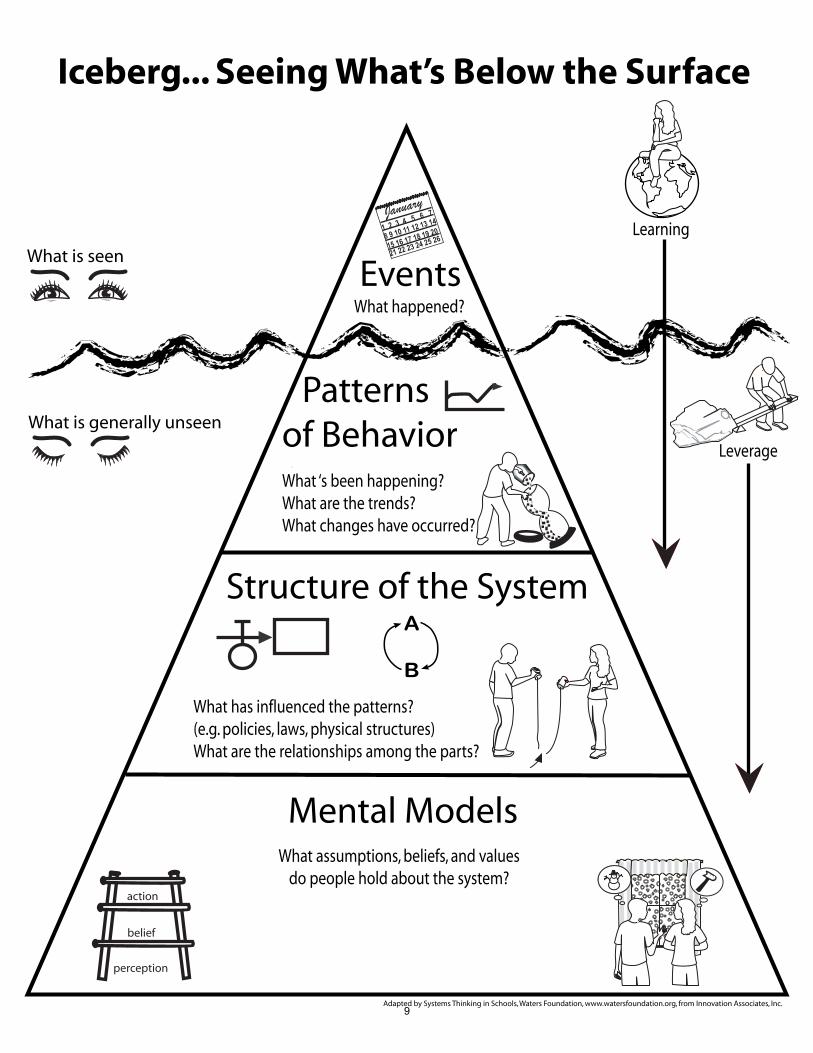
Events
Patterns of Behavior
Structure of the System
Mental Models
What is seen
What is generally unseen
Iceberg... Seeing What’s Below the Surface
What happened?
What ‘s been happening?What are the trends?What changes have occurred?
What has influenced the patterns? (e.g. policies, laws, physical structures)What are the relationships among the parts?
What assumptions, beliefs, and valuesdo people hold about the system?
Adapted by Systems Thinking in Schools, Waters Foundation, www.watersfoundation.org, from Innovation Associates, Inc.
Learning
Leverage
January1 2 3 4 5 6 7
15 16 17 18 19 20 8 9 10 11 12 13 14
21 22 23 24 25 26
perception
belief
action
A
B
9
©2015 Waters Founda2on www.watersfounda2on.org
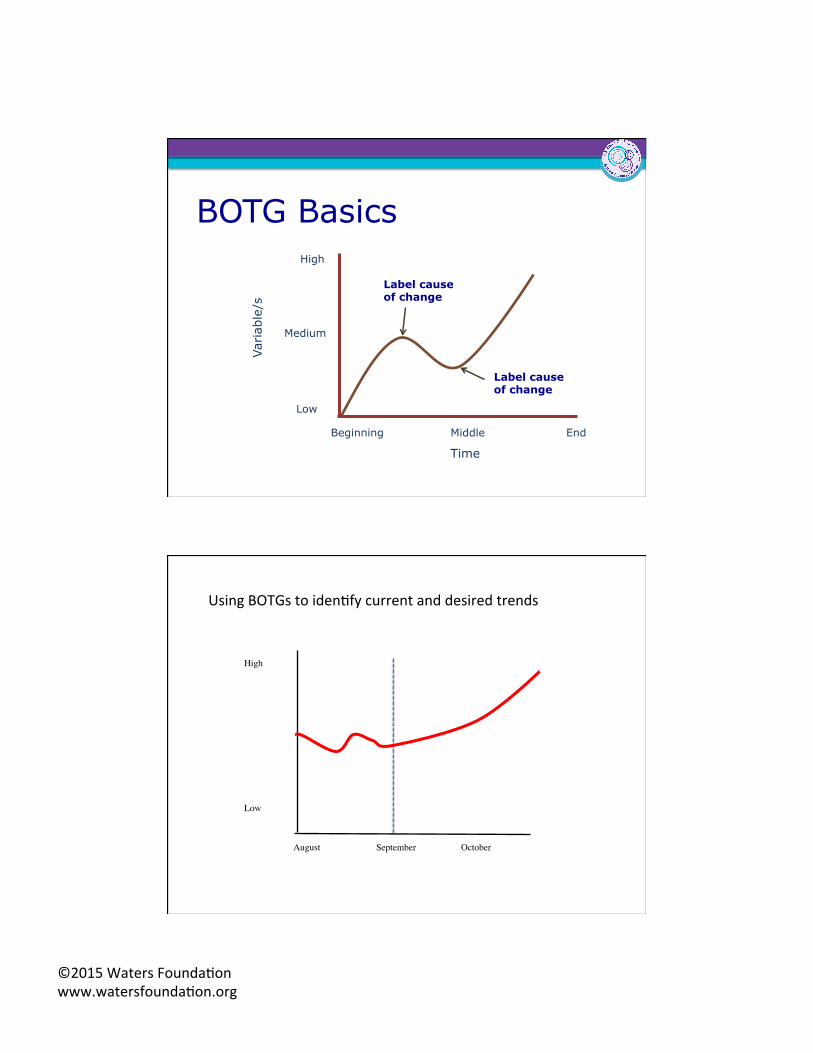
BOTG Basics
Beginning Middle End
Time
High
Medium
Low
Variab
le/s
Label cause of change
Label cause of change
August September October
High Low
Using BOTGs to iden2fy current and desired trends
©2014 Introduction to Systems Thinking Waters Foundation, Systems Thinking in Schools www.watersfoundation.org
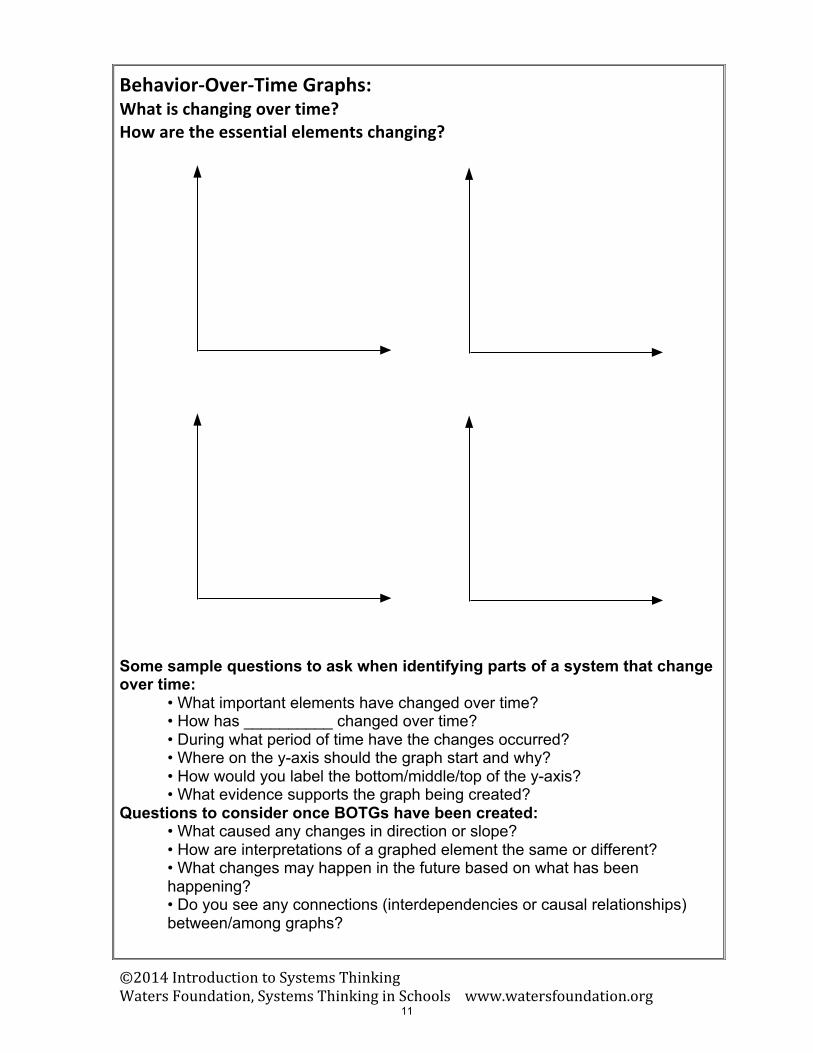
Behavior-‐Over-‐Time Graphs: What is changing over time? How are the essential elements changing?
Some sample questions to ask when identifying parts of a system that change over time:
• What important elements have changed over time?• How has __________ changed over time?• During what period of time have the changes occurred?• Where on the y-axis should the graph start and why?• How would you label the bottom/middle/top of the y-axis?• What evidence supports the graph being created?
Questions to consider once BOTGs have been created: • What caused any changes in direction or slope?• How are interpretations of a graphed element the same or different?• What changes may happen in the future based on what has beenhappening?• Do you see any connections (interdependencies or causal relationships)between/among graphs?
11
©2013 Introduction to Systems Thinking Waters Foundation, Systems Thinking in Schools www.watersfoundation.org
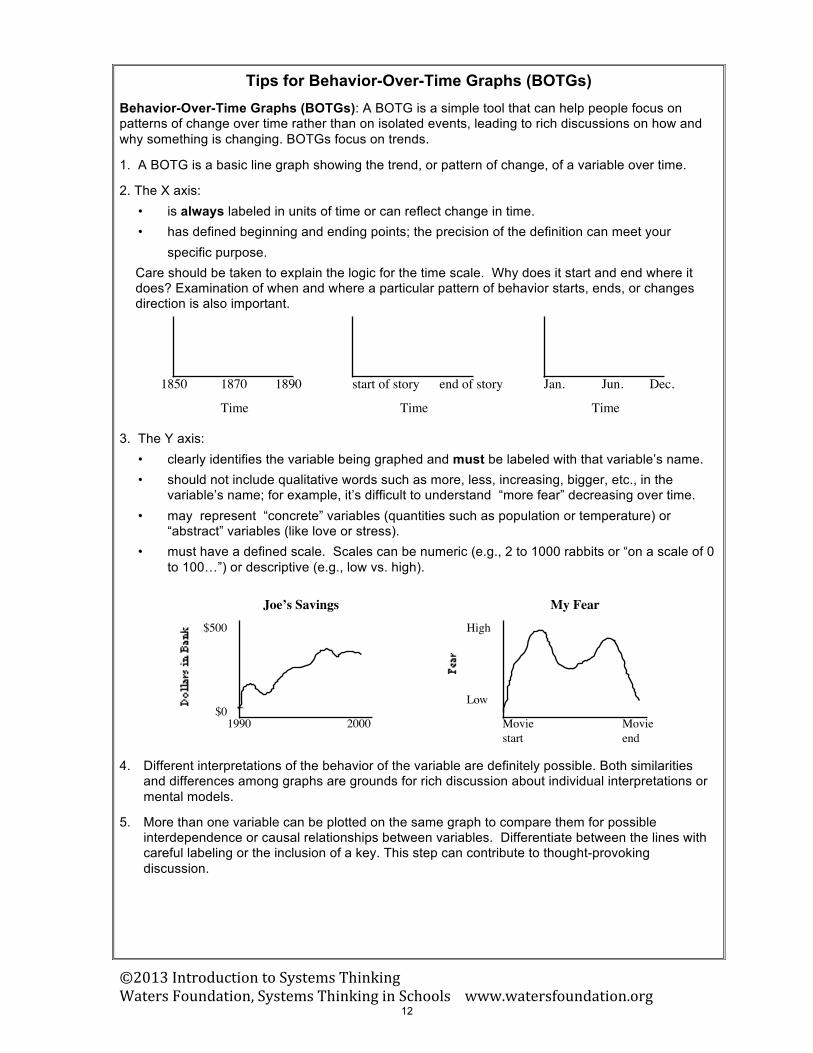
Tips for Behavior-Over-Time Graphs (BOTGs) Behavior-Over-Time Graphs (BOTGs): A BOTG is a simple tool that can help people focus on patterns of change over time rather than on isolated events, leading to rich discussions on how and why something is changing. BOTGs focus on trends.
1. A BOTG is a basic line graph showing the trend, or pattern of change, of a variable over time.
2. The X axis:• is always labeled in units of time or can reflect change in time.• has defined beginning and ending points; the precision of the definition can meet your
specific purpose.Care should be taken to explain the logic for the time scale. Why does it start and end where it does? Examination of when and where a particular pattern of behavior starts, ends, or changes direction is also important.
3. The Y axis:• clearly identifies the variable being graphed and must be labeled with that variable’s name.• should not include qualitative words such as more, less, increasing, bigger, etc., in the
variable’s name; for example, it’s difficult to understand “more fear” decreasing over time.• may represent “concrete” variables (quantities such as population or temperature) or
“abstract” variables (like love or stress).• must have a defined scale. Scales can be numeric (e.g., 2 to 1000 rabbits or “on a scale of 0
to 100…”) or descriptive (e.g., low vs. high).
4. Different interpretations of the behavior of the variable are definitely possible. Both similaritiesand differences among graphs are grounds for rich discussion about individual interpretations ormental models.
5. More than one variable can be plotted on the same graph to compare them for possibleinterdependence or causal relationships between variables. Differentiate between the lines withcareful labeling or the inclusion of a key. This step can contribute to thought-provokingdiscussion.
1850 1870 1890 start of story end of story Jan. Jun. Dec.
Time Time Time
Joe’s Savings
$500
$01990 2000
My Fear
High
Low
Moviestart
Movieend
12
©2016 Waters Foundation, Systems Thinking in Education watersfoundation.org
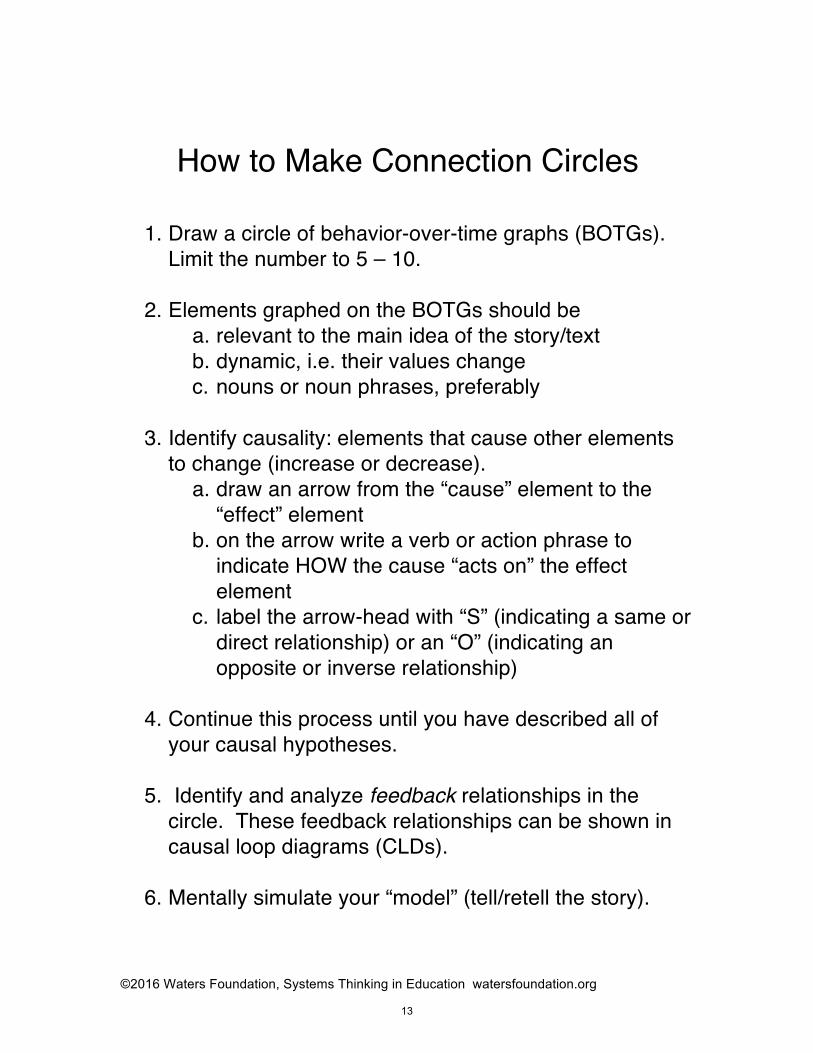
How to Make Connection Circles
1. Draw a circle of behavior-over-time graphs (BOTGs).Limit the number to 5 – 10.
2. Elements graphed on the BOTGs should bea. relevant to the main idea of the story/textb. dynamic, i.e. their values changec. nouns or noun phrases, preferably
3. Identify causality: elements that cause other elementsto change (increase or decrease).
a. draw an arrow from the “cause” element to the“effect” element
b. on the arrow write a verb or action phrase toindicate HOW the cause “acts on” the effectelement
c. label the arrow-head with “S” (indicating a same ordirect relationship) or an “O” (indicating anopposite or inverse relationship)
4. Continue this process until you have described all ofyour causal hypotheses.
5. Identify and analyze feedback relationships in thecircle. These feedback relationships can be shown incausal loop diagrams (CLDs).
6. Mentally simulate your “model” (tell/retell the story).
13
©2016 Waters Foundation, Systems Thinking in Education www.watersfoundation.org
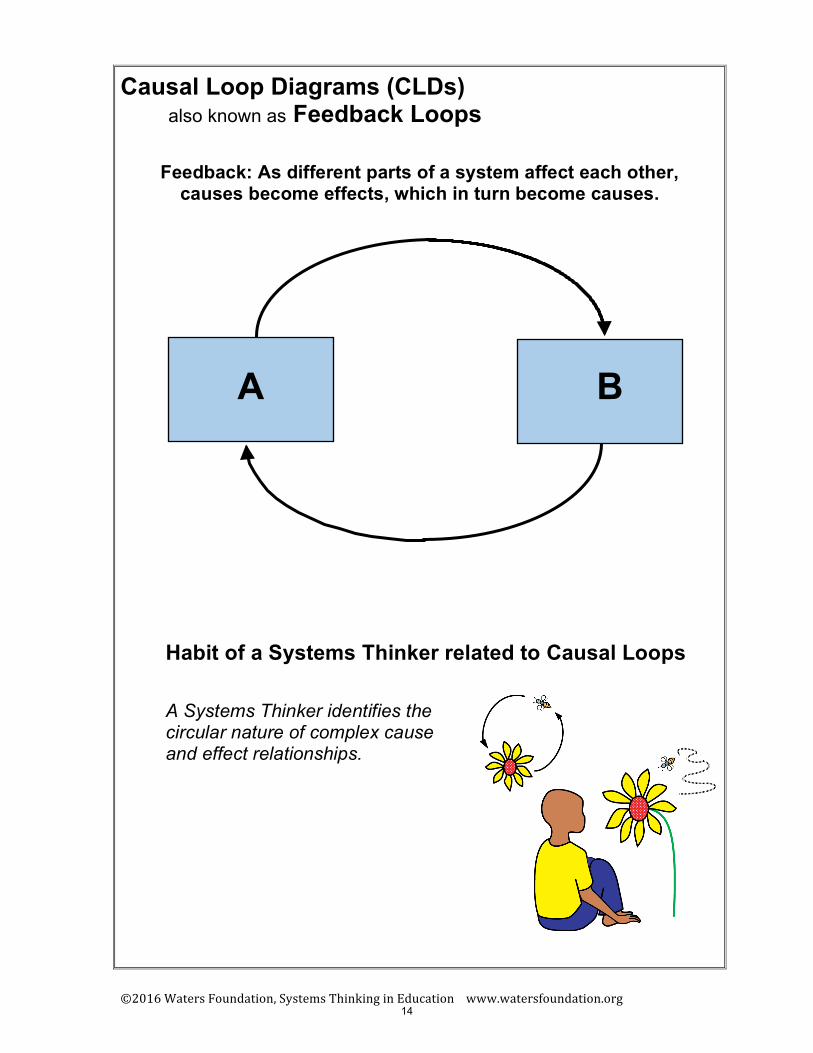
Causal Loop Diagrams (CLDs) also known as Feedback Loops
Feedback: As different parts of a system affect each other, causes become effects, which in turn become causes.
Habit of a Systems Thinker related to Causal Loops
A Systems Thinker identifies the circular nature of complex cause and effect relationships.
A B
14
©2016 Waters Foundation, Systems Thinking in Education www.watersfoundation.org
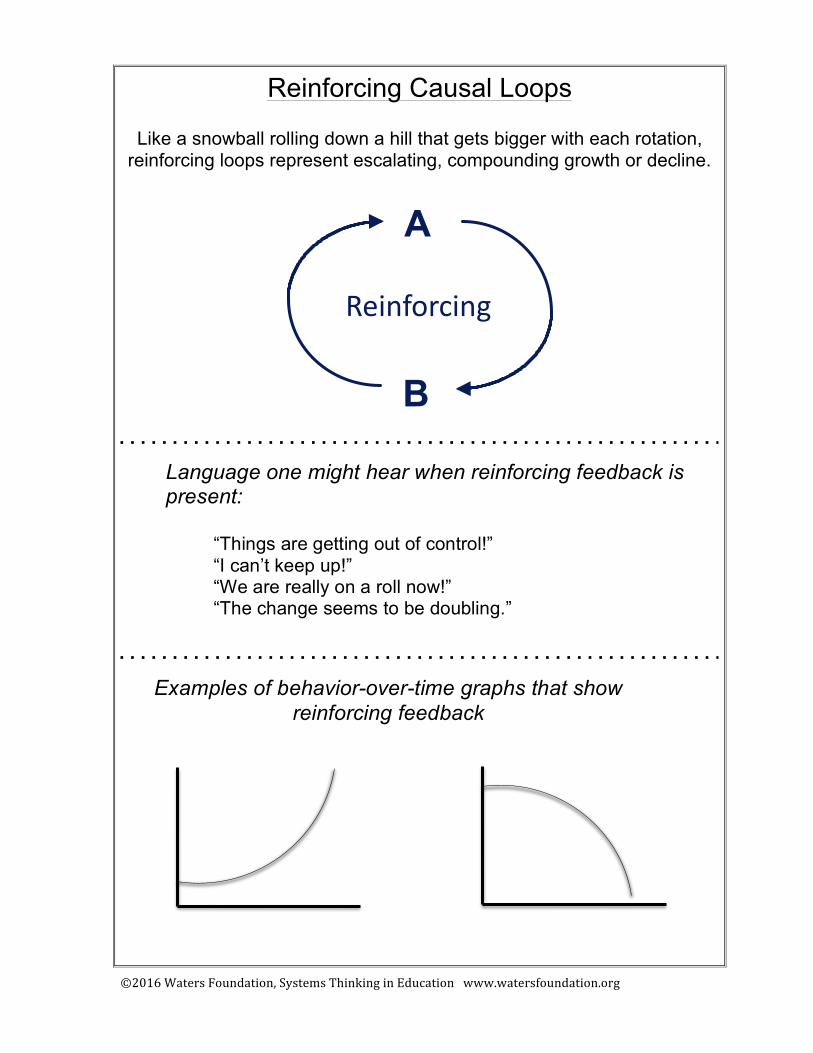
Reinforcing Causal Loops
Like a snowball rolling down a hill that gets bigger with each rotation, reinforcing loops represent escalating, compounding growth or decline.
A
B
Reinforcing
Language one might hear when reinforcing feedback is present:
“Things are getting out of control!” “I can’t keep up!” “We are really on a roll now!” “The change seems to be doubling.”
Examples of behavior-over-time graphs that show reinforcing feedback
©2016 Waters Foundation, Systems Thinking in Education www.watersfoundation.org
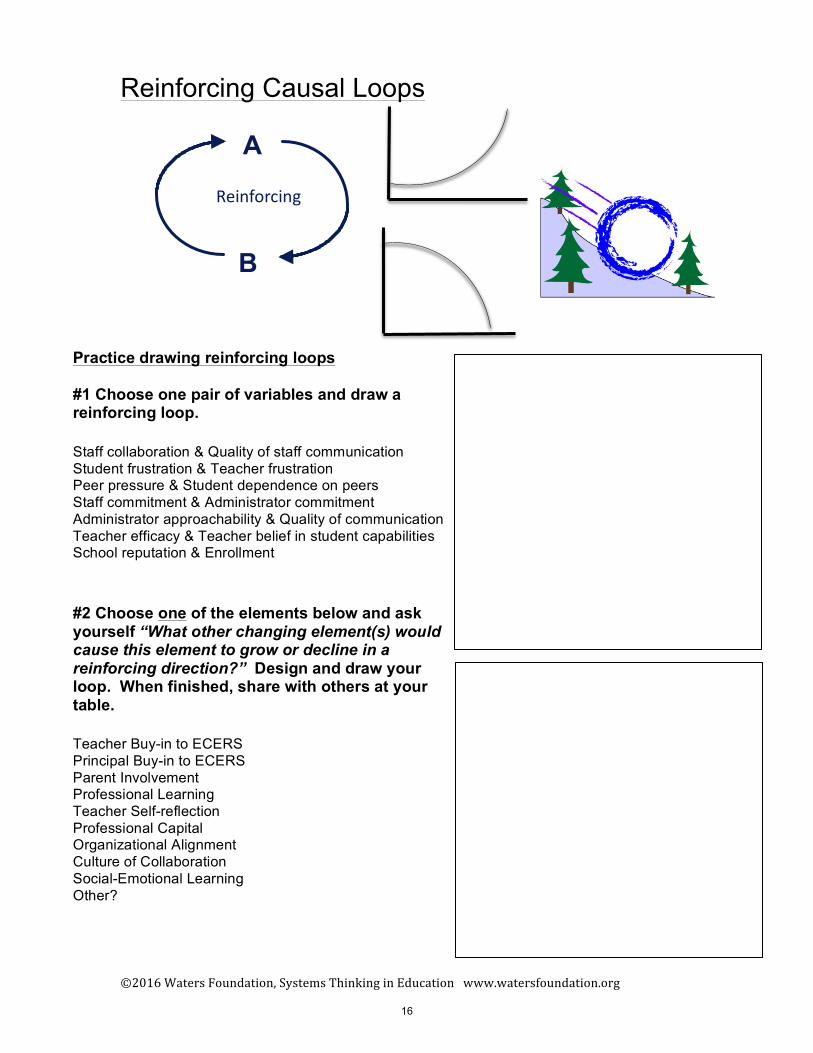
Reinforcing Causal Loops
A
B
Reinforcing
Practice drawing reinforcing loops
#1 Choose one pair of variables and draw a reinforcing loop.
Staff collaboration & Quality of staff communication Student frustration & Teacher frustration Peer pressure & Student dependence on peers Staff commitment & Administrator commitment Administrator approachability & Quality of communication Teacher efficacy & Teacher belief in student capabilities School reputation & Enrollment
#2 Choose one of the elements below and ask yourself “What other changing element(s) would cause this element to grow or decline in a reinforcing direction?” Design and draw your loop. When finished, share with others at your table.
Teacher Buy-in to ECERS Principal Buy-in to ECERS Parent Involvement Professional Learning Teacher Self-reflection Professional Capital Organizational Alignment Culture of Collaboration Social-Emotional Learning Other?
16
©2016 Waters Foundation, Systems Thinking in Education www.watersfoundation.org
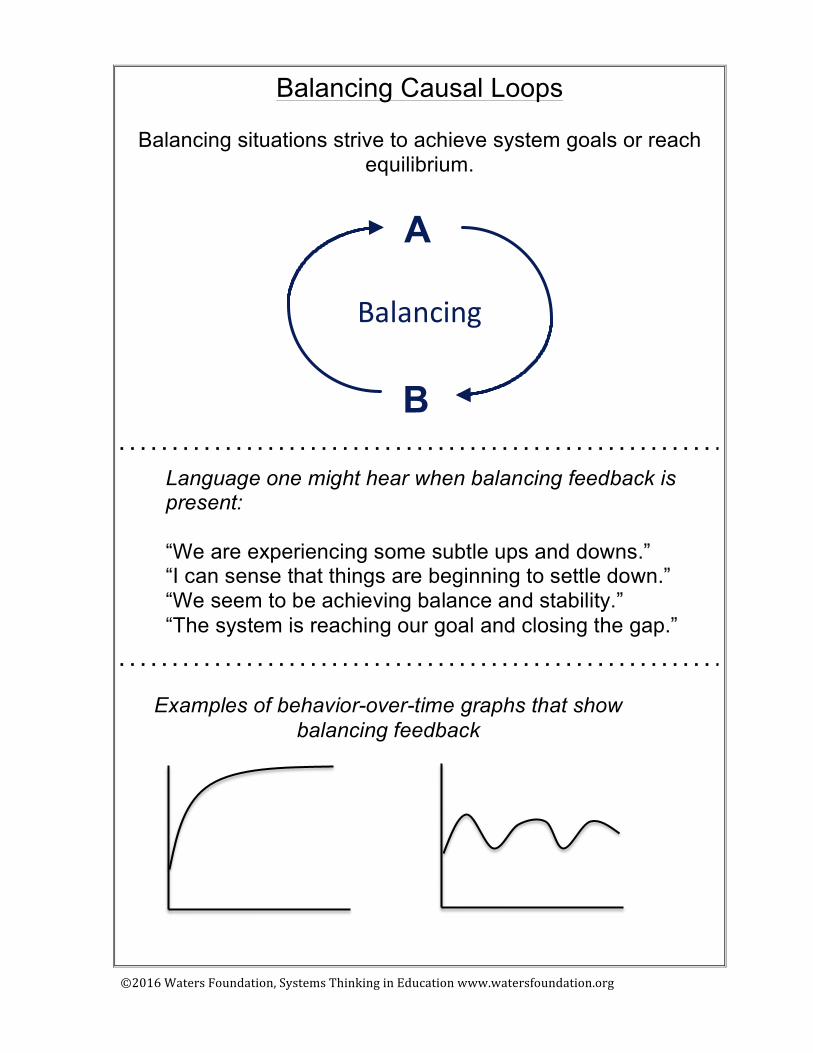
Balancing Causal Loops
Balancing situations strive to achieve system goals or reach equilibrium.
A
B
Balancing
Language one might hear when balancing feedback is present: “We are experiencing some subtle ups and downs.” “I can sense that things are beginning to settle down.” “We seem to be achieving balance and stability.” “The system is reaching our goal and closing the gap.”
Examples of behavior-over-time graphs that show balancing feedback
1
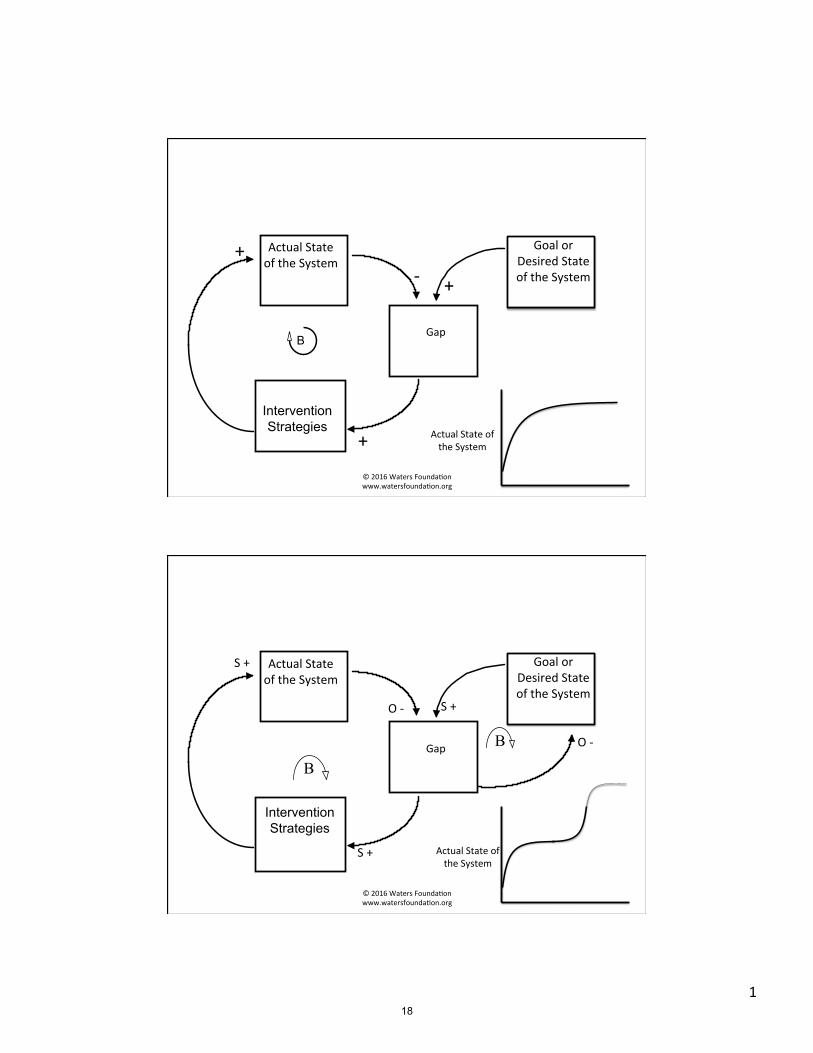
Actual State of the System
Goal or Desired State of the System
Intervention Strategies
+
Gap
+ -‐ +
Actual State of the System
B
© 2016 Waters Founda@on [email protected]
Actual State of the System
Goal or Desired State of the System
Intervention Strategies
S +
Gap
S + O -‐
S +
Actual State of the System
O -‐ B
B
© 2016 Waters Founda@on [email protected]
18
©2016 Waters Foundation, Systems Thinking in Education www.watersfoundation.org
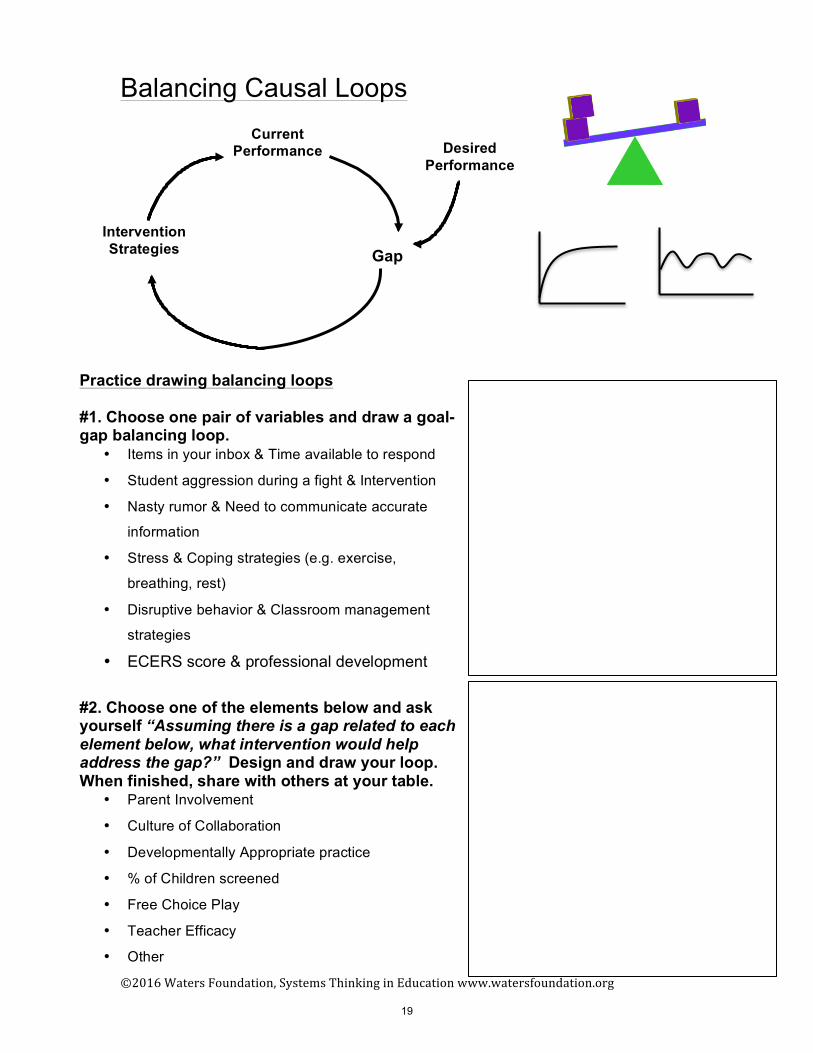
Balancing Causal Loops
Practice drawing balancing loops
#1. Choose one pair of variables and draw a goal-gap balancing loop.
• Items in your inbox & Time available to respond
• Student aggression during a fight & Intervention
• Nasty rumor & Need to communicate accurate
information
• Stress & Coping strategies (e.g. exercise,
breathing, rest)
• Disruptive behavior & Classroom management
strategies
• ECERS score & professional development
#2. Choose one of the elements below and ask yourself “Assuming there is a gap related to each element below, what intervention would help address the gap?” Design and draw your loop. When finished, share with others at your table.
• Parent Involvement
• Culture of Collaboration
• Developmentally Appropriate practice
• % of Children screened
• Free Choice Play
• Teacher Efficacy
• Other
Intervention Strategies
Current Performance
Gap
Desired Performance
19
©2015 Waters Foundation, Systems Thinking Group www.watersfoundation.org
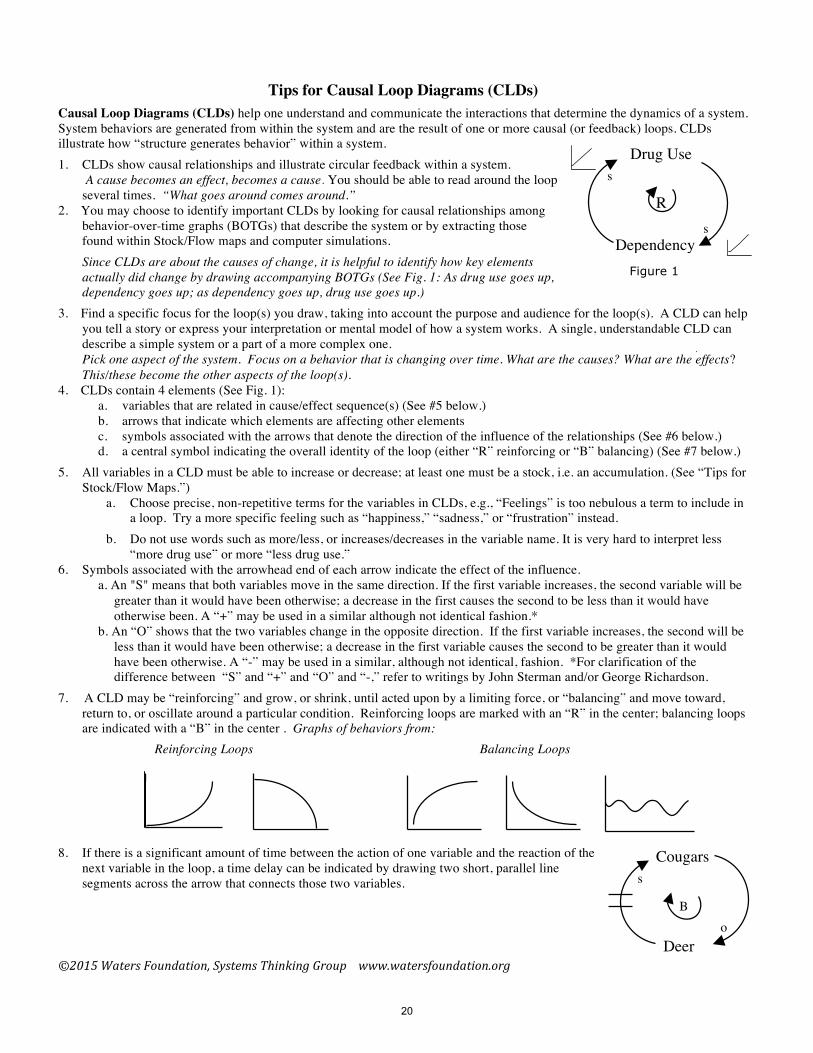
Tips for Causal Loop Diagrams (CLDs) Causal Loop Diagrams (CLDs) help one understand and communicate the interactions that determine the dynamics of a system. System behaviors are generated from within the system and are the result of one or more causal (or feedback) loops. CLDs illustrate how “structure generates behavior” within a system. 1. CLDs show causal relationships and illustrate circular feedback within a system.
A cause becomes an effect, becomes a cause. You should be able to read around the loopseveral times. “What goes around comes around.”
2. You may choose to identify important CLDs by looking for causal relationships amongbehavior-over-time graphs (BOTGs) that describe the system or by extracting thosefound within Stock/Flow maps and computer simulations.Since CLDs are about the causes of change, it is helpful to identify how key elementsactually did change by drawing accompanying BOTGs (See Fig. 1: As drug use goes up,dependency goes up; as dependency goes up, drug use goes up.)
3. Find a specific focus for the loop(s) you draw, taking into account the purpose and audience for the loop(s). A CLD can helpyou tell a story or express your interpretation or mental model of how a system works. A single, understandable CLD candescribe a simple system or a part of a more complex one.Pick one aspect of the system. Focus on a behavior that is changing over time. What are the causes? What are the effects?This/these become the other aspects of the loop(s).
4. CLDs contain 4 elements (See Fig. 1):a. variables that are related in cause/effect sequence(s) (See #5 below.)b. arrows that indicate which elements are affecting other elementsc. symbols associated with the arrows that denote the direction of the influence of the relationships (See #6 below.)d. a central symbol indicating the overall identity of the loop (either “R” reinforcing or “B” balancing) (See #7 below.)
5. All variables in a CLD must be able to increase or decrease; at least one must be a stock, i.e. an accumulation. (See “Tips forStock/Flow Maps.”)
a. Choose precise, non-repetitive terms for the variables in CLDs, e.g., “Feelings” is too nebulous a term to include ina loop. Try a more specific feeling such as “happiness,” “sadness,” or “frustration” instead.
b. Do not use words such as more/less, or increases/decreases in the variable name. It is very hard to interpret less“more drug use” or more “less drug use.”
6. Symbols associated with the arrowhead end of each arrow indicate the effect of the influence.a. An "S" means that both variables move in the same direction. If the first variable increases, the second variable will be
greater than it would have been otherwise; a decrease in the first causes the second to be less than it would haveotherwise been. A “+” may be used in a similar although not identical fashion.*
b. An “O” shows that the two variables change in the opposite direction. If the first variable increases, the second will beless than it would have been otherwise; a decrease in the first variable causes the second to be greater than it wouldhave been otherwise. A “-” may be used in a similar, although not identical, fashion. *For clarification of thedifference between “S” and “+” and “O” and “-,” refer to writings by John Sterman and/or George Richardson.
7. A CLD may be “reinforcing” and grow, or shrink, until acted upon by a limiting force, or “balancing” and move toward,return to, or oscillate around a particular condition. Reinforcing loops are marked with an “R” in the center; balancing loopsare indicated with a “B” in the center . Graphs of behaviors from:
Reinforcing Loops Balancing Loops
8. If there is a significant amount of time between the action of one variable and the reaction of thenext variable in the loop, a time delay can be indicated by drawing two short, parallel linesegments across the arrow that connects those two variables.
Drug Use
Dependency s
s
Figure 1
R
o
s
B
Cougars
Deer
20
©2015 Waters Founda2on www.watersfounda2on.org
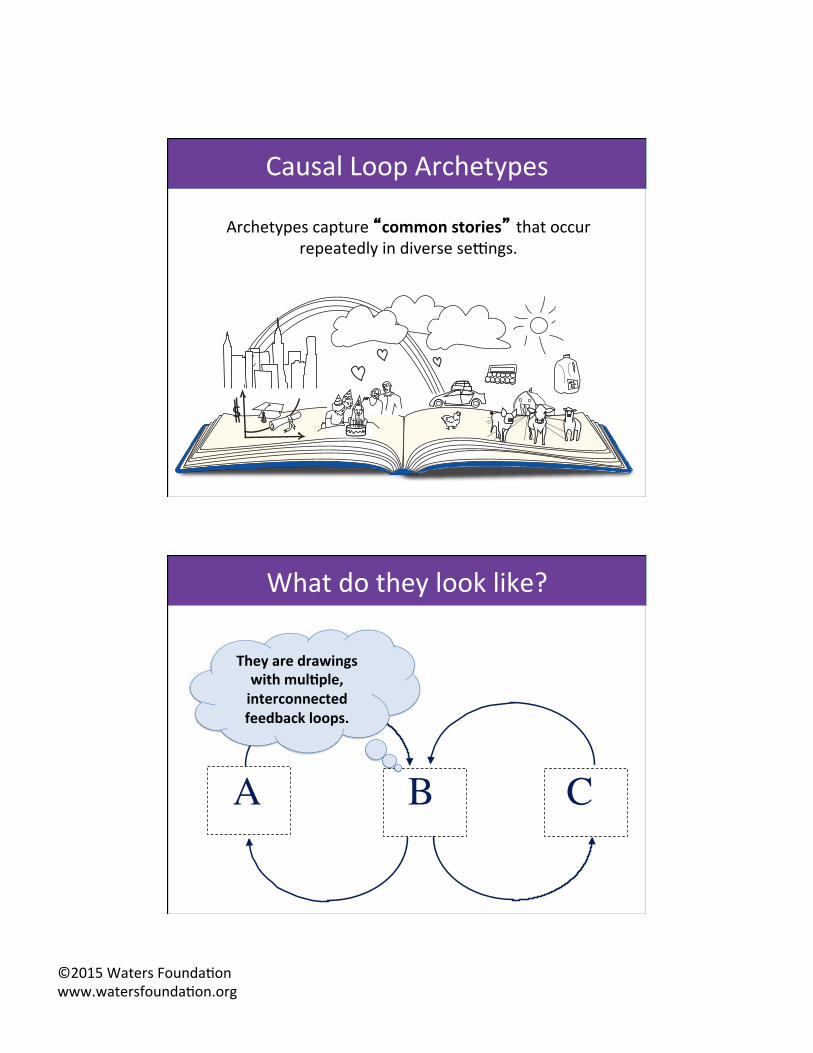
Archetypes capture “common stories” that occur repeatedly in diverse se?ngs.
Causal Loop Archetypes
A B C
They are drawings with mul4ple, interconnected feedback loops.
What do they look like?
©2015 Waters Founda2on www.watersfounda2on.org
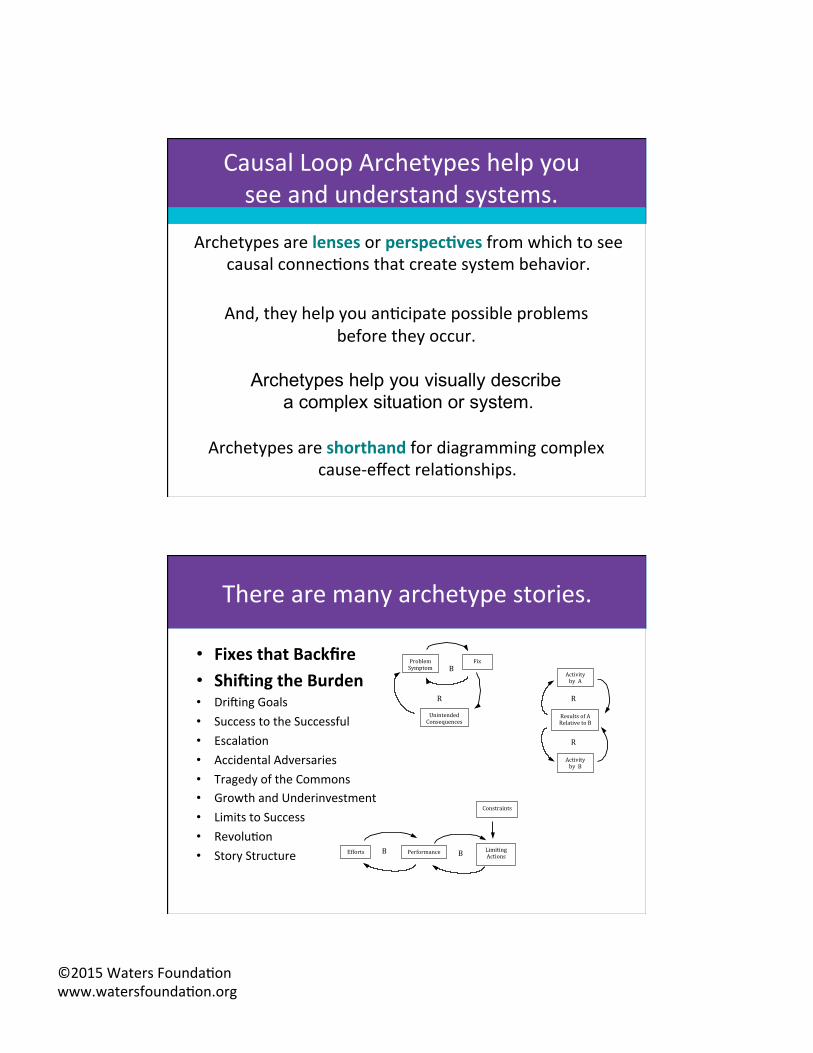
Archetypes are lenses or perspec4ves from which to see causal connec2ons that create system behavior.
And, they help you an2cipate possible problems
before they occur.
Archetypes help you visually describe a complex situation or system.
Archetypes are shorthand for diagramming complex
cause-‐effect rela2onships.
Causal Loop Archetypes help you see and understand systems.
• Fixes that Backfire • ShiAing the Burden • DriKing Goals • Success to the Successful • Escala2on • Accidental Adversaries • Tragedy of the Commons • Growth and Underinvestment • Limits to Success • Revolu2on • Story Structure
Activity by A
Activity by B
Results of A Relative to B
R
R
Problem Symptom Fix
Unintended Consequences
B
R
Constraints
Limiting Actions Performance Efforts B B
There are many archetype stories.
©2015 Waters Founda2on www.watersfounda2on.org
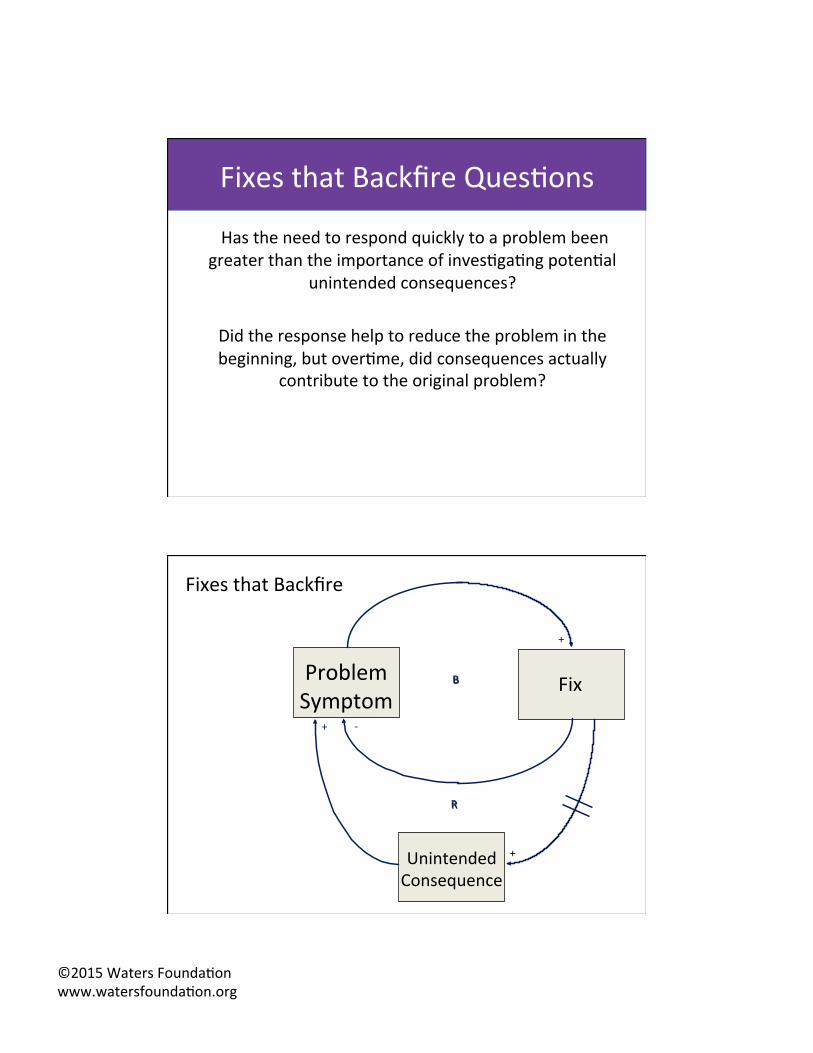
Has the need to respond quickly to a problem been greater than the importance of inves2ga2ng poten2al
unintended consequences?
Did the response help to reduce the problem in the beginning, but over2me, did consequences actually
contribute to the original problem?
Fixes that Backfire Ques2ons
Problem Symptom
Fix
+
-‐
B
Unintended Consequence
+
R
+
Fixes that Backfire
Fix
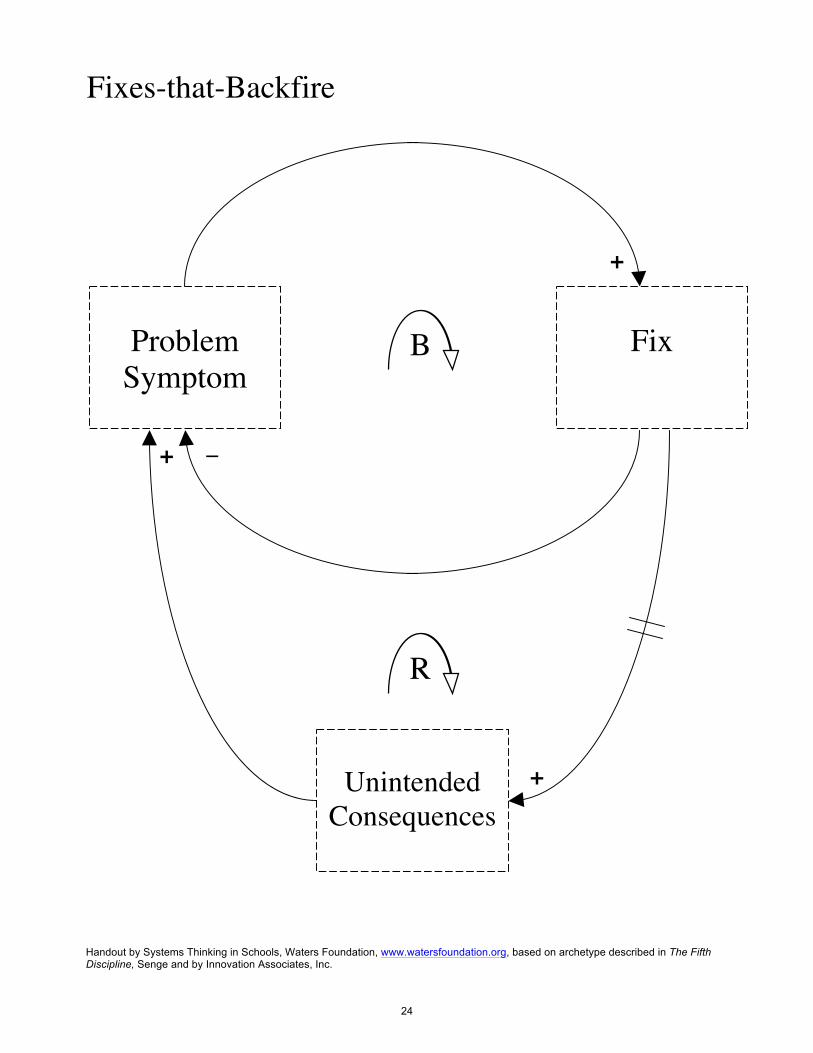
Fixes-that-Backfire
B
R
_
+
Unintended Consequences
Problem Symptom
+
+
Handout by Systems Thinking in Schools, Waters Foundation, www.watersfoundation.org, based on archetype described in The Fifth Discipline, Senge and by Innovation Associates, Inc.
24
©2016 Waters Foundation Systems Thinking in Education watersfoundation.org
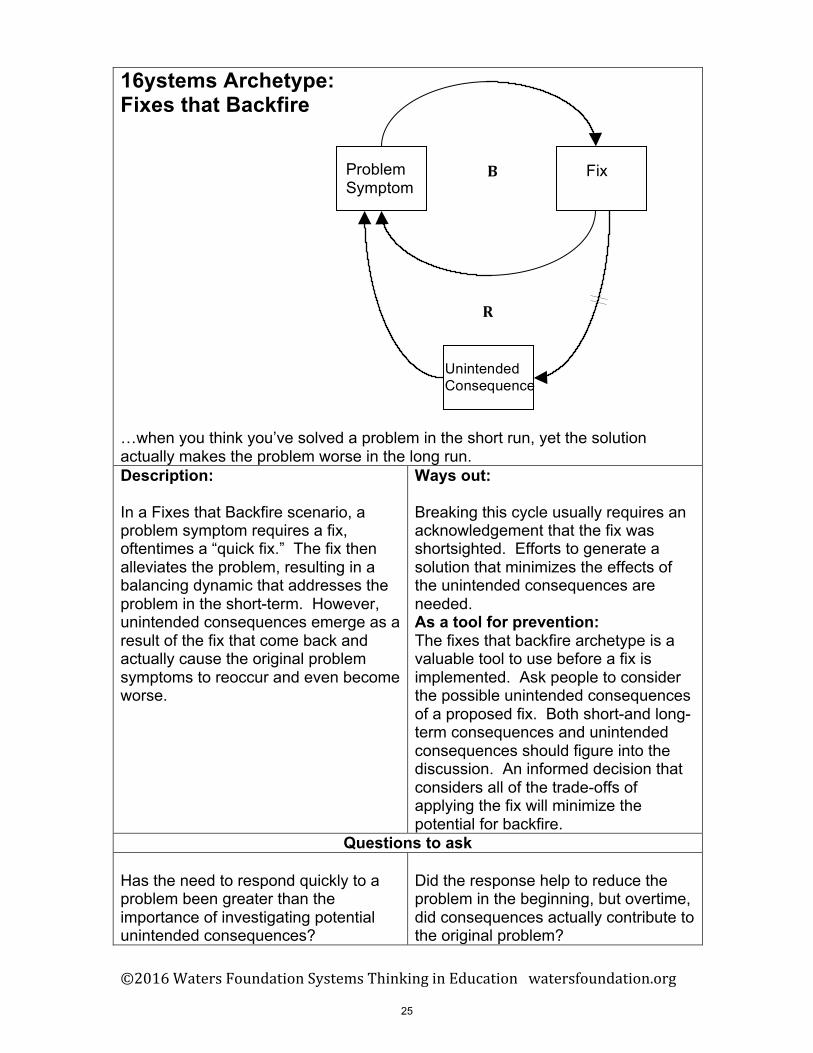
16ystems Archetype: Fixes that Backfire
…when you think you’ve solved a problem in the short run, yet the solution actually makes the problem worse in the long run. Description:
In a Fixes that Backfire scenario, a problem symptom requires a fix, oftentimes a “quick fix.” The fix then alleviates the problem, resulting in a balancing dynamic that addresses the problem in the short-term. However, unintended consequences emerge as a result of the fix that come back and actually cause the original problem symptoms to reoccur and even become worse.
Ways out:
Breaking this cycle usually requires an acknowledgement that the fix was shortsighted. Efforts to generate a solution that minimizes the effects of the unintended consequences are needed. As a tool for prevention: The fixes that backfire archetype is a valuable tool to use before a fix is implemented. Ask people to consider the possible unintended consequences of a proposed fix. Both short-and long-term consequences and unintended consequences should figure into the discussion. An informed decision that considers all of the trade-offs of applying the fix will minimize the potential for backfire.
Questions to ask
Has the need to respond quickly to a problem been greater than the importance of investigating potential unintended consequences?
Did the response help to reduce the problem in the beginning, but overtime, did consequences actually contribute to the original problem?
Problem Symptom
Fix
Unintended Consequence
B
R
25
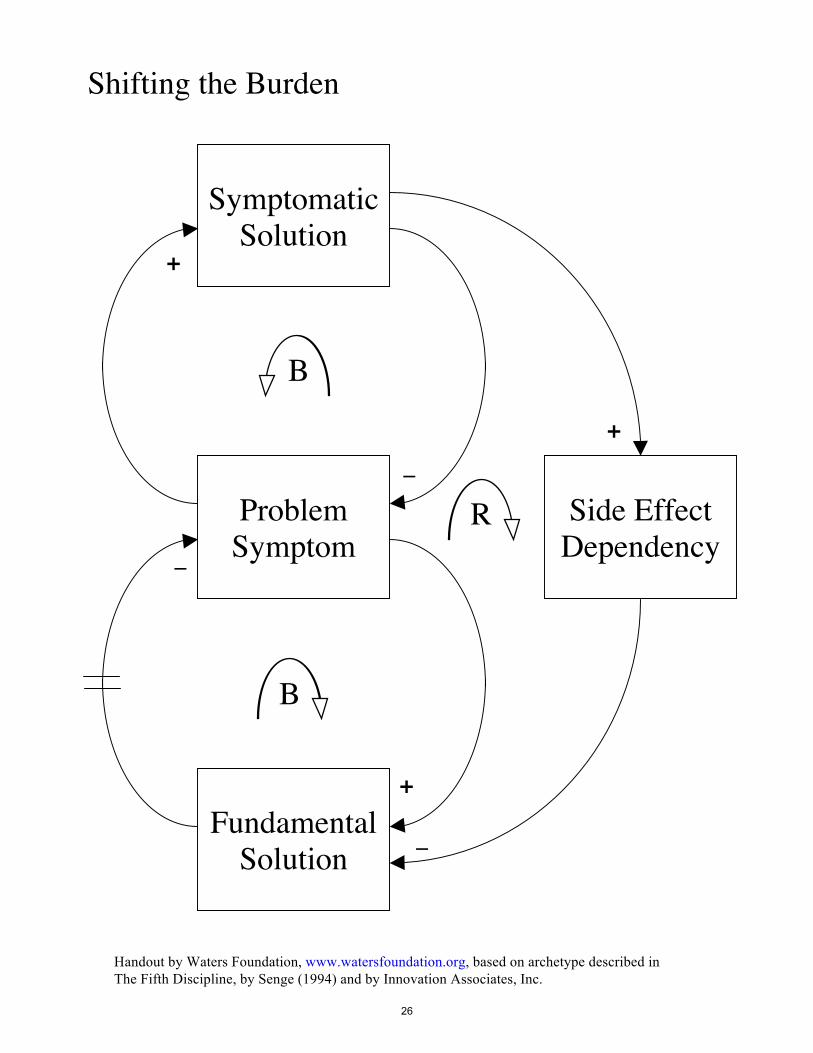
Symptomatic Solution
Shifting the Burden
B
R
_
+
Problem Symptom
Fundamental Solution
Side Effect Dependency
B
+
+
_
_
Handout by Waters Foundation, www.watersfoundation.org, based on archetype described in The Fifth Discipline, by Senge (1994) and by Innovation Associates, Inc.
26
©2016 Waters Foundation Systems Thinking in Education watersfoundation.org
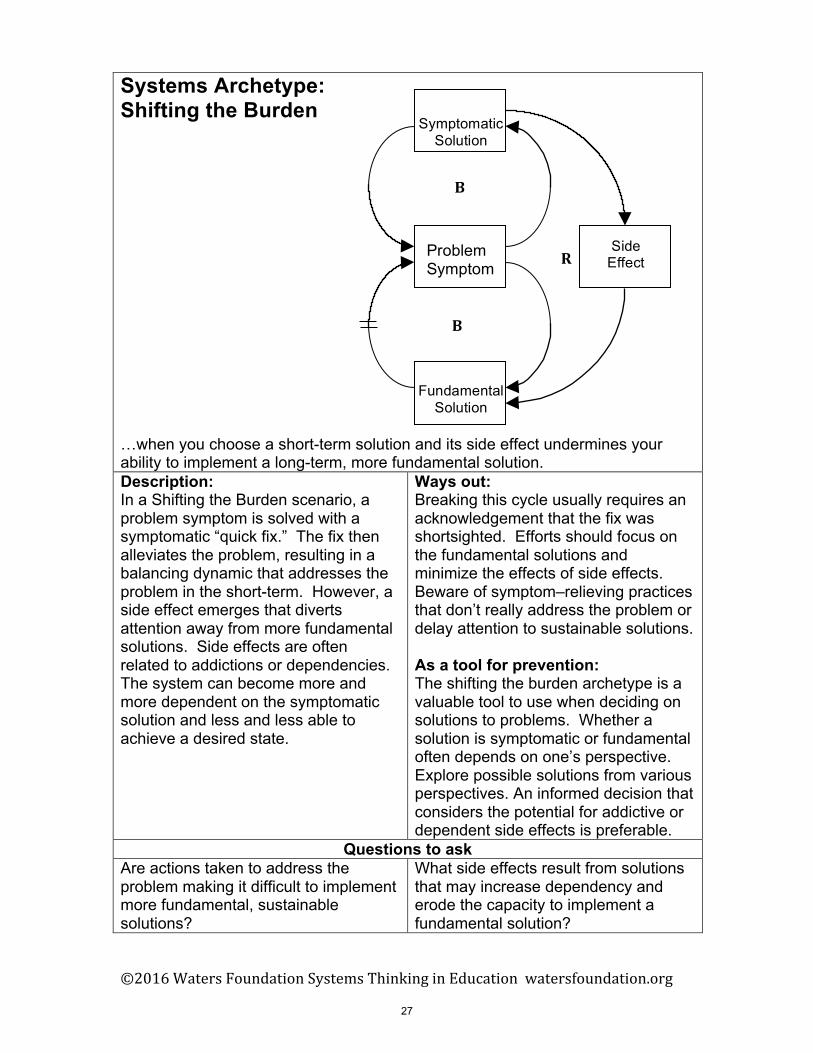
Systems Archetype: Shifting the Burden
…when you choose a short-term solution and its side effect undermines your ability to implement a long-term, more fundamental solution. Description: In a Shifting the Burden scenario, a problem symptom is solved with a symptomatic “quick fix.” The fix then alleviates the problem, resulting in a balancing dynamic that addresses the problem in the short-term. However, a side effect emerges that diverts attention away from more fundamental solutions. Side effects are often related to addictions or dependencies. The system can become more and more dependent on the symptomatic solution and less and less able to achieve a desired state.
Ways out: Breaking this cycle usually requires an acknowledgement that the fix was shortsighted. Efforts should focus on the fundamental solutions and minimize the effects of side effects. Beware of symptom–relieving practices that don’t really address the problem or delay attention to sustainable solutions.
As a tool for prevention: The shifting the burden archetype is a valuable tool to use when deciding on solutions to problems. Whether a solution is symptomatic or fundamental often depends on one’s perspective. Explore possible solutions from various perspectives. An informed decision that considers the potential for addictive or dependent side effects is preferable.
Questions to ask Are actions taken to address the problem making it difficult to implement more fundamental, sustainable solutions?
What side effects result from solutions that may increase dependency and erode the capacity to implement a fundamental solution?
Symptomatic Solution
Fundamental Solution
Side Effect
Problem Symptom
B
B
R
27
©2016 Waters Foundation, Systems Thinking in Education watersfoundation.org
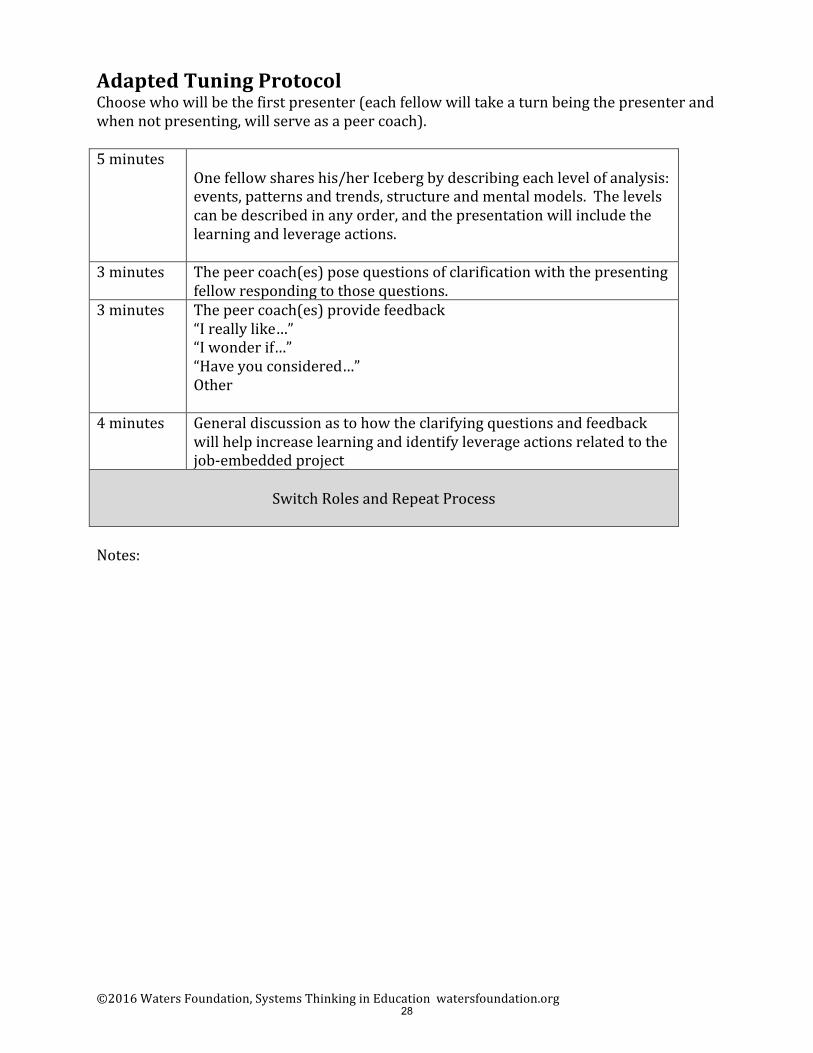
Adapted Tuning Protocol Choose who will be the first presenter (each fellow will take a turn being the presenter and when not presenting, will serve as a peer coach).
5 minutes One fellow shares his/her Iceberg by describing each level of analysis: events, patterns and trends, structure and mental models. The levels can be described in any order, and the presentation will include the learning and leverage actions.
3 minutes The peer coach(es) pose questions of clarification with the presenting fellow responding to those questions.
3 minutes The peer coach(es) provide feedback “I really like…” “I wonder if…” “Have you considered…” Other
4 minutes General discussion as to how the clarifying questions and feedback will help increase learning and identify leverage actions related to the job-‐embedded project
Switch Roles and Repeat Process
Notes:
28
©2016 Waters Foundation Systems Thinking in Education watersfoundation.org
You know you’re a
SYSTEMS THINKER if you pay
attention to…
Habits of a Systems Thinker
29