Embed Size (px)
Citation preview
© 2014 HORIBA, Ltd. All rights reserved.
Introduction to Surface Area Analysis
Jeffrey Bodycomb, Ph.D.Miro Pejcinovic, Amy Hou
HORIBA Scientificwww.horiba.com/us/particle
© 2014 HORIBA, Ltd. All rights reserved.
Outline
Why determine surface area?
Surface area and size
Determining surface area
© 2014 HORIBA, Ltd. All rights reserved.
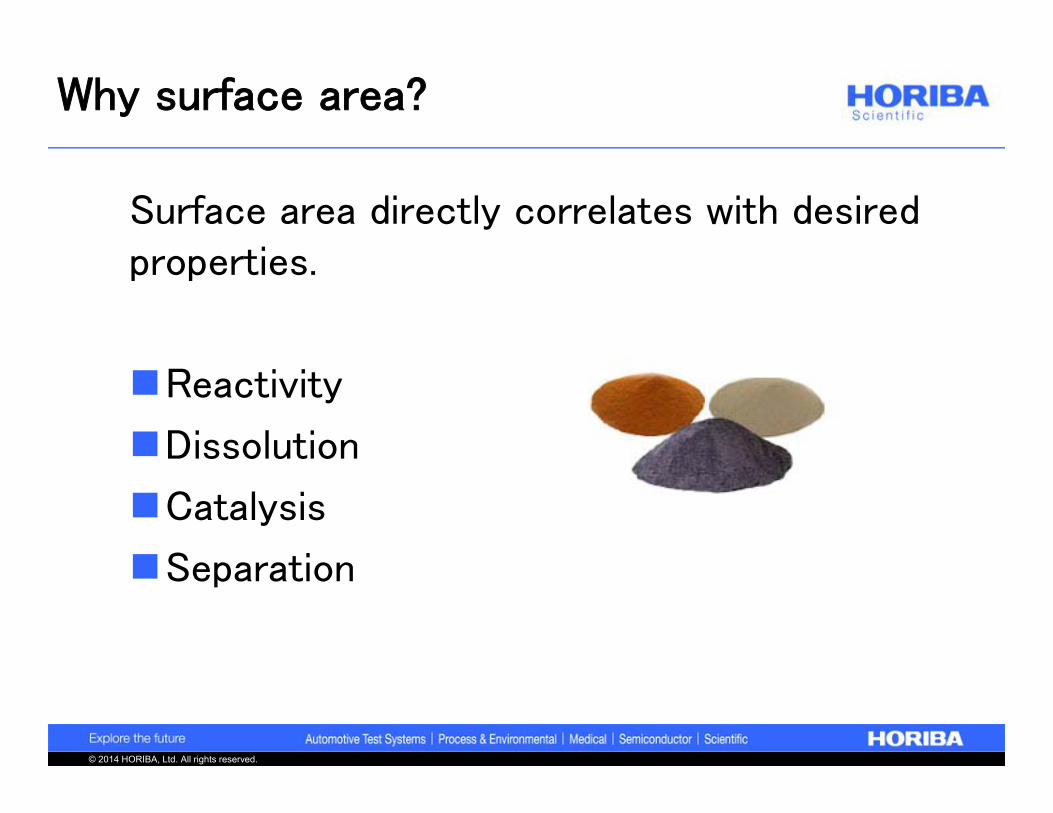
Why surface area?
Surface area directly correlates with desired properties.
Reactivity
Dissolution
Catalysis
Separation
© 2014 HORIBA, Ltd. All rights reserved.
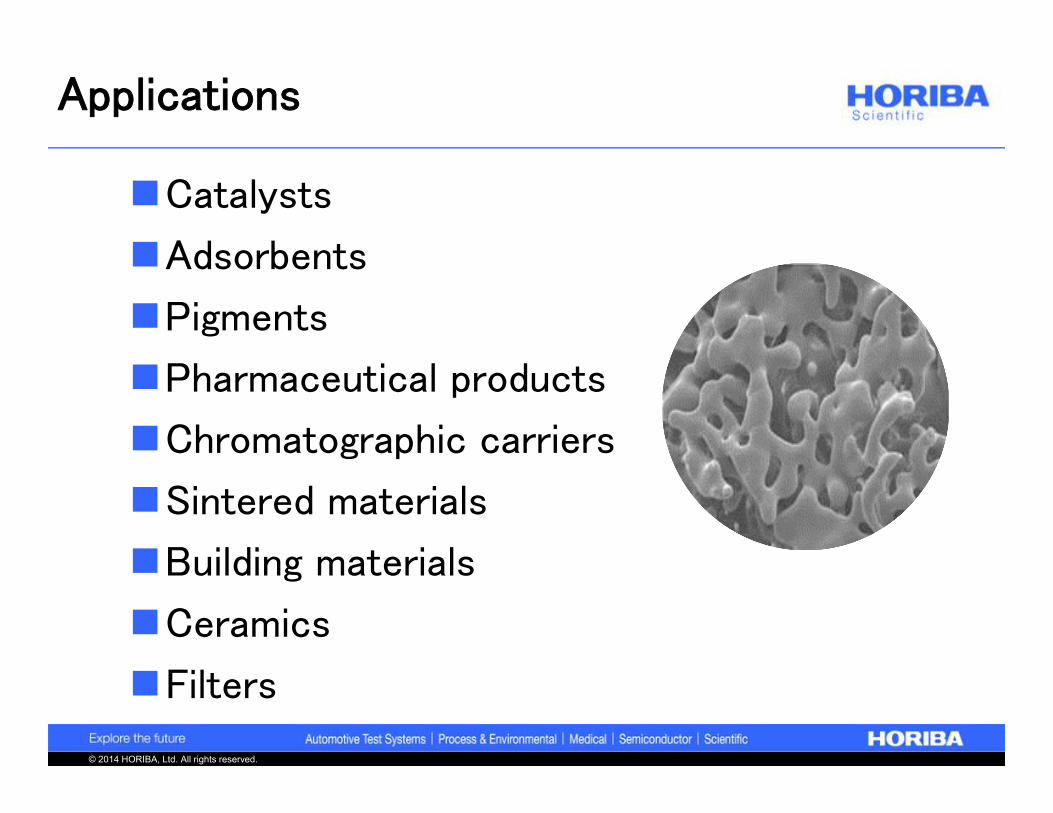
Applications
Catalysts
Adsorbents
Pigments
Pharmaceutical products
Chromatographic carriers
Sintered materials
Building materials
Ceramics
Filters
© 2014 HORIBA, Ltd. All rights reserved.
Chemical reactions
When a solid is involved in a chemical reaction, either as a reagent or a catalyst, the surface area is the only accessible area for the reaction.
Dramatic example: dust explosions!

© 2014 HORIBA, Ltd. All rights reserved.
Dissolution
Dissolution of materials (e.g., API’s) depends on surface area.
Noyes-Whitney Equation
bs CCdDA
dtdm
m = mass dissolved materialt = timeA = Surface area of interfaceD = Diffusion coefficientd = Boundary layer thicknessCs = Concentration of substance on surfaceCb = Concentration of substance in solvent
© 2014 HORIBA, Ltd. All rights reserved.
Outline
Why determine surface area?
Surface area and size
Determining surface area
© 2014 HORIBA, Ltd. All rights reserved.
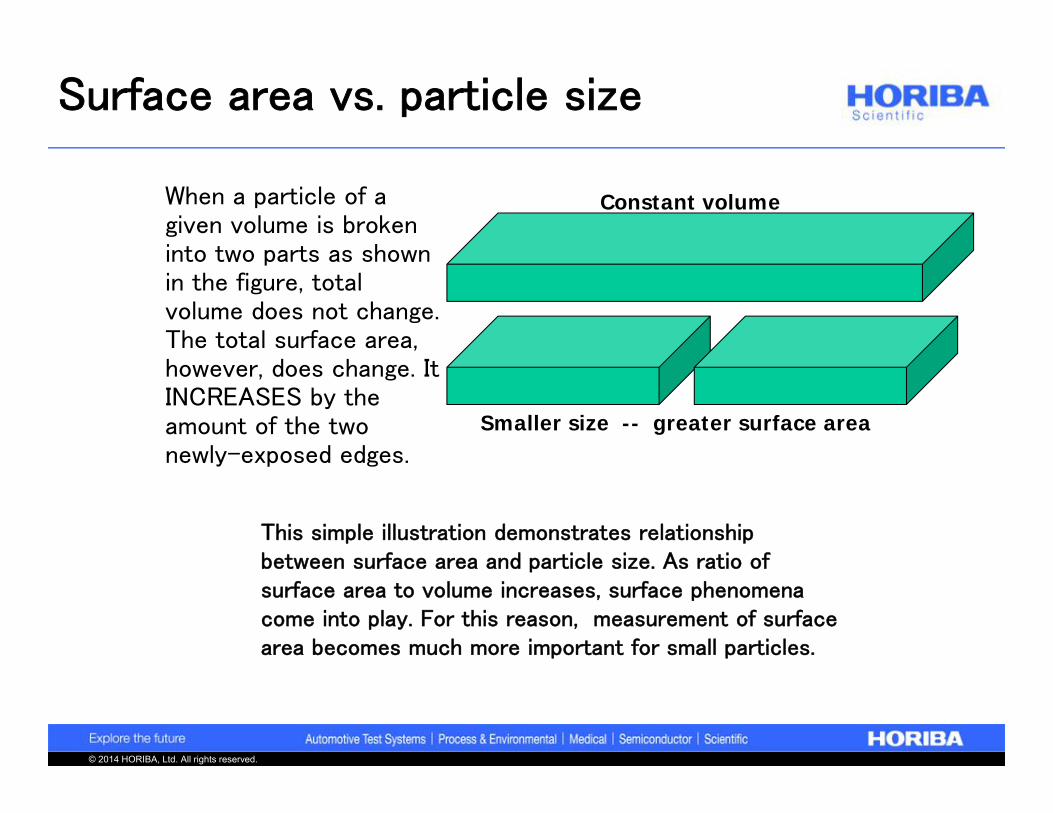
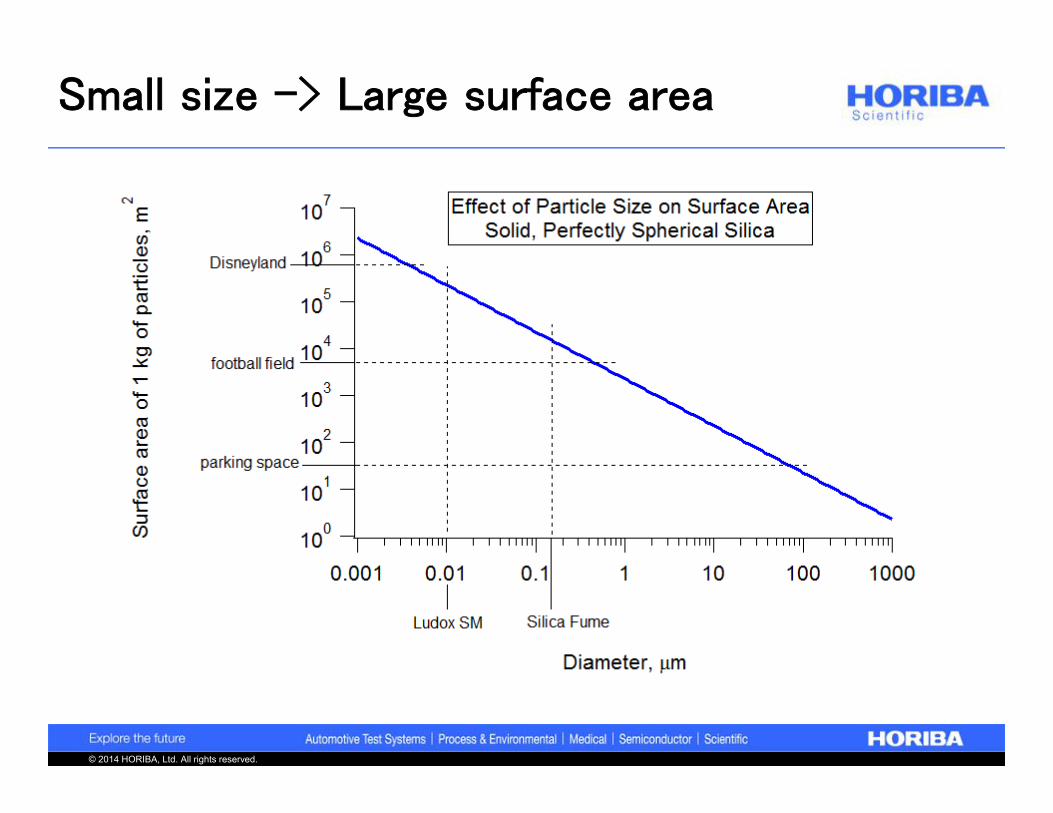
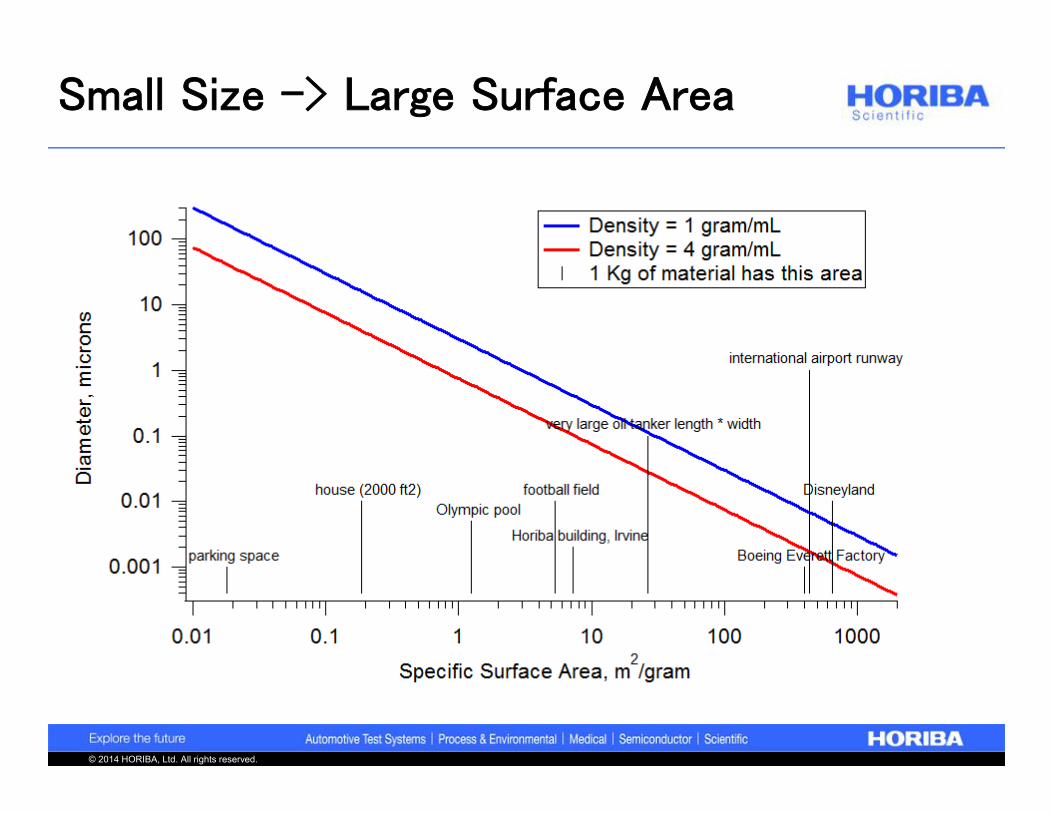
When a particle of a given volume is broken into two parts as shown in the figure, total volume does not change. The total surface area, however, does change. It INCREASES by the amount of the two newly-exposed edges.
This simple illustration demonstrates relationship between surface area and particle size. As ratio of surface area to volume increases, surface phenomena come into play. For this reason, measurement of surface area becomes much more important for small particles.
Constant volume
Smaller size -- greater surface area
Surface area vs. particle size
© 2014 HORIBA, Ltd. All rights reserved.
Small size -> Large surface area
© 2014 HORIBA, Ltd. All rights reserved.
Small Size -> Large Surface Area
© 2014 HORIBA, Ltd. All rights reserved.
10 20 30 40 50Particle size in microns
15%
25%
30%
20%
10%
Vol
ume
% in
bin
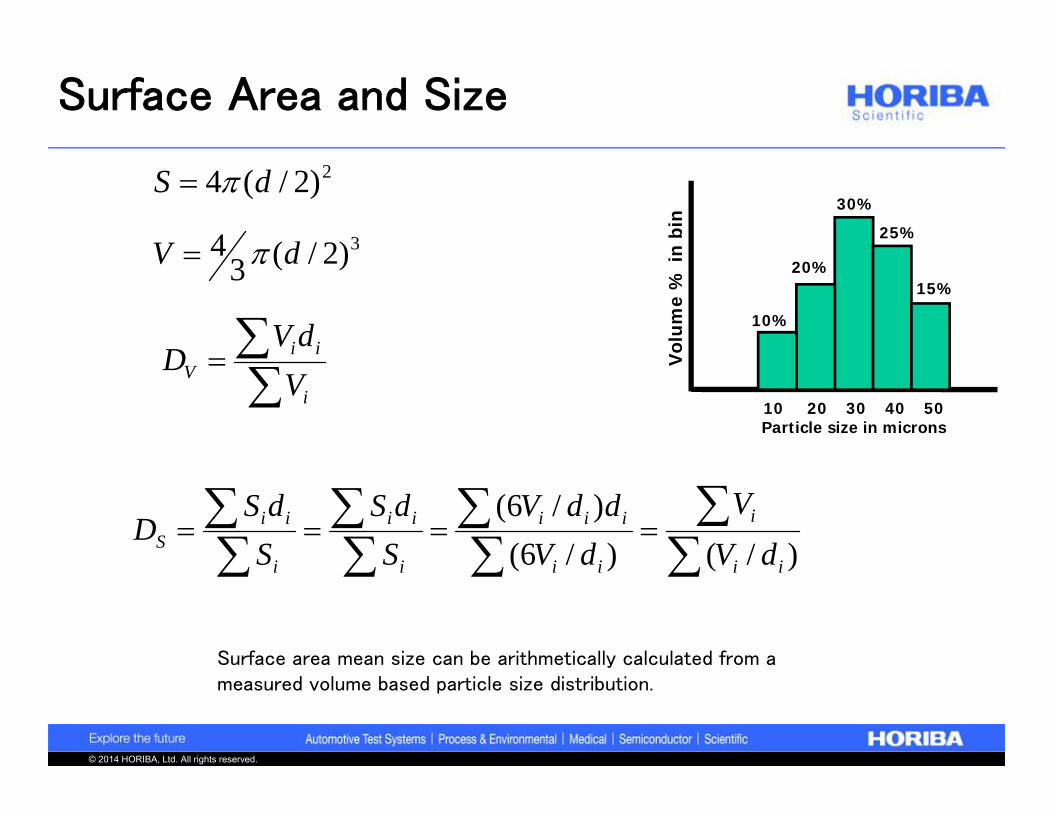
Surface area mean size can be arithmetically calculated from a measured volume based particle size distribution.
Surface Area and Size
i
iiV V
dVD
)/()/6()/6(
ii
i
ii
iii
i
ii
i
iiS dV
VdV
ddVSdS
SdS
D
2)2/(4 dS
3)2/(34 dV
© 2014 HORIBA, Ltd. All rights reserved.
SOLID PARTICLE
PARTICLEWITH SOME IRREGULARITY
PARTICLEWITH DEEP INTERSTICES
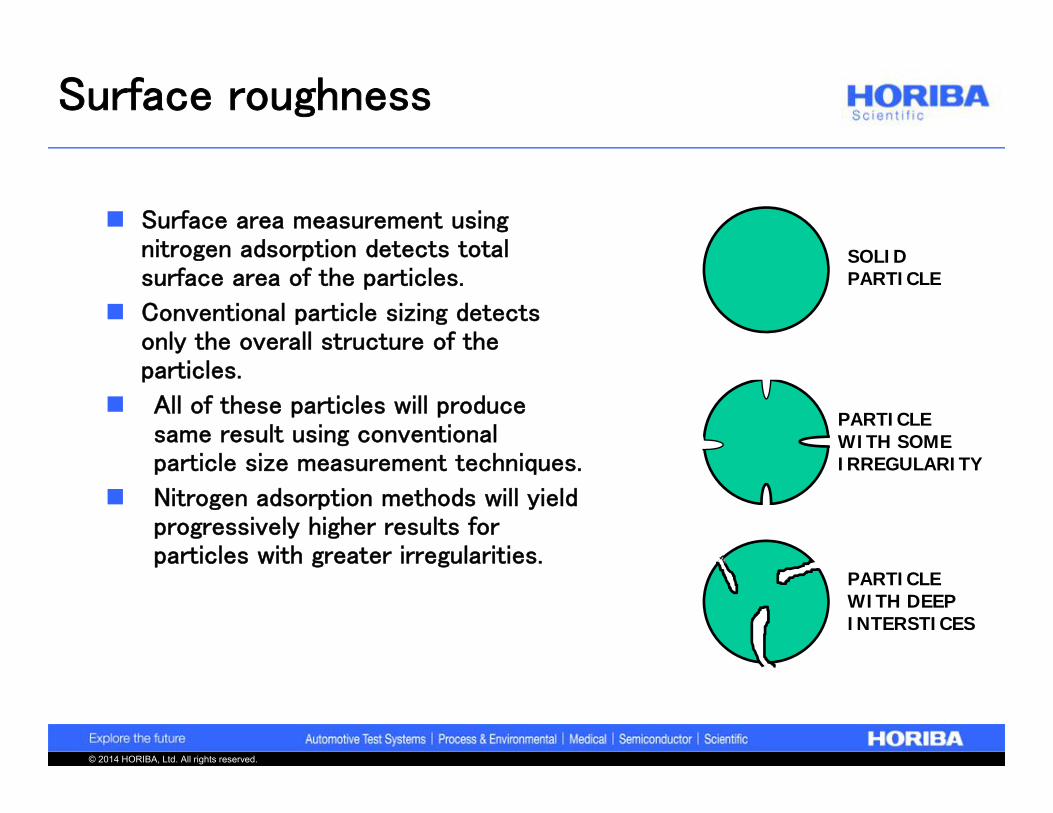
Surface area measurement using nitrogen adsorption detects total surface area of the particles.
Conventional particle sizing detects only the overall structure of the particles.
All of these particles will produce same result using conventional particle size measurement techniques.
Nitrogen adsorption methods will yield progressively higher results for particles with greater irregularities.
Surface roughness
© 2014 HORIBA, Ltd. All rights reserved.
Surface area and shape
We can use a size analyzer, but eventually prefer to measure surface area directly.
Specific surface area for a given size changes according to shape
Another way to think about determining particle shape or surface roughness
© 2014 HORIBA, Ltd. All rights reserved.
Outline
Why determine surface area?
Surface area and size
Determining surface area
© 2014 HORIBA, Ltd. All rights reserved.
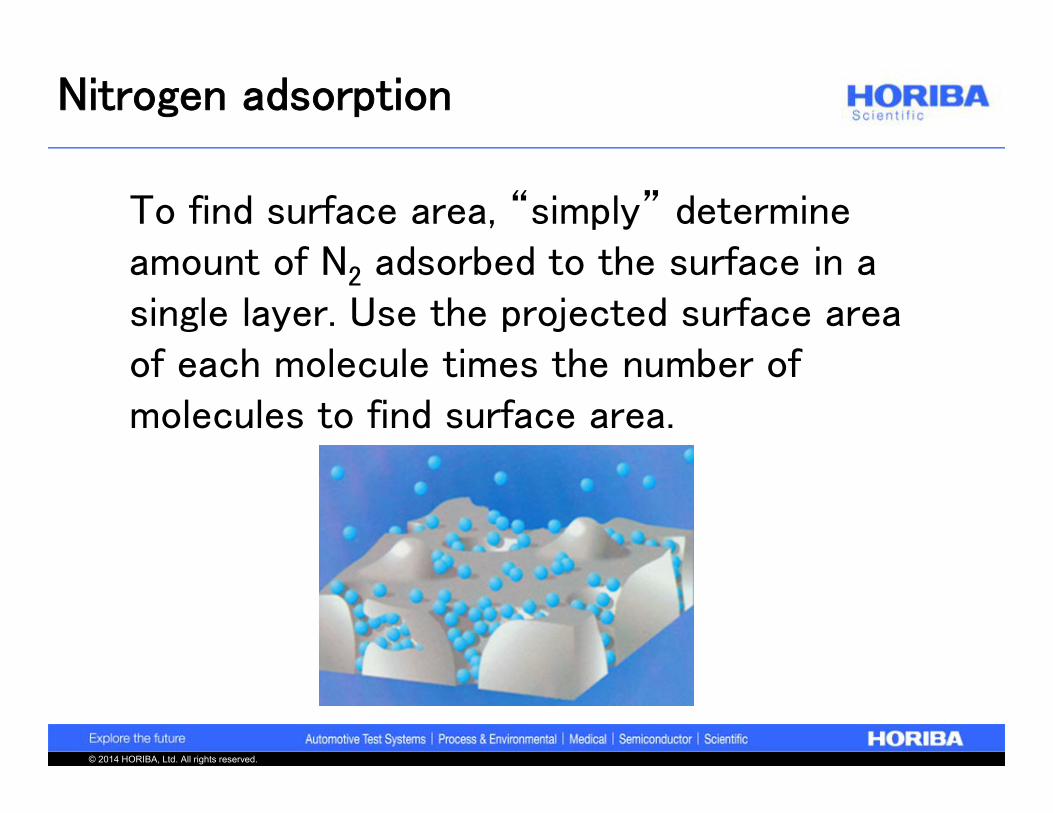
Nitrogen adsorption
To find surface area, “simply” determine amount of N2 adsorbed to the surface in a single layer. Use the projected surface area of each molecule times the number of molecules to find surface area.
© 2014 HORIBA, Ltd. All rights reserved.
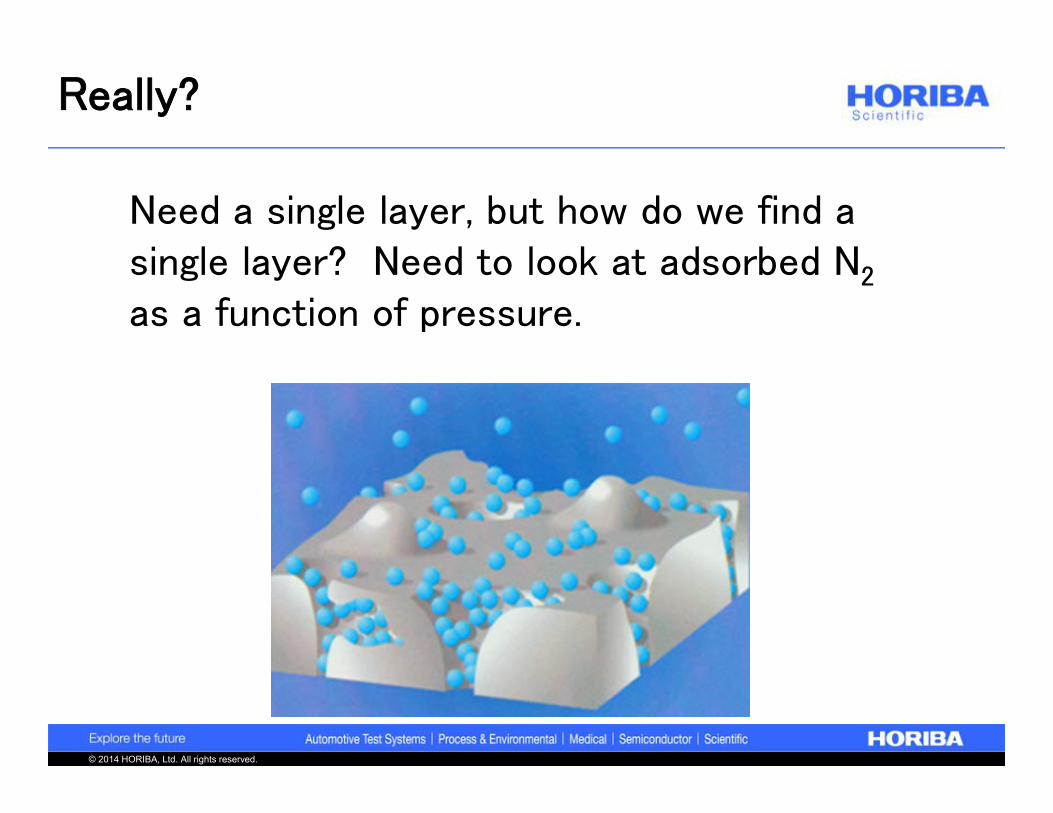
Really?
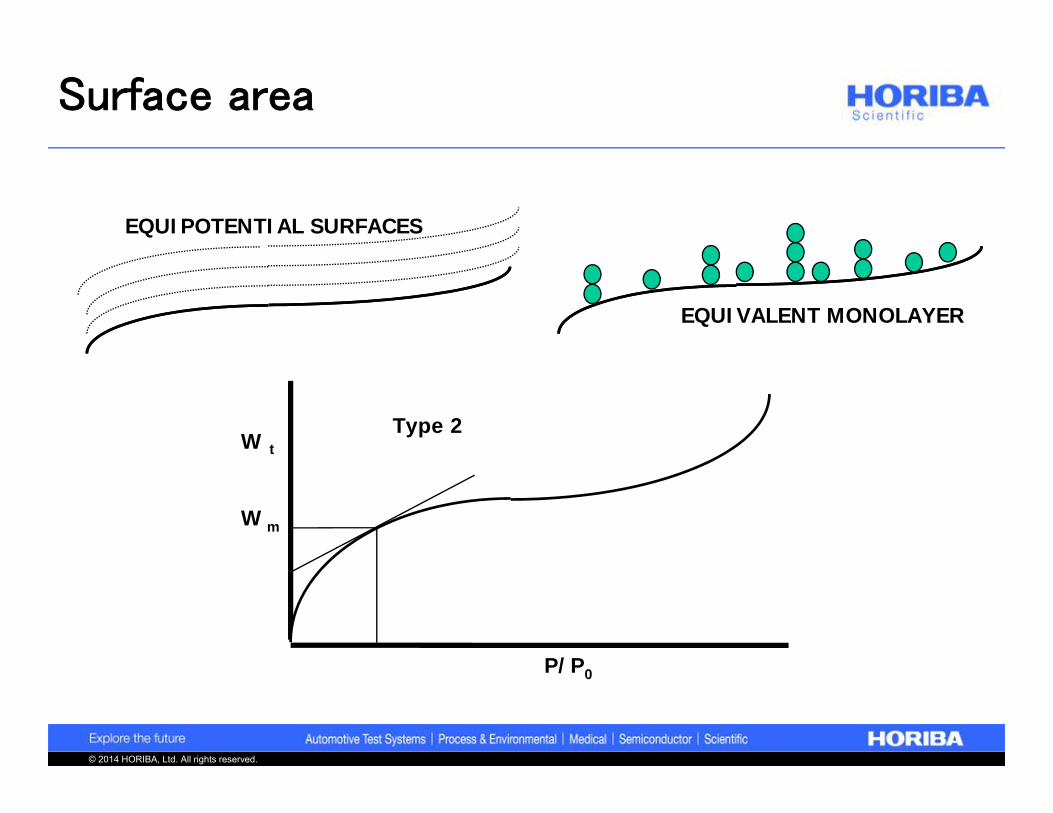
Need a single layer, but how do we find a single layer? Need to look at adsorbed N2
as a function of pressure.
© 2014 HORIBA, Ltd. All rights reserved.
EQUIPOTENTIAL SURFACES
EQUIVALENT MONOLAYER
Type 2W t
W m
P/P0
Surface area
© 2014 HORIBA, Ltd. All rights reserved.
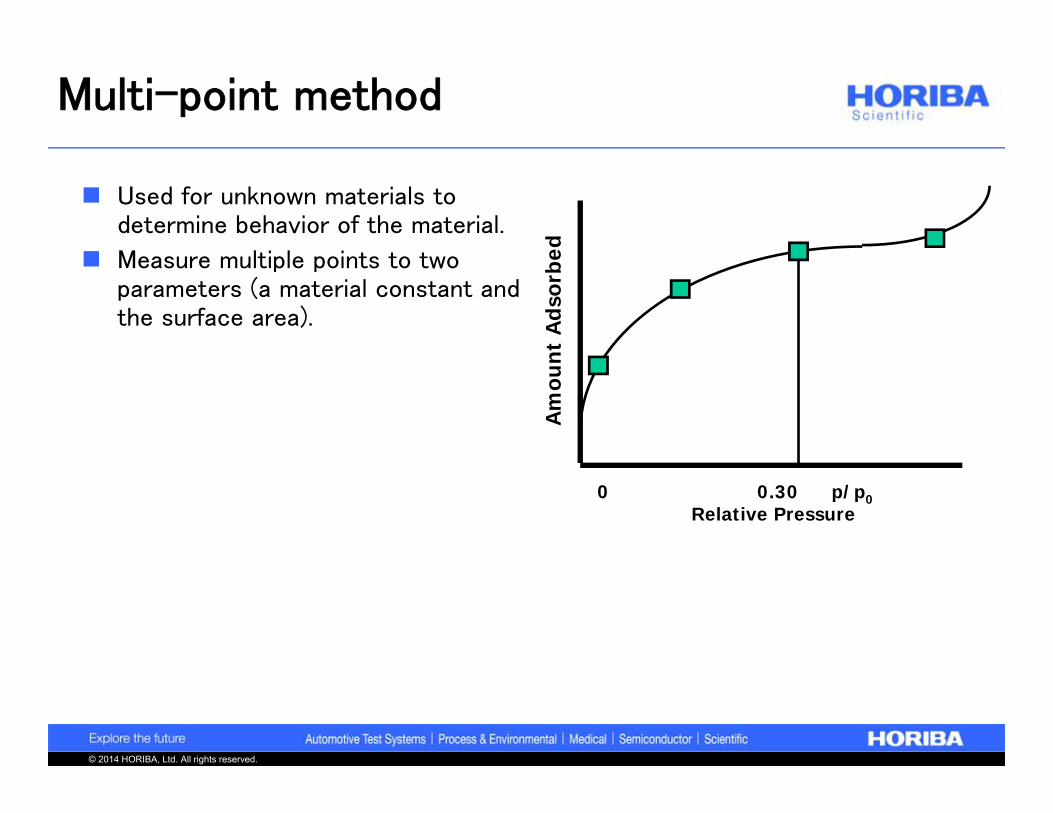
Used for unknown materials to determine behavior of the material.
Measure multiple points to two parameters (a material constant and the surface area).
Am
ount
Ads
orbe
d
0 0.30 p/p0Relative Pressure
Multi-point method
© 2014 HORIBA, Ltd. All rights reserved.
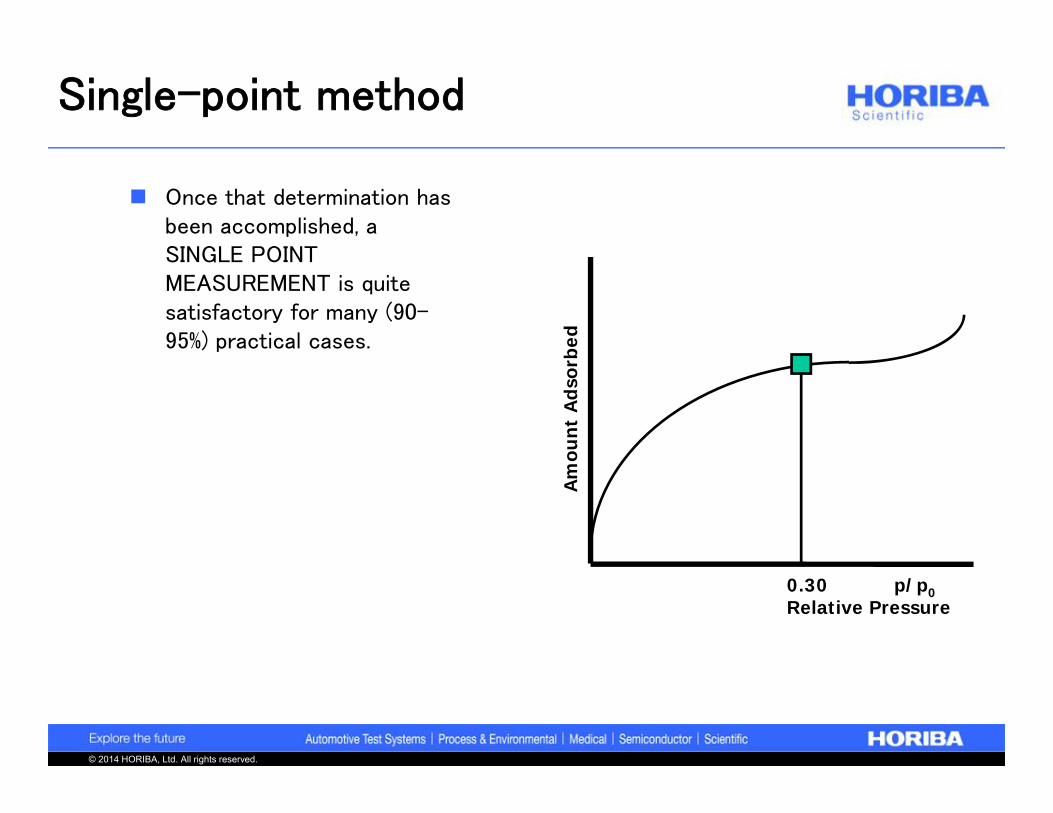
Once that determination has been accomplished, a SINGLE POINT MEASUREMENT is quite satisfactory for many (90-95%) practical cases.
Am
ount
Ads
orbe
d 0.30 p/p0Relative Pressure
Single-point method
© 2014 HORIBA, Ltd. All rights reserved.
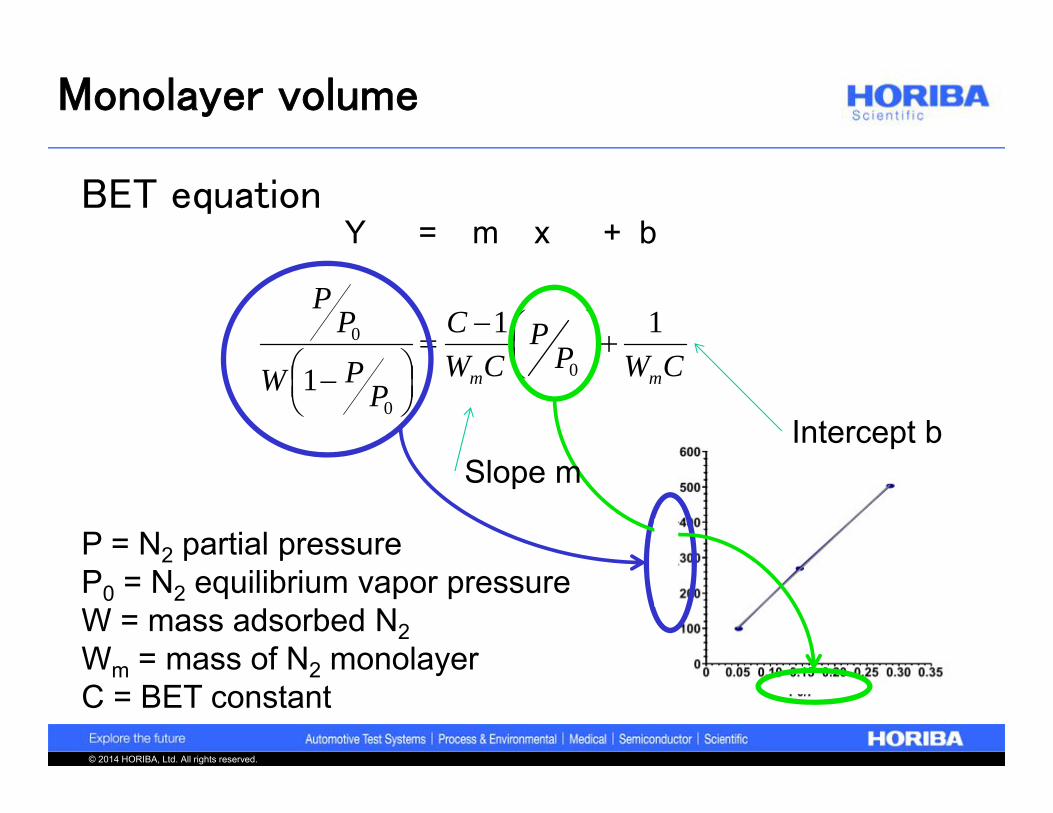
Monolayer volume
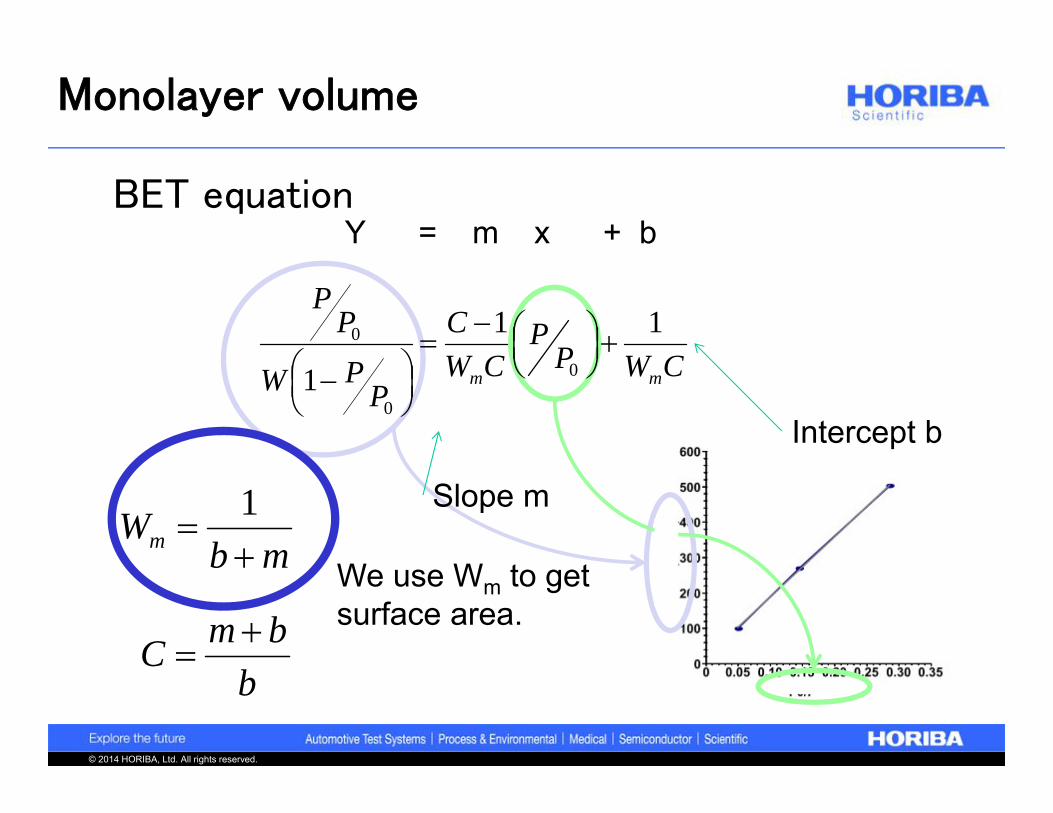
BET equation
CWPP
CWC
PPW
PP
mm
11
1 0
0
0
P = N2 partial pressureP0 = N2 equilibrium vapor pressureW = mass adsorbed N2Wm = mass of N2 monolayerC = BET constant
Slope mIntercept b
Y = m x + b
© 2014 HORIBA, Ltd. All rights reserved.
Monolayer volume
BET equation
Slope m
Intercept b
Y = m x + b
mbWm
1
bbmC
We use Wm to get surface area.
CWPP
CWC
PPW
PP
mm
11
1 0
0
0
© 2014 HORIBA, Ltd. All rights reserved.
Monolayer volume
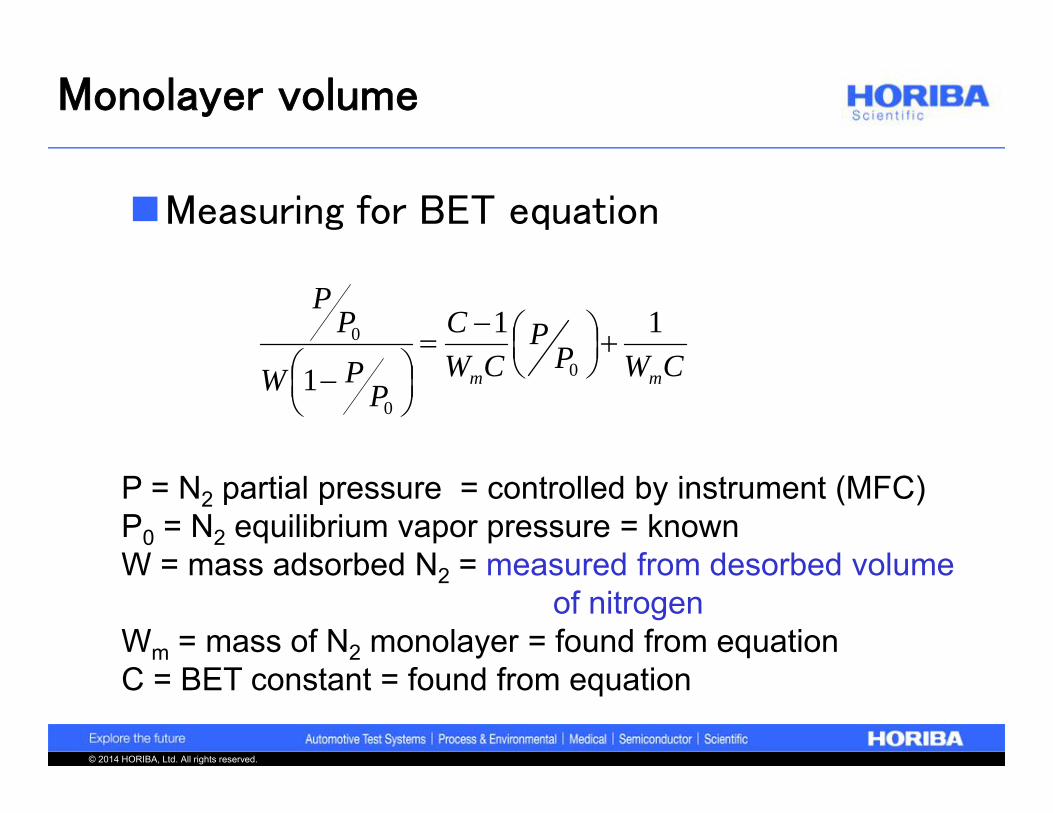
Measuring for BET equation
P = N2 partial pressure = controlled by instrument (MFC)P0 = N2 equilibrium vapor pressure = knownW = mass adsorbed N2 = measured from desorbed volume
of nitrogenWm = mass of N2 monolayer = found from equationC = BET constant = found from equation
CWPP
CWC
PPW
PP
mm
11
1 0
0
0
© 2014 HORIBA, Ltd. All rights reserved.
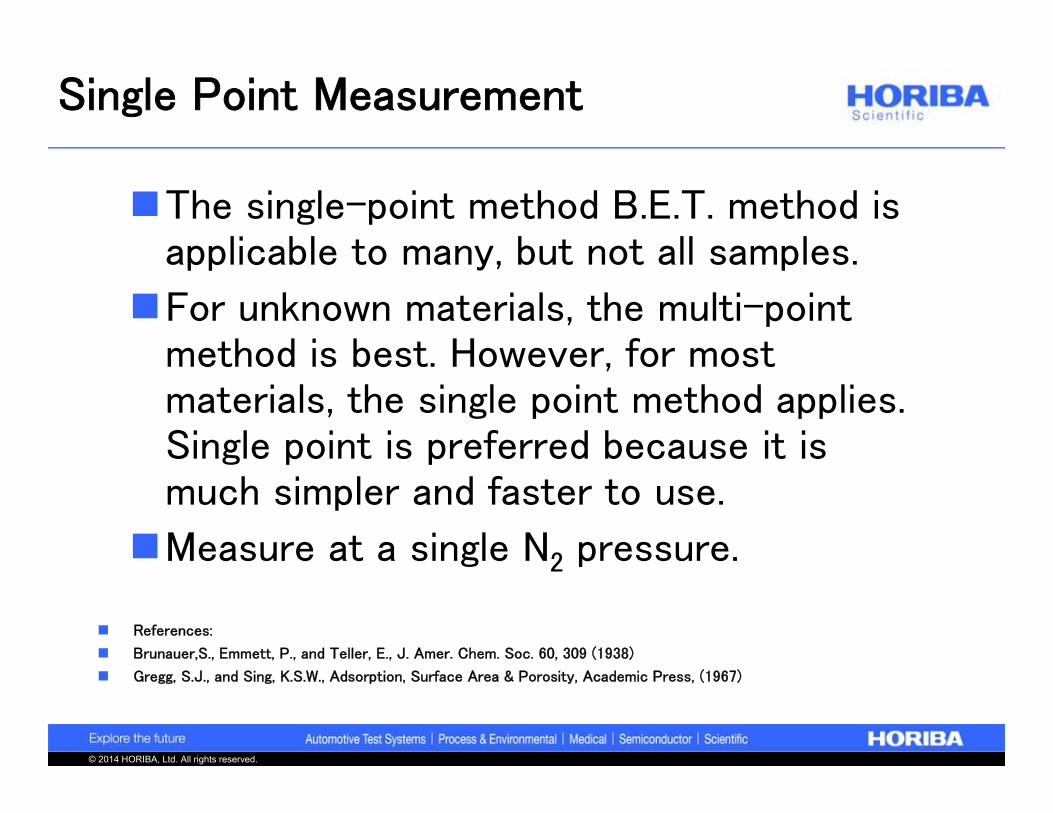
The single-point method B.E.T. method is applicable to many, but not all samples.
For unknown materials, the multi-point method is best. However, for most materials, the single point method applies. Single point is preferred because it is much simpler and faster to use.
Measure at a single N2 pressure.
References:
Brunauer,S., Emmett, P., and Teller, E., J. Amer. Chem. Soc. 60, 309 (1938)
Gregg, S.J., and Sing, K.S.W., Adsorption, Surface Area & Porosity, Academic Press, (1967)
Single Point Measurement
© 2014 HORIBA, Ltd. All rights reserved.
Monolayer mass, Single Point
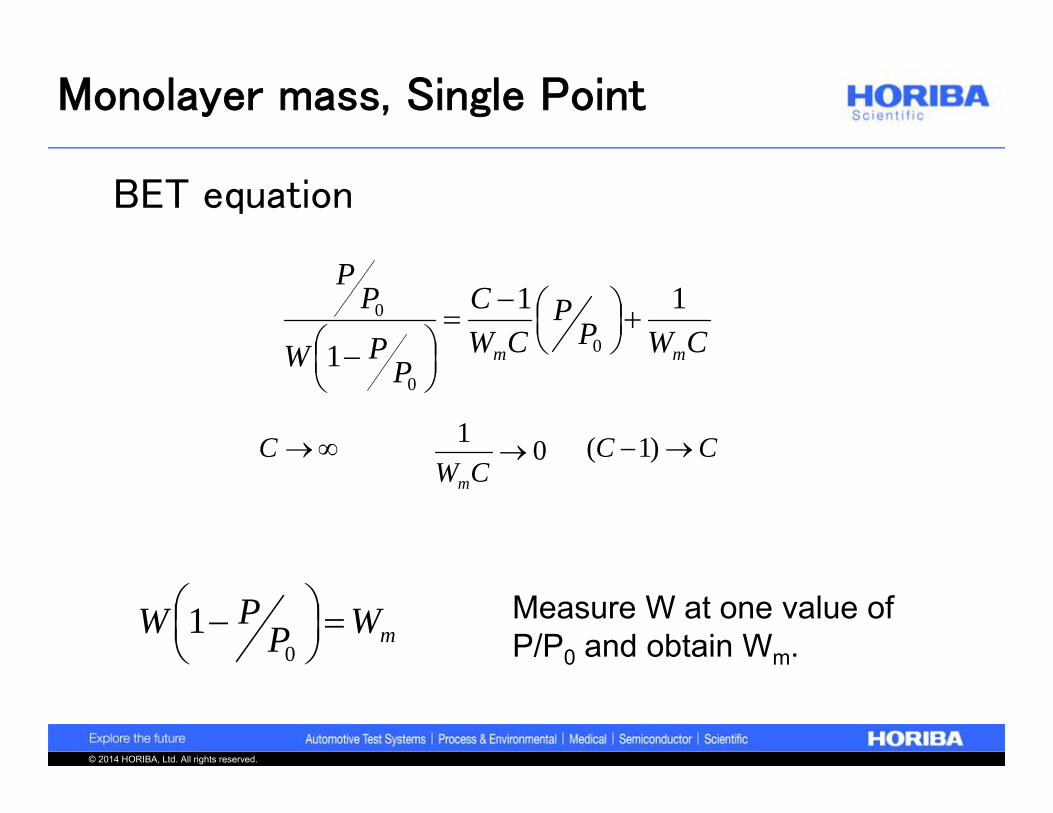
BET equation
C
CWPP
CWC
PPW
PP
mm
11
1 0
0
0
01
CWm
CC )1(
mWPPW
01 Measure W at one value of
P/P0 and obtain Wm.
© 2014 HORIBA, Ltd. All rights reserved.
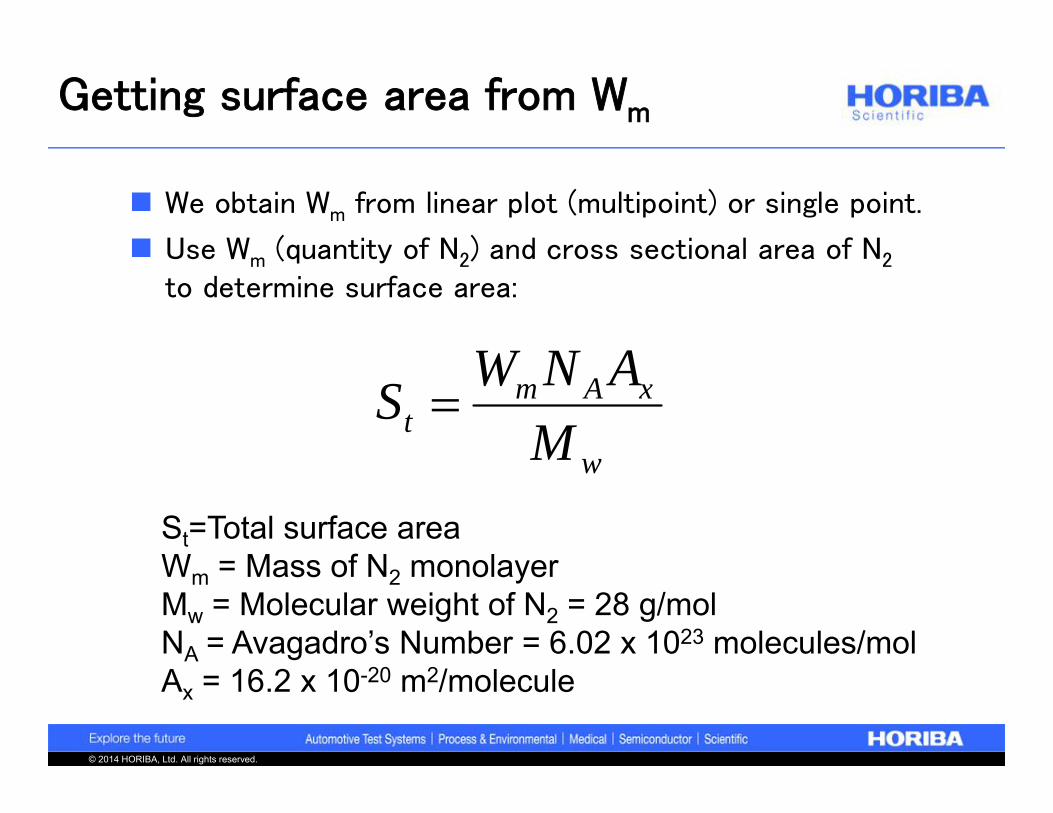
Getting surface area from Wm
We obtain Wm from linear plot (multipoint) or single point.
Use Wm (quantity of N2) and cross sectional area of N2
to determine surface area:
w
xAmt M
ANWS
St=Total surface areaWm = Mass of N2 monolayerMw = Molecular weight of N2 = 28 g/molNA = Avagadro’s Number = 6.02 x 10²³ molecules/molAx = 16.2 x 10⁻²⁰ m2/molecule
© 2014 HORIBA, Ltd. All rights reserved.
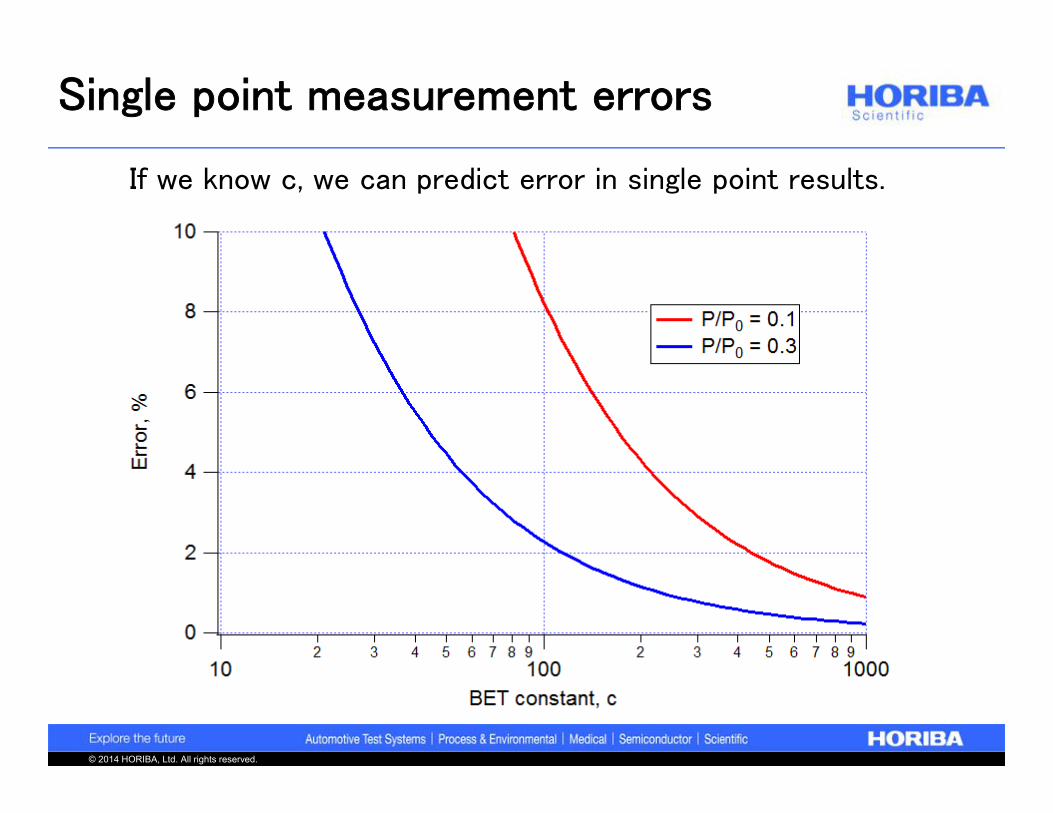
Single point measurement errors
If we know c, we can predict error in single point results.
© 2014 HORIBA, Ltd. All rights reserved.
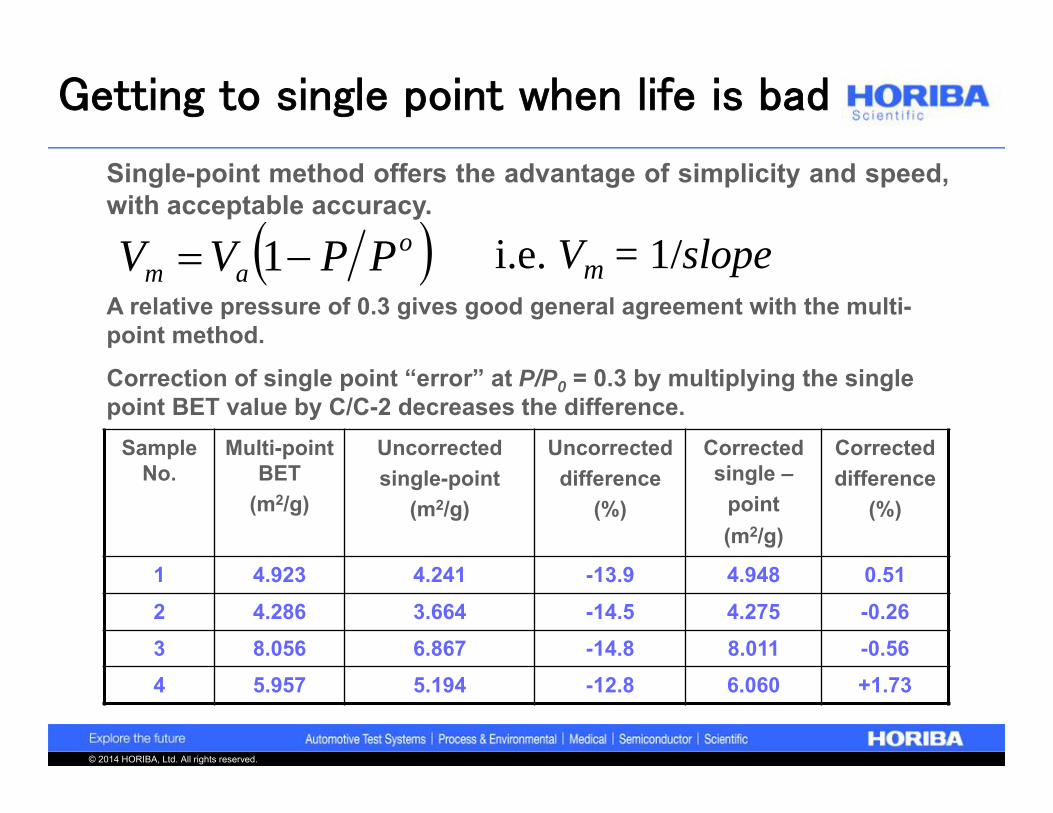
Single-point method offers the advantage of simplicity and speed,with acceptable accuracy.
oam PPVV 1 i.e. Vm = 1/slope
A relative pressure of 0.3 gives good general agreement with the multi-point method.
Correction of single point “error” at P/P0 = 0.3 by multiplying the single point BET value by C/C-2 decreases the difference.
Sample No.
Multi-point BET
(m2/g)
Uncorrected single-point
(m2/g)
Uncorrecteddifference
(%)
Corrected single –
point(m2/g)
Correcteddifference
(%)
1 4.923 4.241 -13.9 4.948 0.512 4.286 3.664 -14.5 4.275 -0.263 8.056 6.867 -14.8 8.011 -0.564 5.957 5.194 -12.8 6.060 +1.73
Getting to single point when life is bad
© 2014 HORIBA, Ltd. All rights reserved.
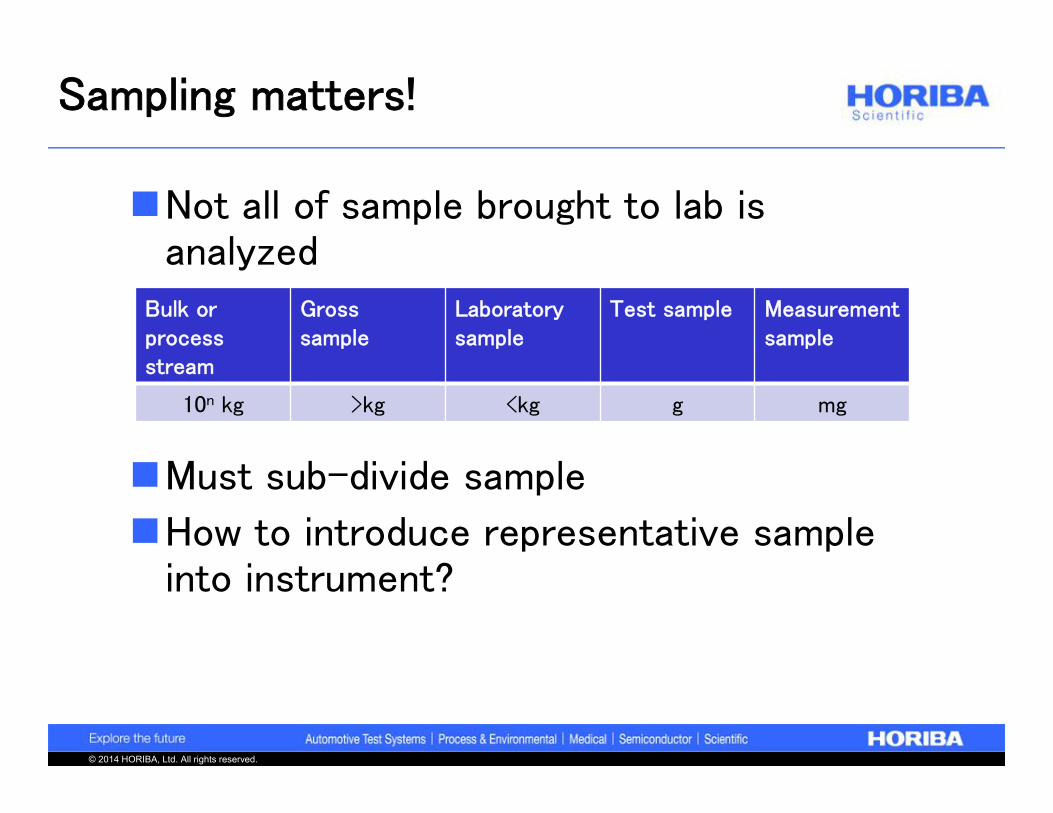
Sampling matters!
Not all of sample brought to lab is analyzed
Must sub-divide sample
How to introduce representative sample into instrument?
Bulk or process stream
Grosssample
Laboratory sample
Test sample Measurementsample
10n kg >kg <kg g mg
© 2014 HORIBA, Ltd. All rights reserved.
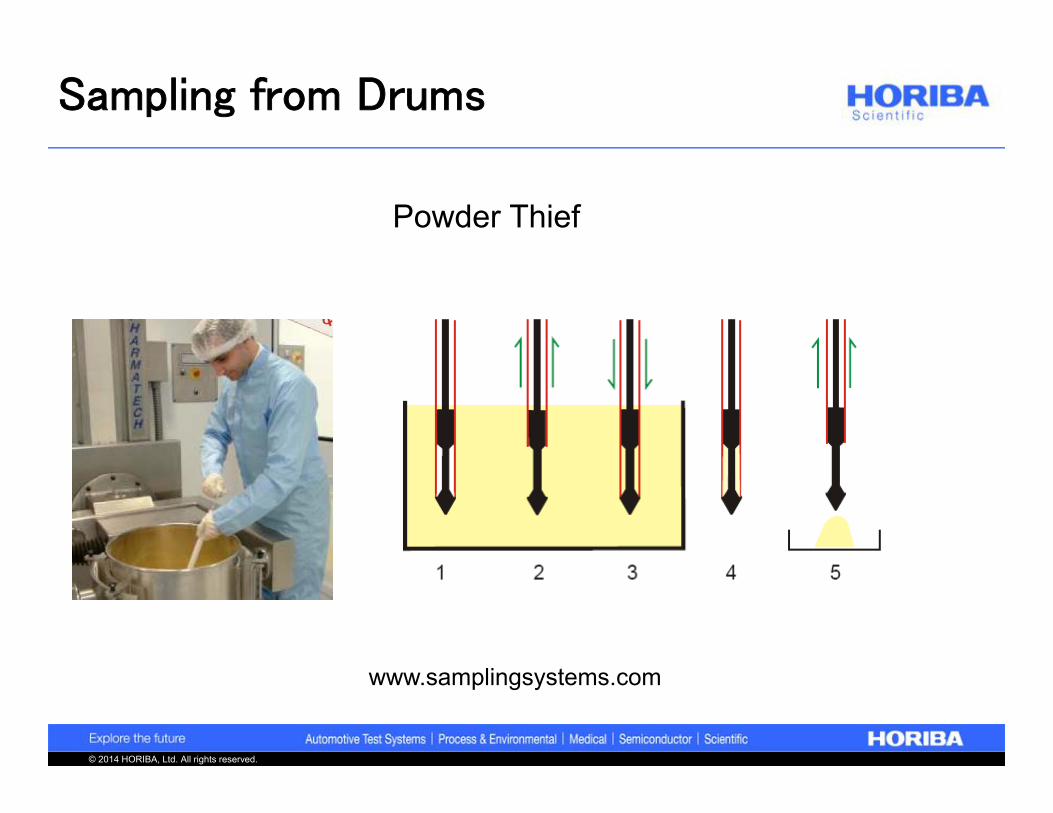
Powder Thief
www.samplingsystems.com
Sampling from Drums
© 2014 HORIBA, Ltd. All rights reserved.
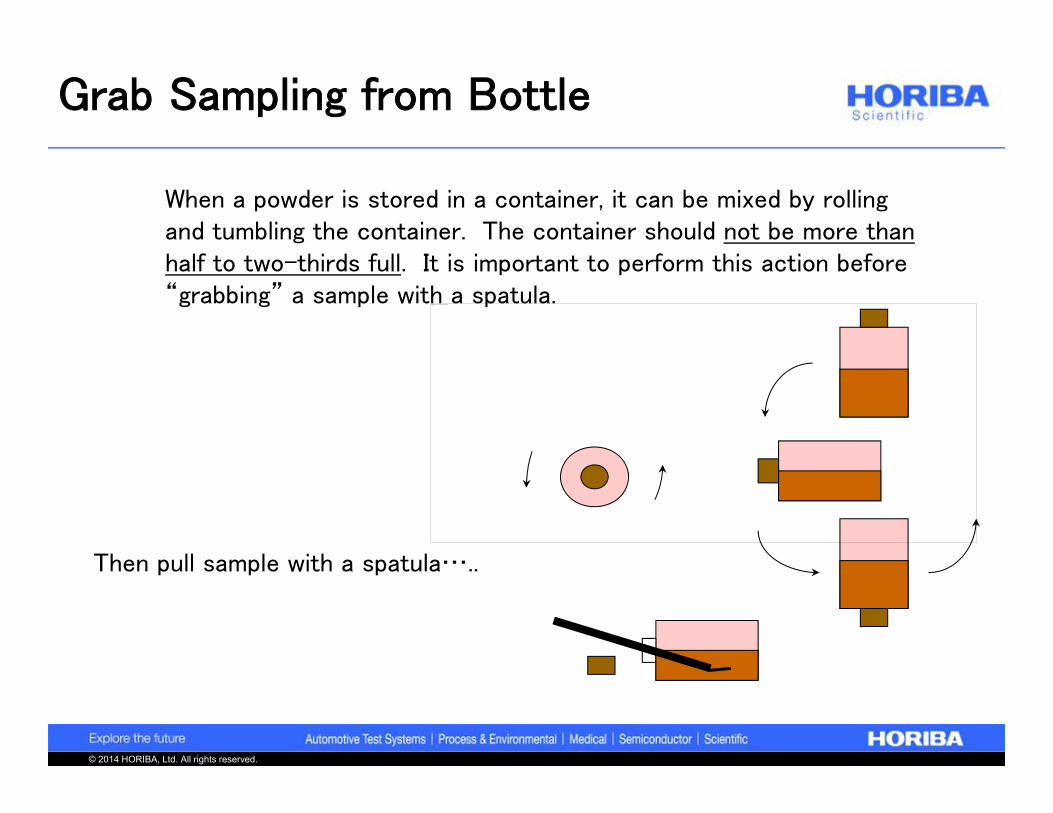
Grab Sampling from Bottle
When a powder is stored in a container, it can be mixed by rolling and tumbling the container. The container should not be more than half to two-thirds full. It is important to perform this action before “grabbing” a sample with a spatula.
Then pull sample with a spatula…..
This image cannot currently be displayed.
© 2014 HORIBA, Ltd. All rights reserved.
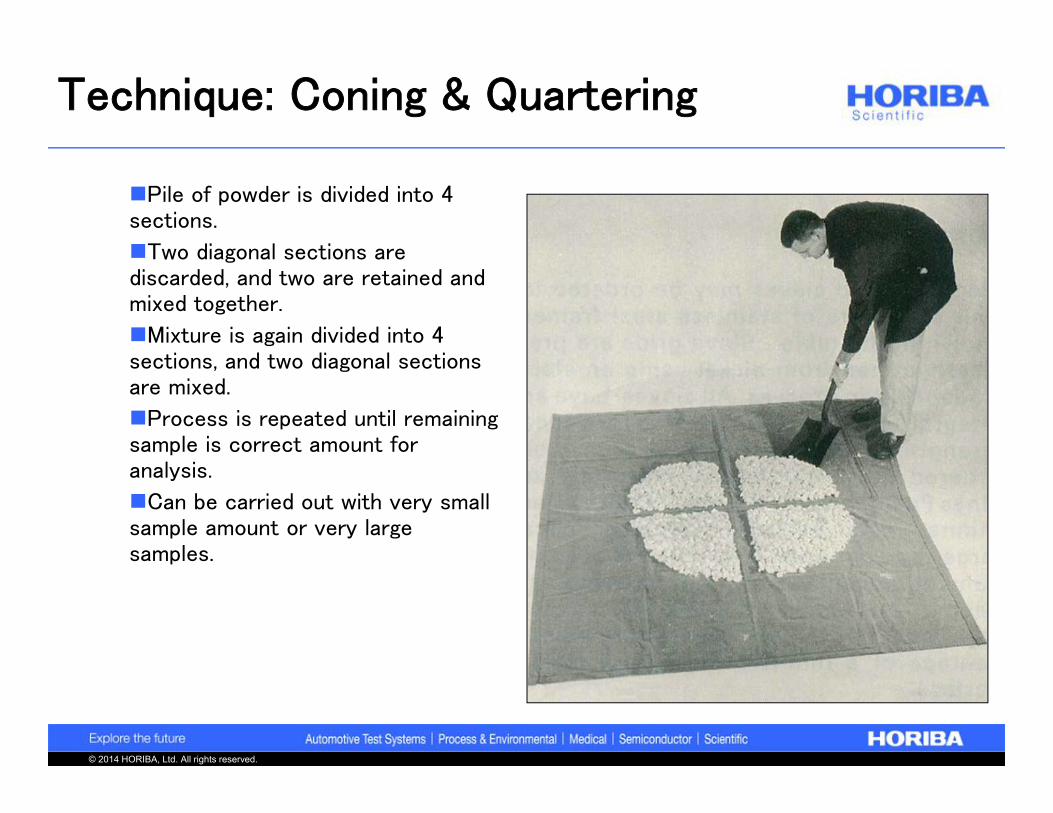
Technique: Coning & Quartering
Pile of powder is divided into 4 sections.
Two diagonal sections are discarded, and two are retained and mixed together.
Mixture is again divided into 4 sections, and two diagonal sections are mixed.
Process is repeated until remaining sample is correct amount for analysis.
Can be carried out with very small sample amount or very large samples.
© 2014 HORIBA, Ltd. All rights reserved.
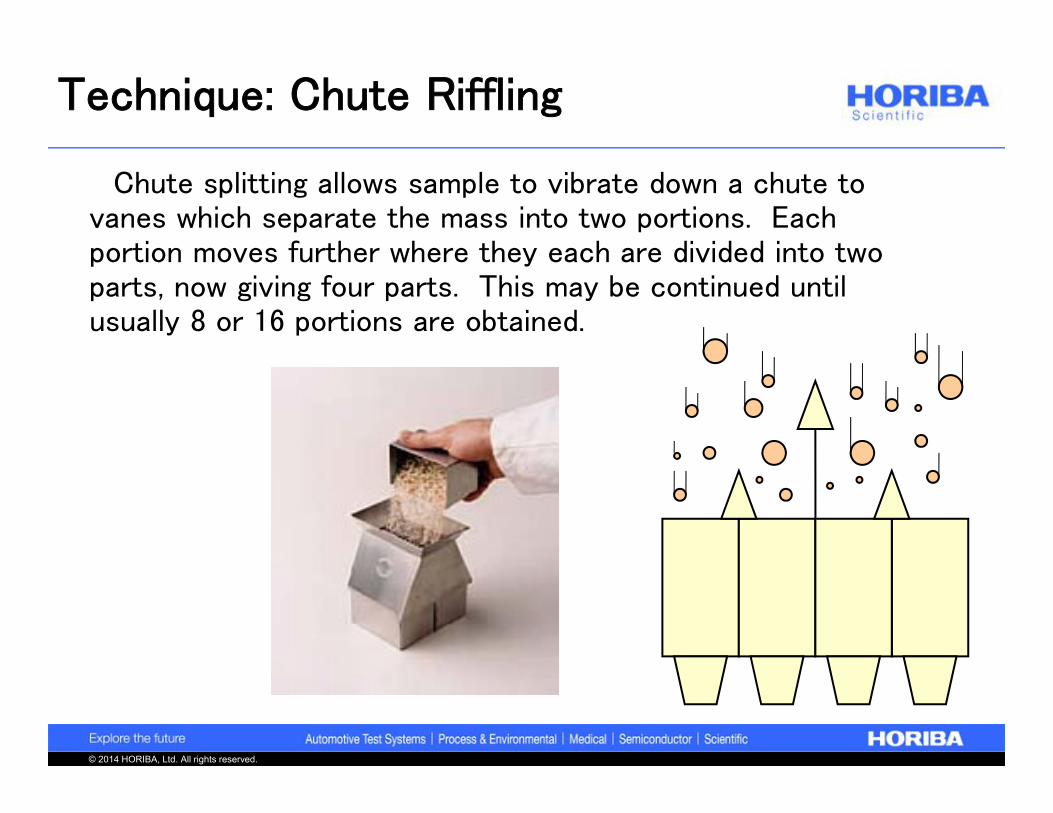
Technique: Chute Riffling
Chute splitting allows sample to vibrate down a chute to vanes which separate the mass into two portions. Each portion moves further where they each are divided into two parts, now giving four parts. This may be continued until usually 8 or 16 portions are obtained.
© 2014 HORIBA, Ltd. All rights reserved.
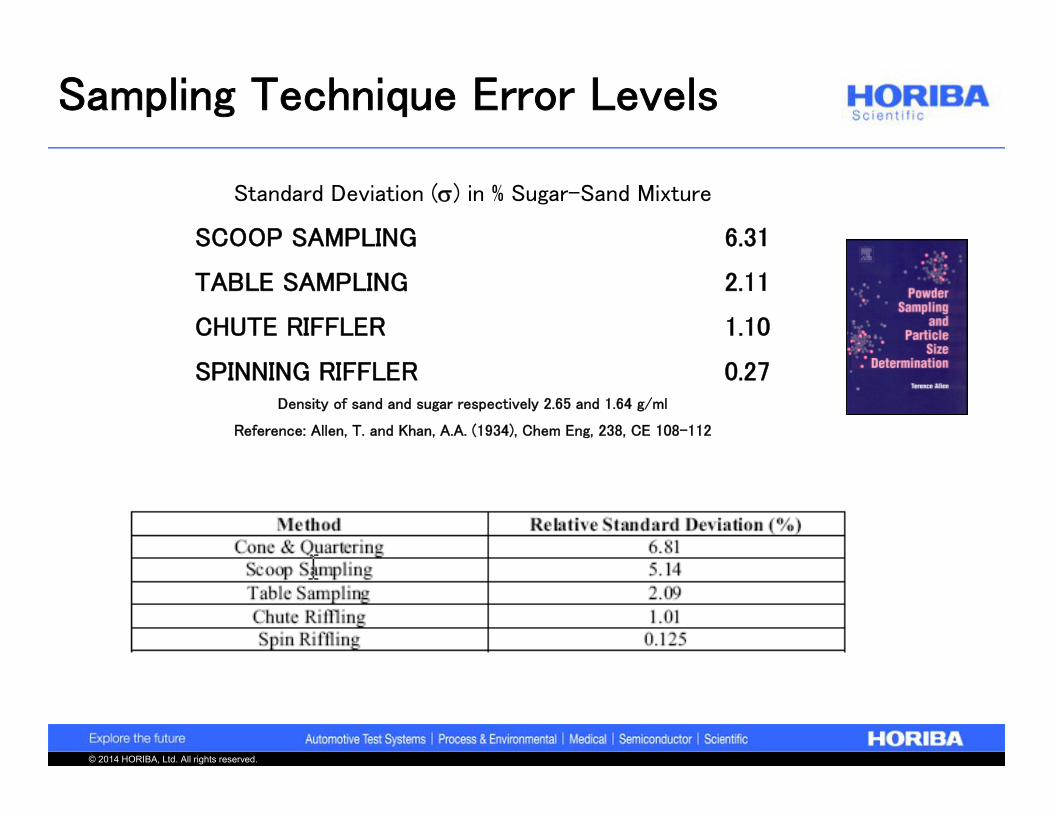
Sampling Technique Error Levels
Standard Deviation () in % Sugar-Sand Mixture
SCOOP SAMPLING 6.31
TABLE SAMPLING 2.11
CHUTE RIFFLER 1.10
SPINNING RIFFLER 0.27 Density of sand and sugar respectively 2.65 and 1.64 g/ml
Reference: Allen, T. and Khan, A.A. (1934), Chem Eng, 238, CE 108-112
© 2014 HORIBA, Ltd. All rights reserved.
Weighing out sample
Frequent source of error.
Use a balance with four places.
Carefully determine and record mass of empty sample cell. You will need this value after measurement.
© 2014 HORIBA, Ltd. All rights reserved.
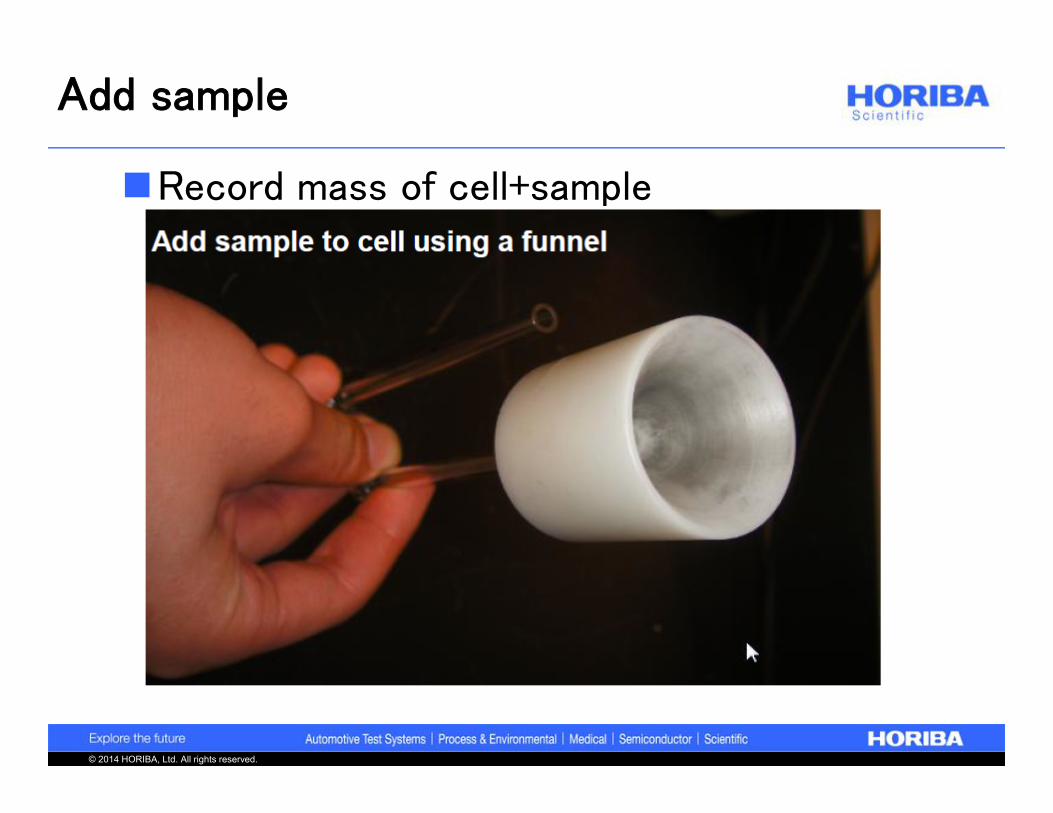
Add sample
Record mass of cell+sample
© 2014 HORIBA, Ltd. All rights reserved.
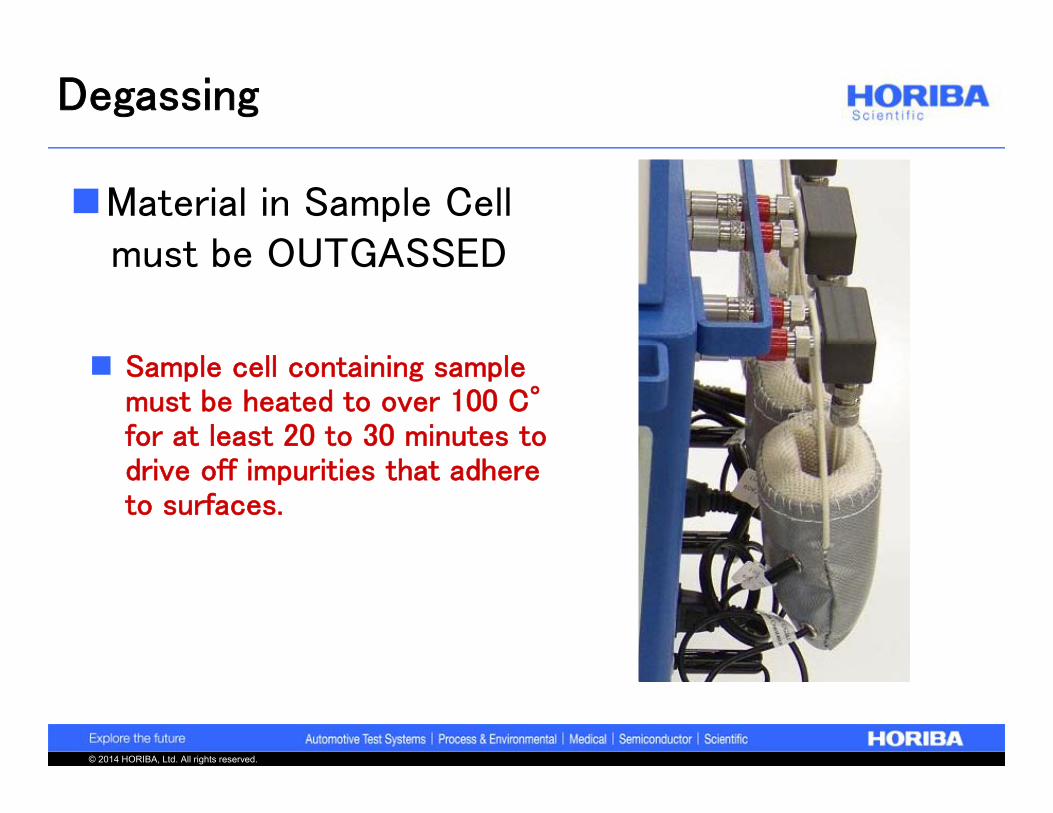
Material in Sample Cell must be OUTGASSED
Sample cell containing sample must be heated to over 100 C°for at least 20 to 30 minutes to drive off impurities that adhere to surfaces.
Degassing
© 2014 HORIBA, Ltd. All rights reserved.
Degassing
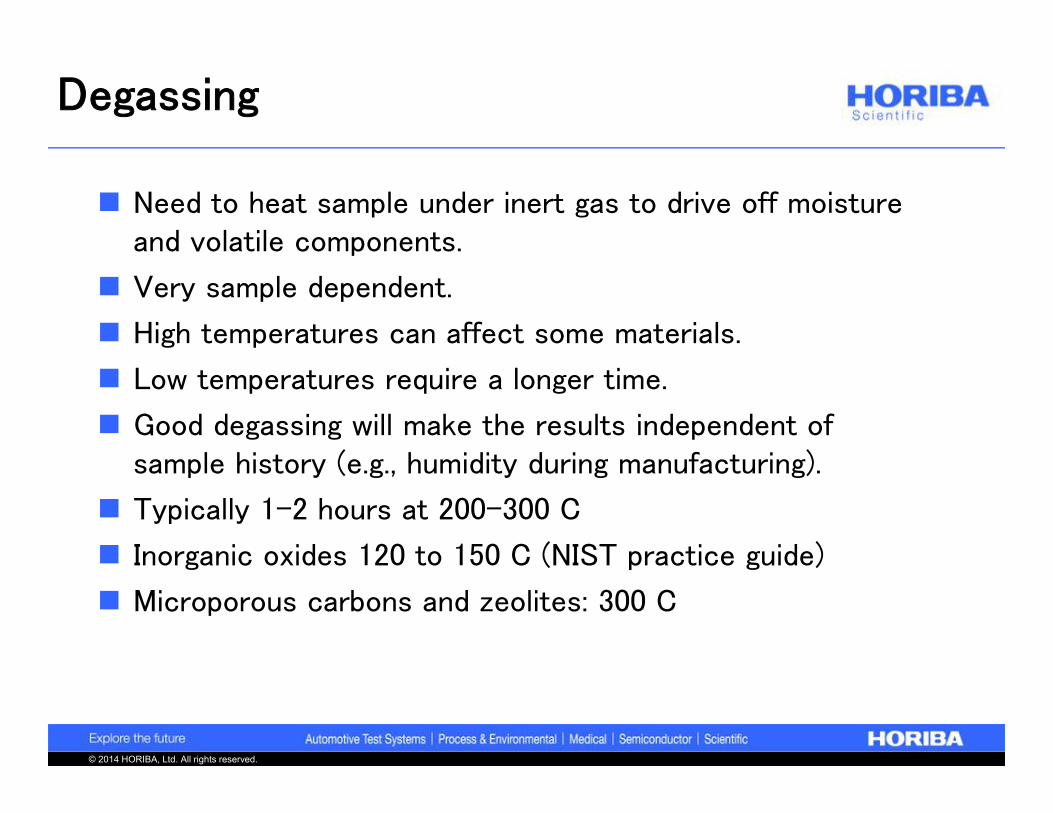
Need to heat sample under inert gas to drive off moisture and volatile components.
Very sample dependent.
High temperatures can affect some materials.
Low temperatures require a longer time.
Good degassing will make the results independent of sample history (e.g., humidity during manufacturing).
Typically 1-2 hours at 200-300 C
Inorganic oxides 120 to 150 C (NIST practice guide)
Microporous carbons and zeolites: 300 C
© 2014 HORIBA, Ltd. All rights reserved.
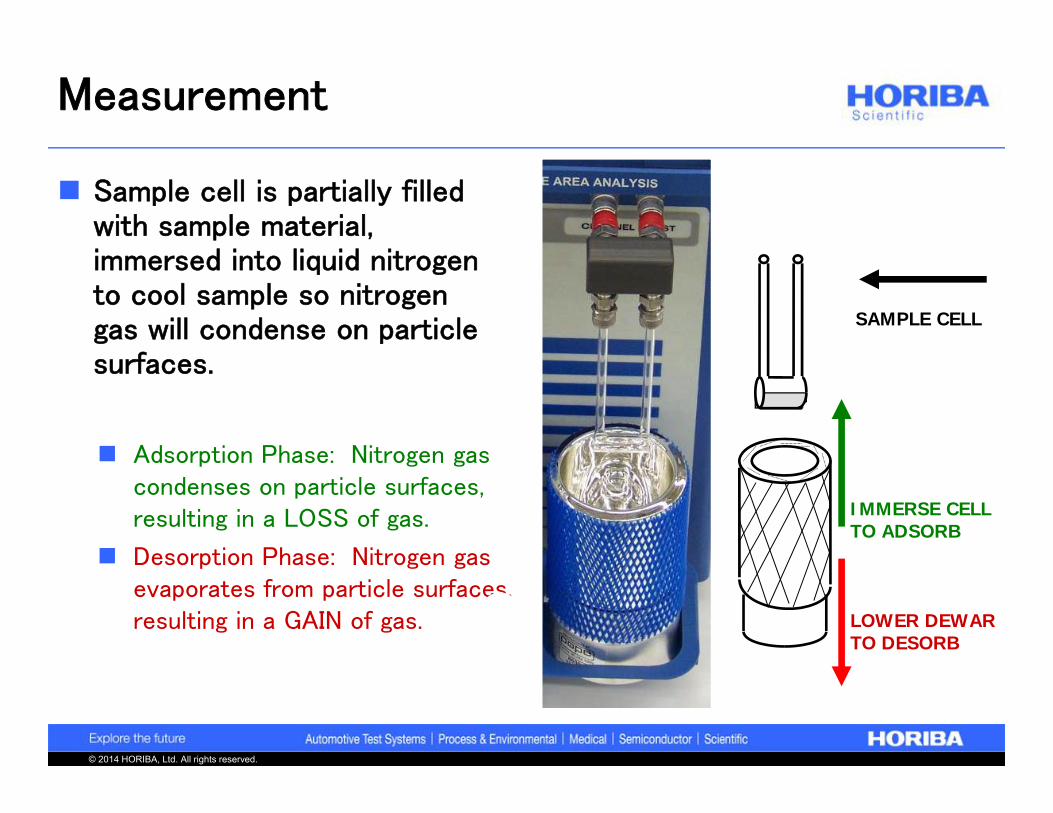
Sample cell is partially filled with sample material, immersed into liquid nitrogen to cool sample so nitrogen gas will condense on particle surfaces.
Adsorption Phase: Nitrogen gas condenses on particle surfaces, resulting in a LOSS of gas.
Desorption Phase: Nitrogen gas evaporates from particle surfaces, resulting in a GAIN of gas.
SAMPLE CELL
IMMERSE CELLTO ADSORB
LOWER DEWARTO DESORB
Measurement
© 2014 HORIBA, Ltd. All rights reserved.
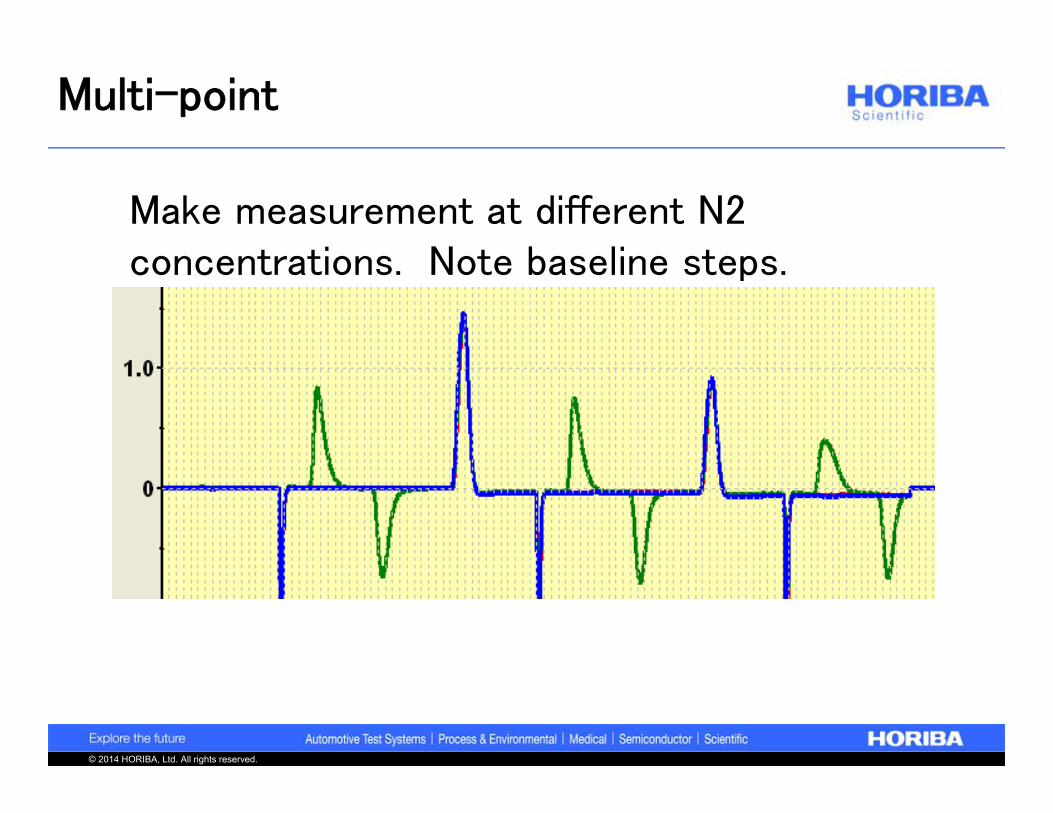
W, mass adsorbed
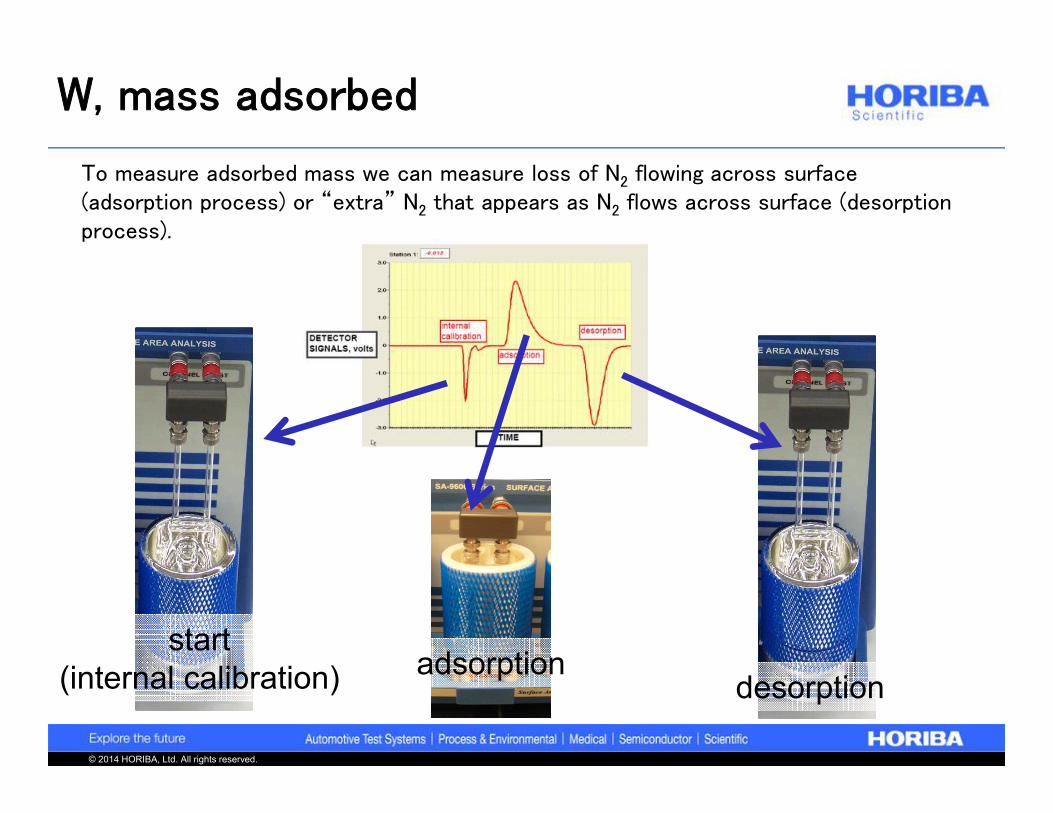
To measure adsorbed mass we can measure loss of N2 flowing across surface (adsorption process) or “extra” N2 that appears as N2 flows across surface (desorption process).
adsorptiondesorption
start(internal calibration)
© 2014 HORIBA, Ltd. All rights reserved.
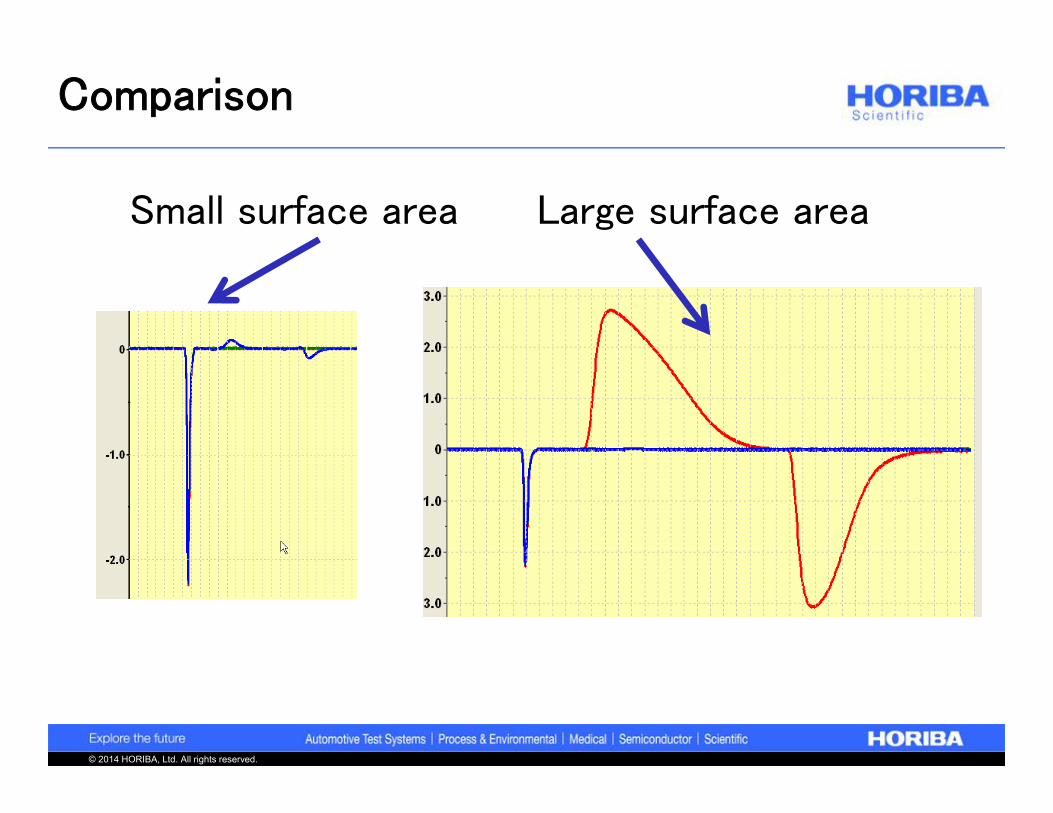
Comparison
Small surface area Large surface area
© 2014 HORIBA, Ltd. All rights reserved.
Multi-point
Make measurement at different N2 concentrations. Note baseline steps.

© 2014 HORIBA, Ltd. All rights reserved.
End of measurement
Weigh after degassing (very important)
Did you keep your tare value?
Mass determination is a major source of uncertainty. For 0.1 gram of sample an weighing error of 0.001 gram (1 milligram) will give a 1% error in results.
© 2014 HORIBA, Ltd. All rights reserved.
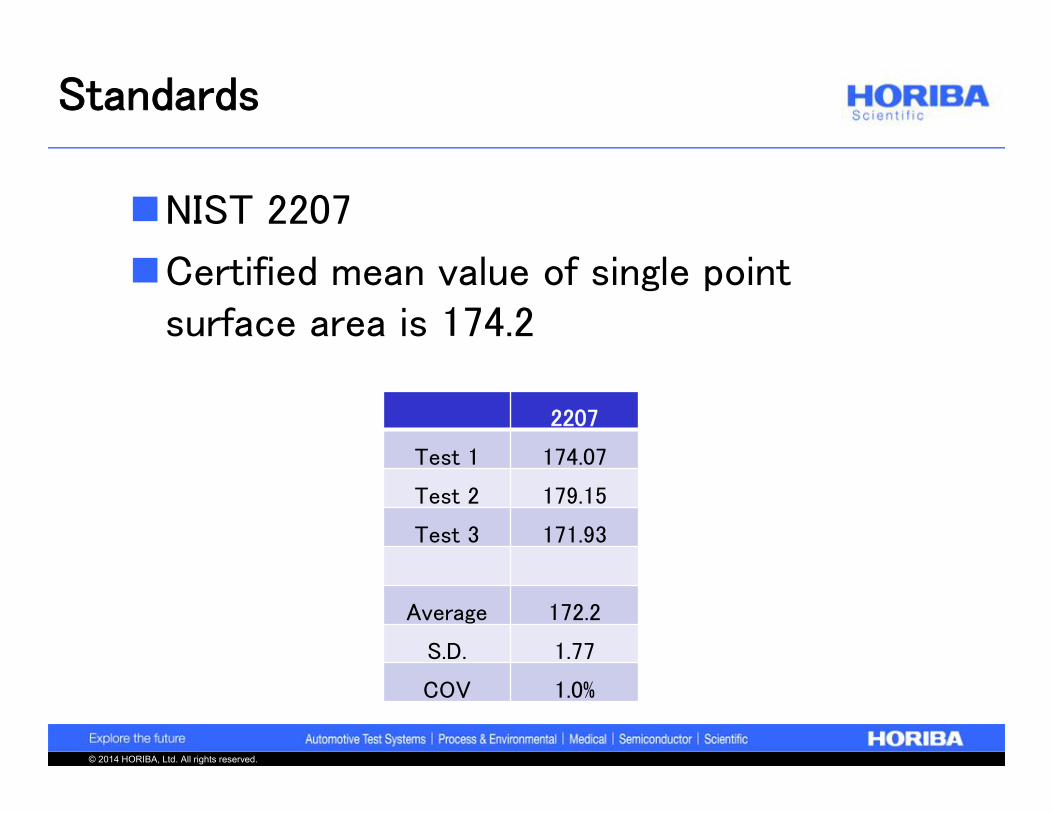
Standards
NIST 2207
Certified mean value of single point surface area is 174.2
2207
Test 1 174.07
Test 2 179.15
Test 3 171.93
Average 172.2
S.D. 1.77
COV 1.0%
© 2014 HORIBA, Ltd. All rights reserved.
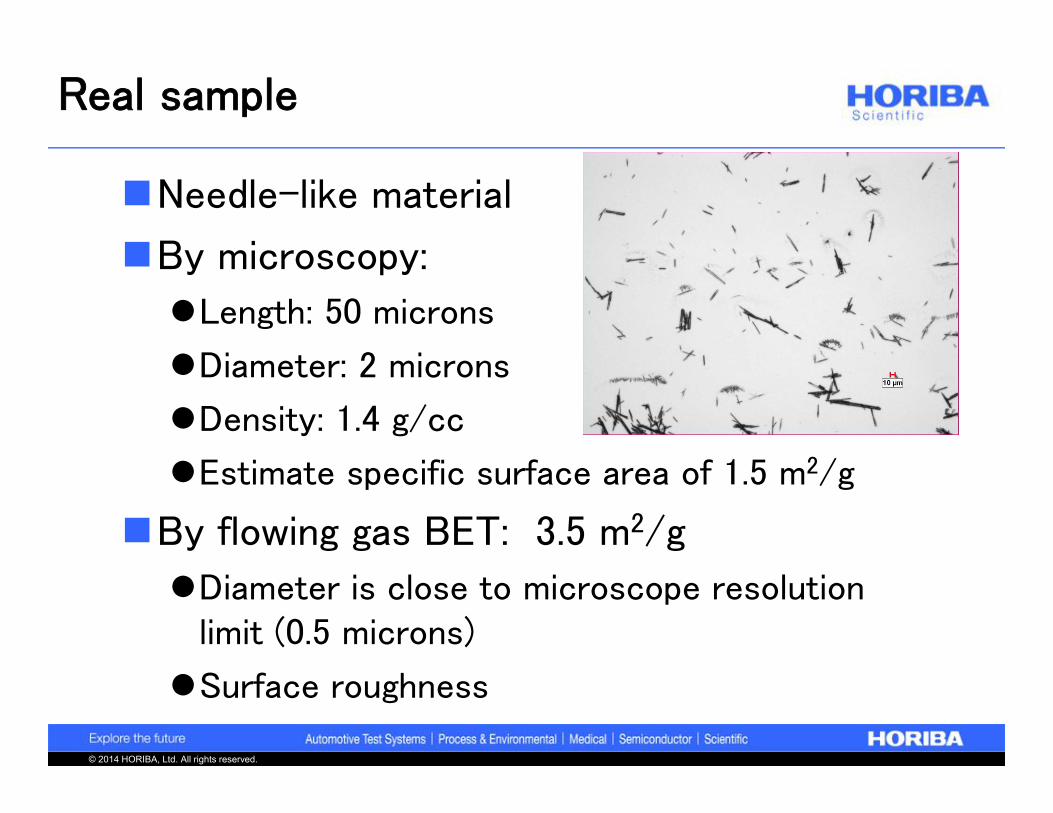
Real sample
Needle-like material
By microscopy:
Length: 50 microns
Diameter: 2 microns
Density: 1.4 g/cc
Estimate specific surface area of 1.5 m2/g
By flowing gas BET: 3.5 m2/g
Diameter is close to microscope resolution limit (0.5 microns)
Surface roughness
© 2014 HORIBA, Ltd. All rights reserved.
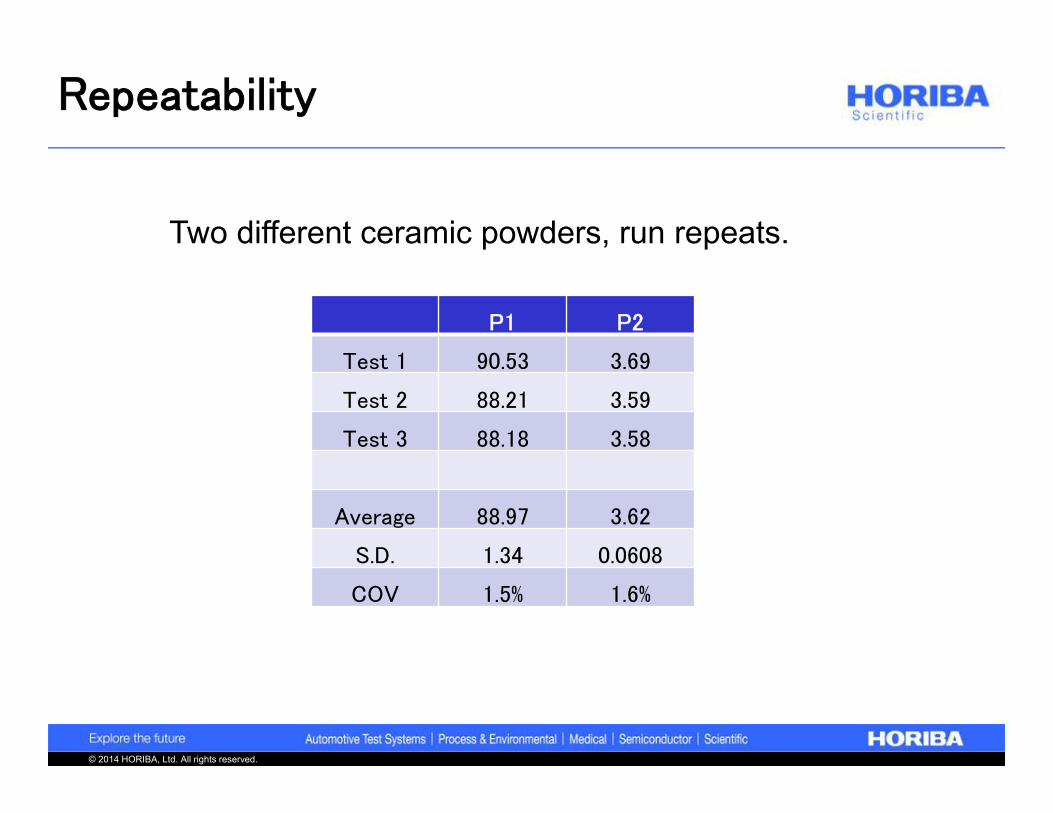
Repeatability
P1 P2
Test 1 90.53 3.69
Test 2 88.21 3.59
Test 3 88.18 3.58
Average 88.97 3.62
S.D. 1.34 0.0608
COV 1.5% 1.6%
Two different ceramic powders, run repeats.
© 2014 HORIBA, Ltd. All rights reserved.
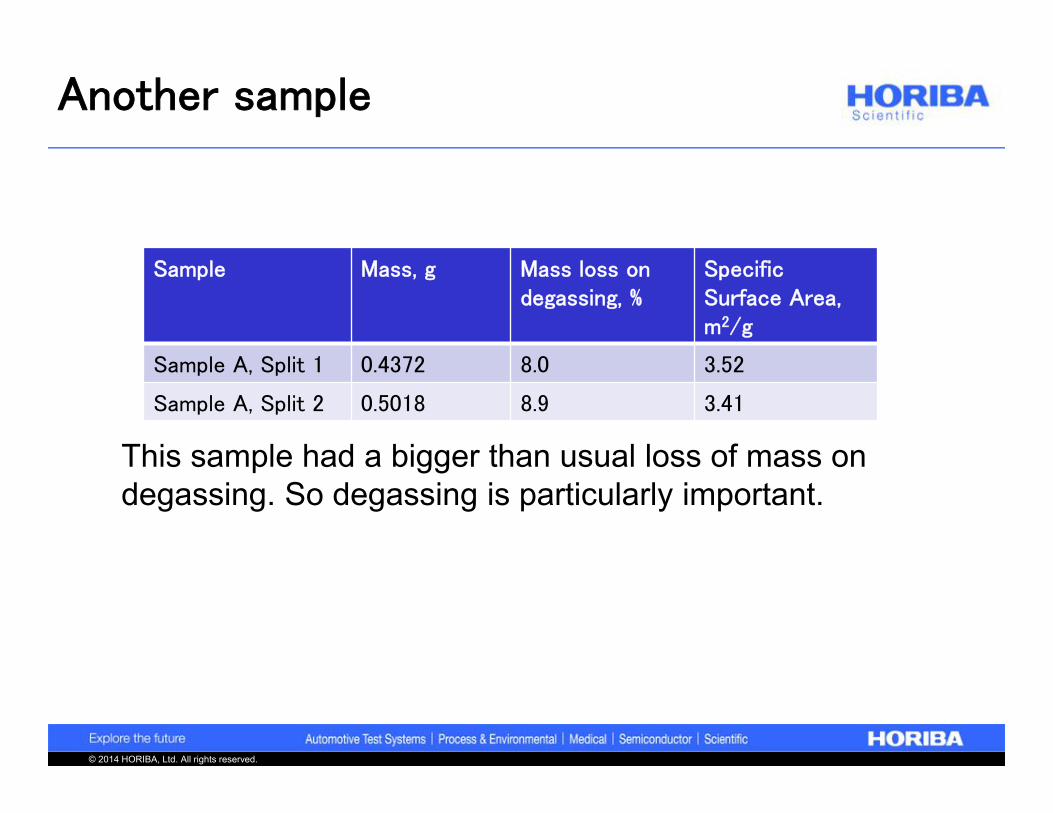
Another sample
Sample Mass, g Mass loss on degassing, %
SpecificSurface Area, m2/g
Sample A, Split 1 0.4372 8.0 3.52
Sample A, Split 2 0.5018 8.9 3.41
This sample had a bigger than usual loss of mass on degassing. So degassing is particularly important.

© 2014 HORIBA, Ltd. All rights reserved.
Advantages
Flowing gas BET advantages
Fast (5 to 10 minutes)
Repeatable
Accurate
Direct measurement of surface area
© 2014 HORIBA, Ltd. All rights reserved.
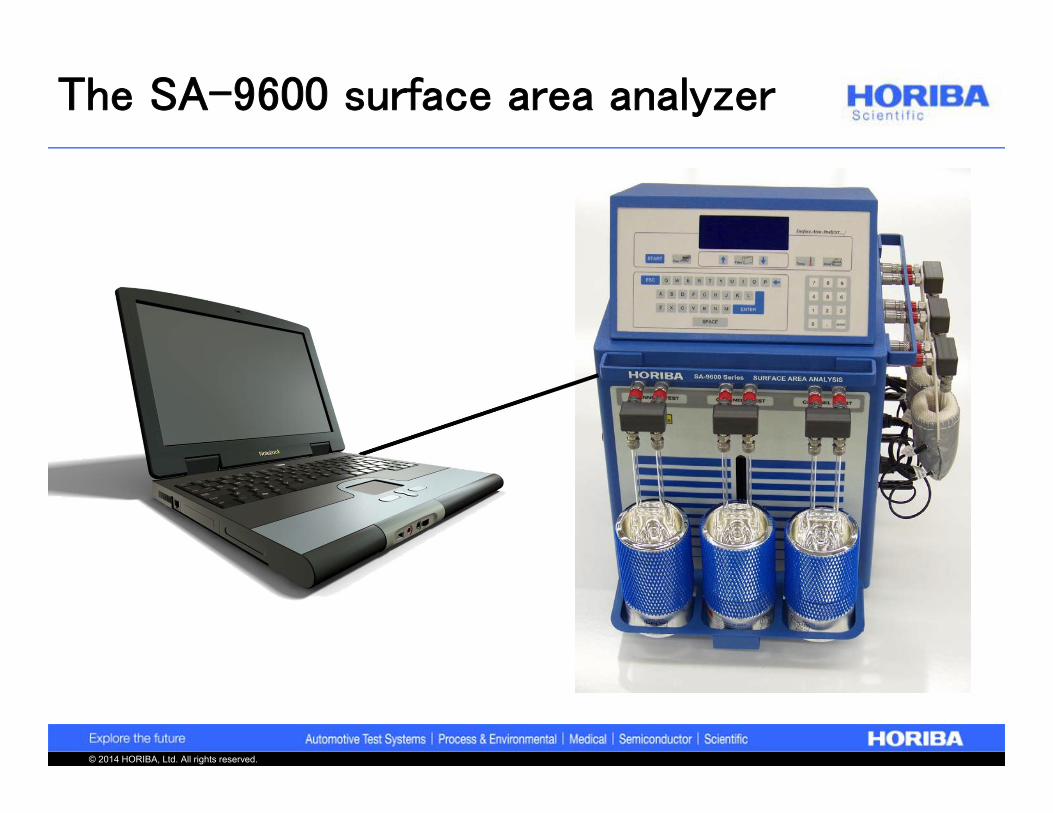
The SA-9600 surface area analyzer
© 2014 HORIBA, Ltd. All rights reserved.
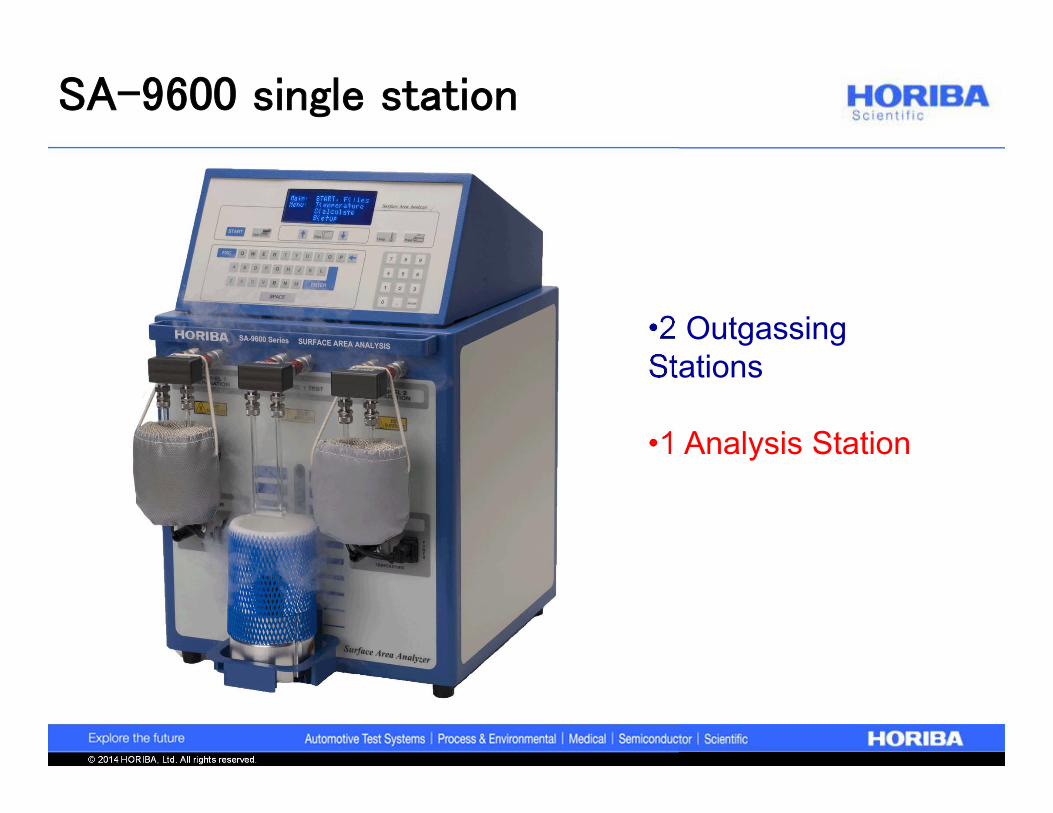
•2 Outgassing Stations
•1 Analysis Station
SA-9600 single station
© 2014 HORIBA, Ltd. All rights reserved.
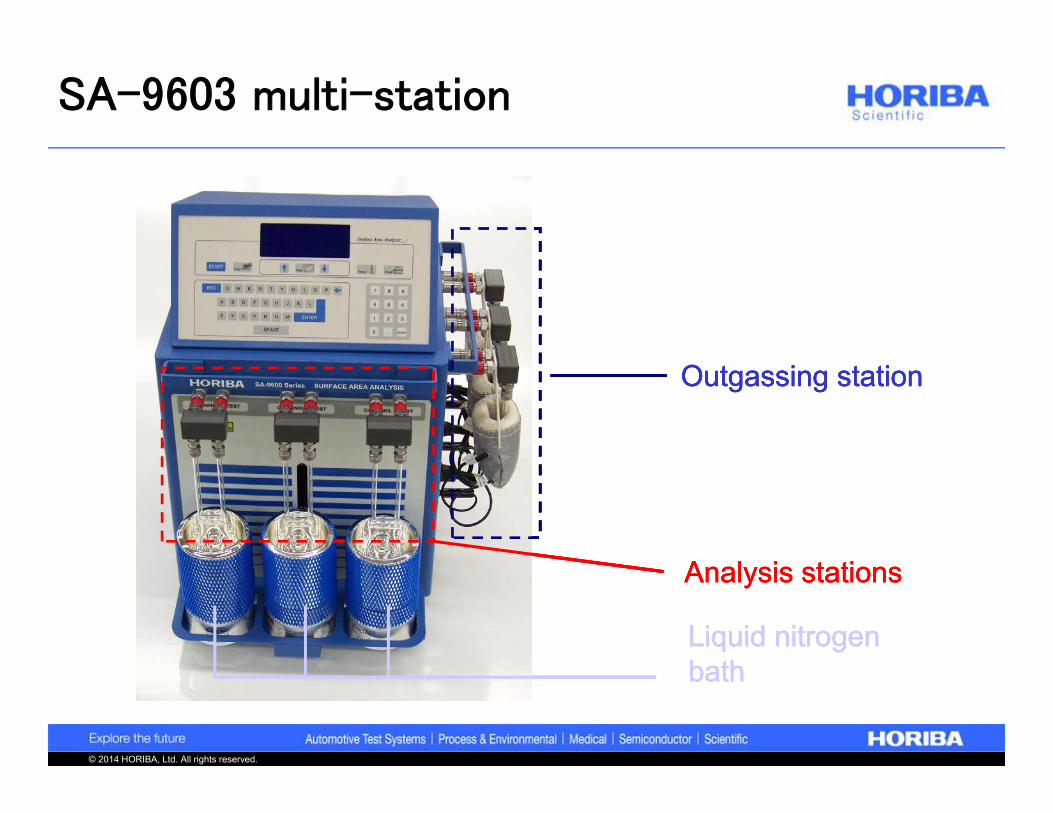
Outgassing station
Analysis stations
Liquid nitrogen bath
Outgassing station
Analysis stations
Liquid nitrogen bath
Outgassing station
Analysis stations
Liquid nitrogen bath
SA-9603 multi-station

© 2014 HORIBA, Ltd. All rights reserved.
Thank you

© 2014 HORIBA, Ltd. All rights reserved.
Danke
Gracias
Большое спасибо
Grazieاُشْكر Σας ευχαριστούμε
감사합니다Obrigado
Tacka
谢谢ขอบคุณครับ
ありがとうございました
ध यवादநன்ற
Cảm ơnDziękuję