Embed Size (px)
Citation preview
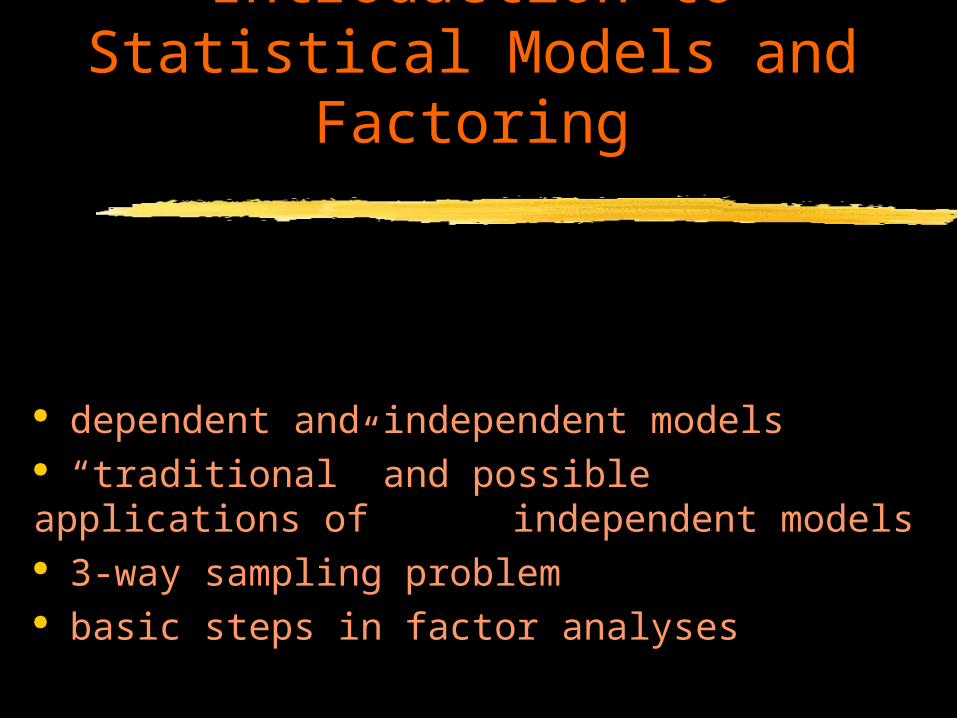
Introduction to Statistical Models and Factoring
dependent and independent models “traditional” and possible applications of
independent models 3-way sampling problem basic steps in factor analyses

Dependent multivariate models
Dependent models are used when we divide our variables into “criterion” and “predictor” variables
the value of the criterion(ia) is “dependent” on the value of the predictor(s) -- statistically / causally simple reg y’ = bx + a
multiple reg y’ = bx + bx + bx + a
canonical reg a + by + by = bx + bx + bx + a
x & y vars are quantitative, binary, coded, or interaction terms

Dependent multivariate models, cont.
Dependent models …
these are the General Linear Models from
“multivariate class”
research questions/hypotheses are about
which predictors (with what weightings) are
useful for estimating what criteria

Independent multivariate models
Independent models are used when there is no “predictor vs. criterion” distinction among our variables.
The independent models we will examine are … Factor Analysis Cluster Analysis Multidimensional Scaling
Research questions are about the number and identity (interpretation) of groupings among the “things” being analyzed

Independent multivariate models: “Traditional” Uses
Factor variables to find the number and identity of the different kinds of information Factor the 25 questions from client’s intake
interviews
Cluster people to find the number and identity of the different kinds of characteristic profiles
Cluster 250 students to took a standardized test
Scale stimuli to find the “rules of stimulus similarity and dissimilarity”
MDscale 24 shape stimuli
Before we get into the “alternative” uses of these models ...

3-way sampling problem
from a statistical or research design perspective “sampling” usually refers to the selection of some set of people from which data will be collected, for the purposes of representing what the results would be if data were collected from the entire population of people in which the researcher is interested
from a psychometric perspective “sampling” is a broader issue, with three dimensions sampling respondents to represent the desired population of
individuals sampling attributes to represent some desired domain of
characteristics sampling stimuli (things or people) to represent the desired
category(ies) of objects

3-way sampling
Examples 20 patients each rate the complexity, meaningfulness and
pleasantness of the 10 Rorschach cards 3 co-managers judge the efficiency, effectiveness, efficacy and
elegance of the 15 workers they share 10 psychologists rate each of 30 clients on their amenability to
treatment, dangerousness and treatment progress 200 respondents complete a 50 item self-report personality
measureStim
uli
Attributes
Peo
ple
Let’s look at how “people”, “attributes” and “stimuli” are used...

From the examples...
Example
#1
#2
#3
#4
People Stimuli Attributes
20 patients 10 cards cmp, ples. mng
3 co-man 15 workers e, e, e & e
10 psychists 30 clients amen, dang, tp
200 responds 1 -- “self” 50 items

So, why is it called the 3-way sampling “problem” ???
one “problem” is that most data analysis models (both dependent and independent) start from a 2-way data set, most commonly…
So, the 3-way data must be “prepared” for analysis, by either ... limited collection (only collect 2-way
data-- only one person, one stimulus, or one attribute involved)
selection (only use one 2-way “layer” from the 3-way sample)
aggregation (combine across one “way” of the 3-way sample to get a 2-way layer)
“Variables”
“Cas
es”
Let’s look at an example of each ...

Examples of data prep...
limited collection only collect 2-way data-- only
one person, one stimulus, or one attribute involved
Example -- 200 respondents complete a 50 item self-report personality measure only one stimulus (“self” or
“I”) -- so only a 2-way sampling (people x attributes)
2-way data table would look like
200
Res
pond
ents
50 Items

Examples of data prep...
selection only use one 2-way layer from the 3-
way sample
Example -- 20 patients each rate the complexity, meaningfulness and pleasantness of the 10 Rorschach cards here’s what the 3-way data array
would look like
Imagine the researcher were interested in only the meaningfulness data only those data would be selected
comp mean plesnt
20 P
atie
nts
10 C
ards

Example of selection, cont.
The resulting 2-way table would look like ...
20 P
atie
nts
10 cards
All data are mean-ingfullness ratings

Examples of data prep...
aggregation only use one 2-way layer from the 3-
way sample
Example -- 3 co-managers judge the efficiency, effectiveness, efficacy and elegance of the 15 workers they share here’s what the 3-way data array
would look like
Imagine the researcher was interested in how the workers differed in terms of the attributes
ef ef ef el
3 co
-man
grs
15 w
orke
rs
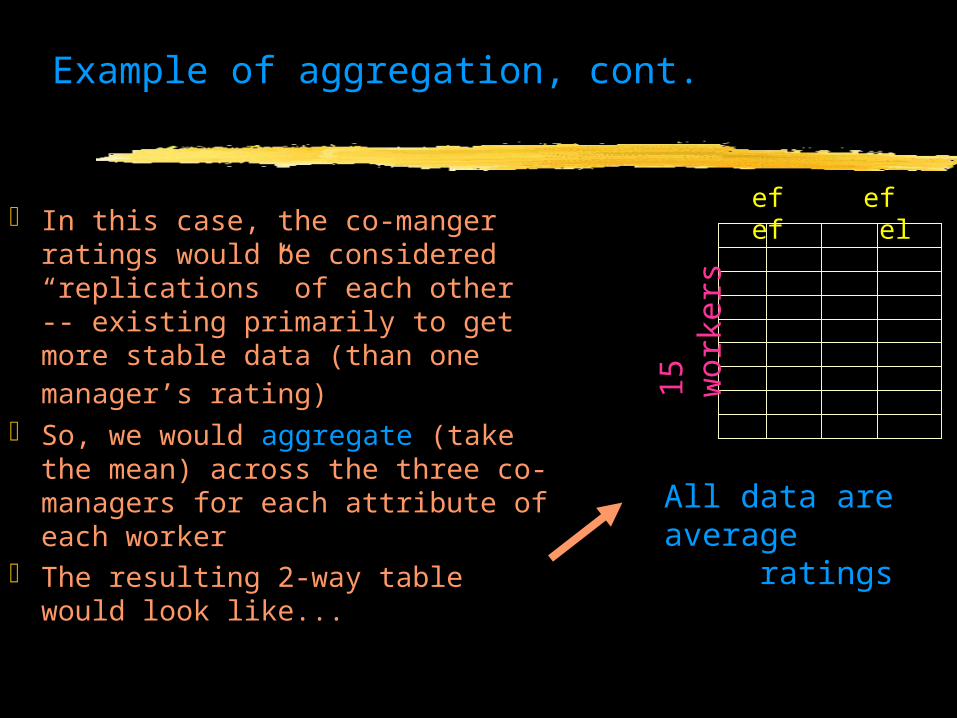
Example of aggregation, cont.
In this case, the co-manger ratings would be considered “replications” of each other -- existing primarily to get more stable data (than one manager’s rating)
So, we would aggregate (take the mean) across the three co-managers for each attribute of each worker
The resulting 2-way table would look like...
15 w
orke
rs
All data are average ratings
ef ef ef el

A second example of aggregation
Imagine the researcher was interested in how the workers differed in the ratings given by the three co-mangers
In this case, the attributes would be considered “replications” of each other -- existing primarily to get more stable data (than using one attribute)
So, we would aggregate (take the mean) across the four attributes ratings from each co-manager, for each worker
The resulting 2-way table would look like...
15 w
orke
rs
All data are average ratings
co#1 co#2 co#3

Different ways of treating data for the different models
The 2-way data table we have been discussing is often labeled the “X” matrix
starting with “X”, different things are done to prepare the data for different model
Let’s look at these ..
Remember, we’ll start with the “traditional” uses of the different models, and then look at the different ways they can be used

Factor variables to find the number and identity of the different kinds of information
“Variables”
“Cas
es”
X R “Variables”
“Var
iabl
es”
S “Factors”
“Var
iabl
es”
“R” captures the relationships among the variables which are summarized in the “S” (Structure) matrix, which provides the basis for deciding how many and what are the kinds of information the variables carry

Cluster people to find the number and identity of the different kinds of characteristic profiles
“Variables”
“Cas
es”
X D “Cases”
“C
ases
”
C
“
Cas
es”
“D” captures the similarities and differences among the cases which are summarized in “C” (Cluster membership), which provides the basis for deciding how many and what are the “sets” of people
53248. . 1
“Cluster”11122 . . 3
“Variables”
-2 -
1 0
1
2
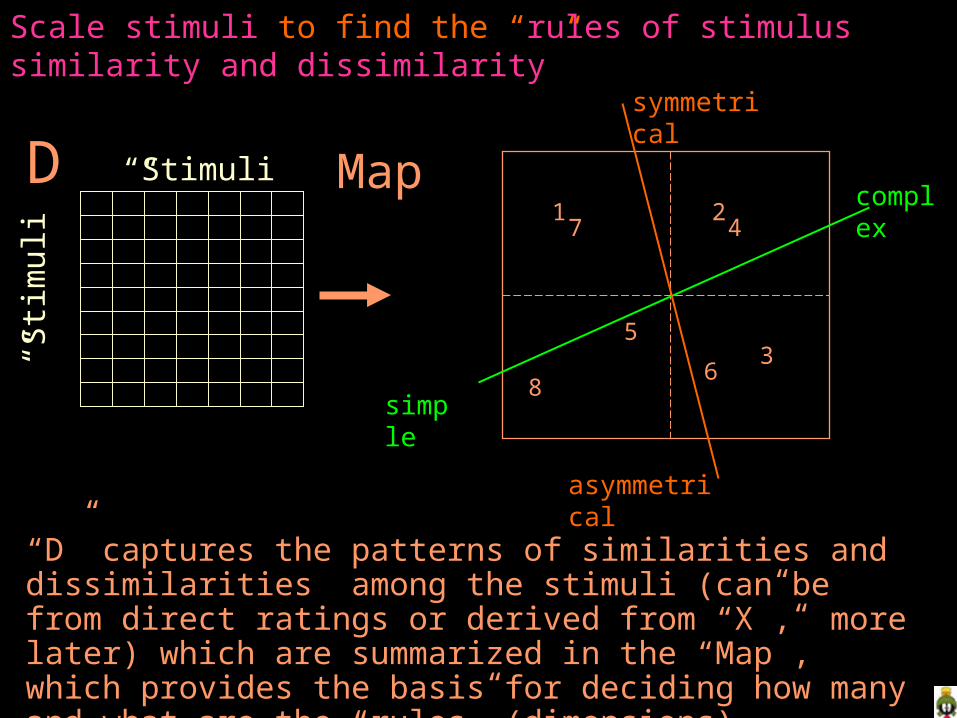
Scale stimuli to find the “rules of stimulus similarity and dissimilarity”
“Stimuli”
“Sti
mul
i”
D
“D” captures the patterns of similarities and dissimilarities among the stimuli (can be from direct ratings or derived from “X”, more later) which are summarized in the “Map”, which provides the basis for deciding how many and what are the “rules” (dimensions) underlying the patterns of stimulus similarities and dissimilarities.
17
86
35
42
Map
simple
complex
symmetrical
asymmetrical

Independent multivariate models: “Alternative” Uses
As you might imagine, we are not limited to factoring variables, clustering people, and scaling stimuli
Any combination of “interest” “data” and “model” is possible
So, there are really nine possible combinations
Factoring Clustering Scaling
Variables People Stimuli
* *
*
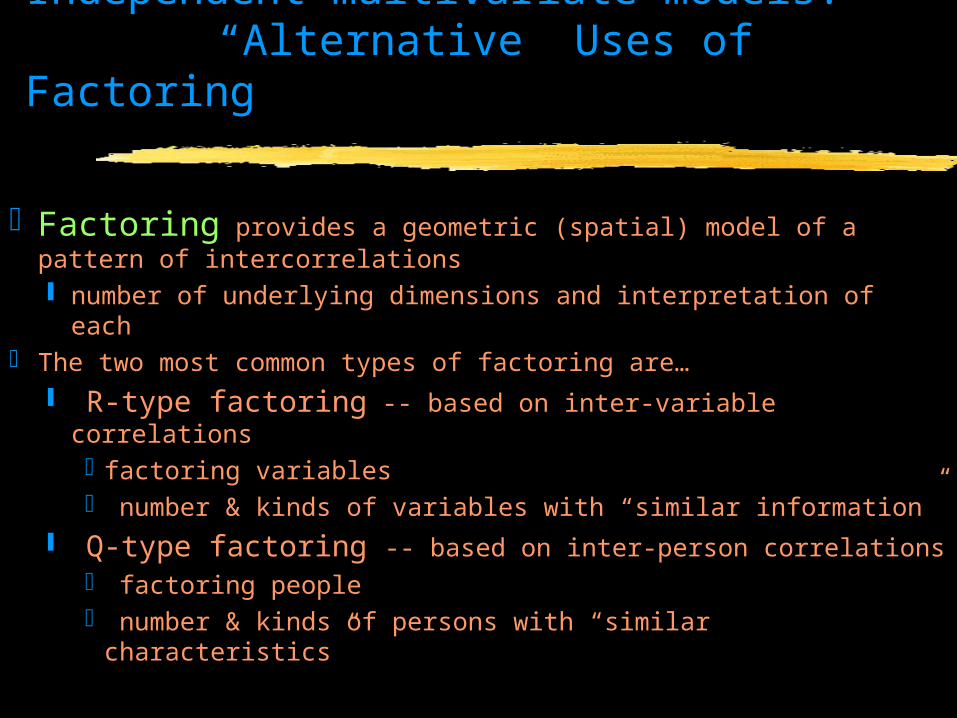
Independent multivariate models: “Alternative” Uses of Factoring
Factoring provides a geometric (spatial) model of a pattern of intercorrelations number of underlying dimensions and interpretation of each
The two most common types of factoring are… R-type factoring -- based on inter-variable correlations
factoring variables number & kinds of variables with “similar information”
Q-type factoring -- based on inter-person correlations factoring people number & kinds of persons with “similar characteristics”

Factor people to find sets of people that
have “similar characteristics” “Variables”
“Cas
es”
X Q “Cases”
“Cas
es”
S “Factors”
“C
ases
”
“Q” captures the relationships among the cases which are summarized in the “S” (Structure) matrix, which provides the basis for deciding how many and what are the kinds of persons with similar characteristics
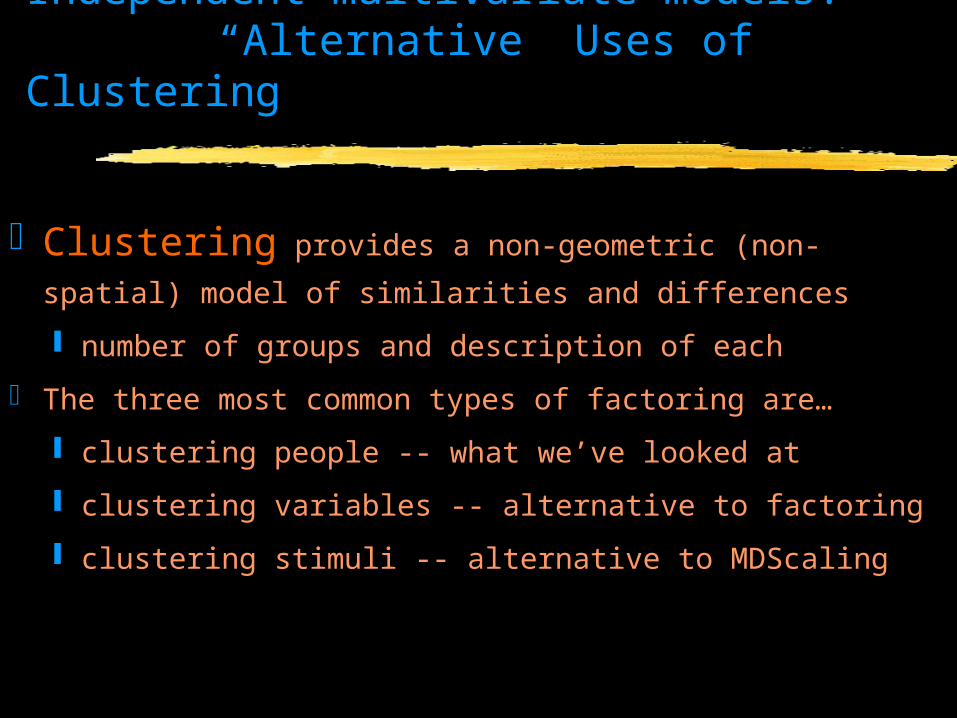
Independent multivariate models: “Alternative” Uses of Clustering
Clustering provides a non-geometric (non-spatial)
model of similarities and differences
number of groups and description of each
The three most common types of factoring are…
clustering people -- what we’ve looked at
clustering variables -- alternative to factoring
clustering stimuli -- alternative to MDScaling
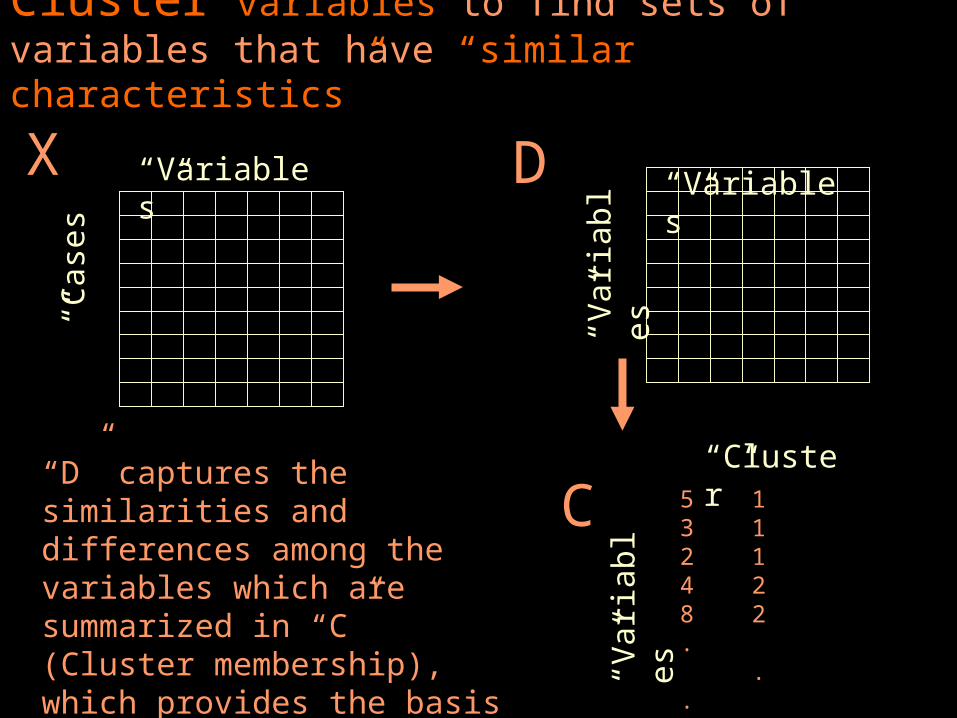
Cluster variables to find sets of variables that have “similar characteristics”
“Variables”
“Cas
es”
X D “Variables”
“Var
iabl
es”
C
“Var
iabl
es”
“D” captures the similarities and differences among the variables which are summarized in “C” (Cluster membership), which provides the basis for deciding how many and what are the “sets” of variables
53248. . 1
“Cluster”11122 . . 3

Cluster stimuli to find sets of stimuli that have “similar characteristics”
“Variables”
“Sti
mul
i”
X D “Stimuli”
“S
tim
uli”
C
“
Sti
mul
i”
“D” captures the similarities and differences among the stimuli which are summarized in “C” (Cluster membership), which provides the basis for deciding how many and what are the “sets” of stimuli
53248. . 1
“Cluster”11122 . . 3

Independent multivariate models: “Alternative” Uses of MDScaling
Scaling provides a geometric (spatial) model of a pattern of
similarities and dissimilarities
number of underlying dimensions and interpretation of each
The three types of scaling are…
Scaling stimuli -- what we’ve looked at
Scaling Variables -- an alternative to factoring
Scaling People -- an alternative to clustering
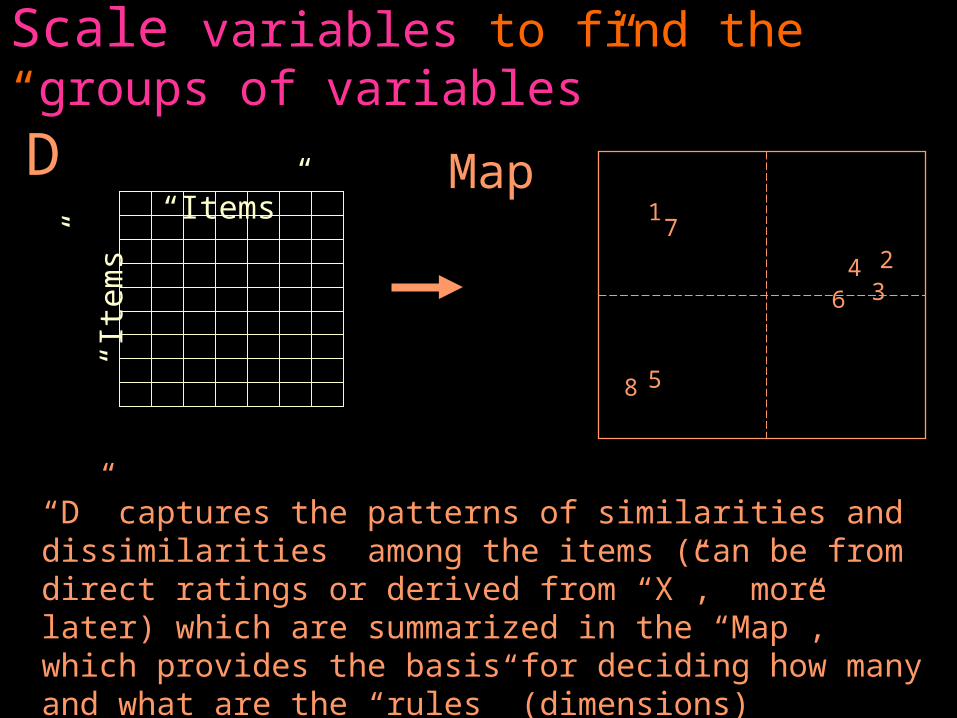
Scale variables to find the “groups of variables”
“Items”
“I
tem
s”
D
“D” captures the patterns of similarities and dissimilarities among the items (can be from direct ratings or derived from “X”, more later) which are summarized in the “Map”, which provides the basis for deciding how many and what are the “rules” (dimensions) underlying the patterns of variable similarities and dissimilarities.
17
8
6 3
5
4 2
Map

Scale people to find the “dimensions of person’s similarities and dissimilarities”
“Cases”
“Cas
es”
D
“D” captures the patterns of similarities and dissimilarities among the people (can be from direct ratings or derived from “X”, more later) which are summarized in the “Map”, which provides the basis for deciding how many and what are the “rules” (dimensions) underlying the patterns of person’s similarities and dissimilarities.
17
86
35
42
Map

Intro to MDScaling
Short HistoryPurpose & Uses of MDSSteps in MDS ResearchTypes of MDS Models/Analyses
Short History
Classical Psychophysics Began as the search for the relationships between
the physical world and the “inner life” Got boring quickly -- in the name of scientific rigor
(physical attribute) by (psychological attributes) plots
Pretty sure this wasn’t the way to go ...Unidimensional research of the multivariate world Assumes we know the physical attributes and the
psychological attributes that are important
Short History
MDS was a “extension/rebellion” of Classical Psychophysics
Sought some way to collect data to “capture” . . . the attributes/dimensions that underlie “thought” the values of stimuli (objects) on the dimensions/attributes
What might be the “basic data” for this process ?? similarities/dissimilarities among the stimuli
A “solution” that can represent the information in those similarities would capture the “rules” underlying the decisions represented in those similarities a kind of data reduction but one that “reveals underlying structure”

How MDScaling “Works”
The result of an MDS analysis is a “map” that positions the stimuli in a k-space based on the set of stimulus similarities
Ever see a map ??? Remember that “triangle” in the corner ??? Map of 8 Cities
e
h
a
fb
cg
d
a b c d e f g
b 55
c 35 35
d 45 75 40
e 10 60 40 45
f 35 80 55 30 30
g 45 30 10 45 50 60
h 80 40 40 75 85 95 35
Inter-City Distances

MDS is Map-making, only backwards
Start with the pairwise distances (dissimilarities) Assume some “k” (# of dimensions; 1-6 in SPSS) Determine the positions of the stimuli in that k-space that best match the
pairwise dissimilarities - the map Assess how well the solution represents the dissimilarities
R² -- for the dissimilarities and the solution distances larger R² indicates a “better” solution
Stress -- family of “badness of fit” indices smaller stress indicates a “better” solution
If the solution is good, the stimulus positions “reveal” the structure/rules underlying the original dissimilarities

Purpose and Uses of MDS
The purpose is to provide a spatial representation of the pairwise dissimilarities among a set of stimuli the assumption is that by interpreting this “space” we can
understand the bases (rules, attributes) of the similarities
Used to ask how people “think about” things similarities and differences among stimuli may be the most
basic process of “thinking about”
MDS has been used to reveal the “rules” or “bases of judgement” for a wide variety of domains and populations can be used for composite, group comparison or individual
differences types of analyses (more later)

Purpose and Uses of MDS, cont.
One very important use of MDS is to “check-up” on stimuli you are planning use, especially if the differences among the stimuli are the intended IV manipulation
E.g., vignette studies -- often the IV is manipulated as the differences among the stories, cases, records you are counting on (assuming) that you can anticipate…
what differences between the stories will influence the DV (those you build in as the IVs)
what differences between stories will not influence the DV (“unimportant” differences you built in to give the stories some “character” or “so they’re not all the same”)

Purpose and Uses of MDS, cont.
Remember in Factoring we noted that sometimes we learn as much about the variables as about the factors?
The same is true in MDScaling In addition to learning about the “underlying dimensions” of
thought and comparisons, we often acquire unexpected information about individual stimuli
they often get positioned in unexpected places
e.g., “influence” was the “root word” of 82 synonyms/antonyms wasn’t anywhere near the centroid of the space
e.g., “felt” “tactually flat” but “visually fluffy”

Steps in an MDS Study
Select the stimulus domain & stimuli be sure to “cover” the domain want 8-10 stimuli per expected dimension (rules vary !!)
Select the population(s) of interest Select a data collection procedure
direct scaling -- pairwise dissimilarities collected “first hand” indirect scaling -- pairwise dissimilarities computes from a
set of attribute ratings (assumes you know the attributes being used !!!)
often use both -- direct scaling data for the MDSolution and the indirect data for helping to interpret the “map”

Steps in an MDS Study, cont.
Determine the # dimensions for the “best map” “scree-like” plots using R² and Stress indices stability & replicability interpretability
Interpret the “map” visual inspection dimensional interpretation -- placing attribute vectors using
multiple regression neighborhood interpretation -- identifying clusters of stimuli
Plan the next study what will be the result of deleting &/or adding stimuli ? what will be the result of a different population ?

Types of MDS models & analyses
There are four major types of MDS analyses Composite Scaling (ALSCAL)
Assumes everybody uses the same “rules” to form dissimilarities among the stimuli and that everybody quantifies stimuli the same using those rules
Individual Differences Scaling (INDSCAL) Assumes everybody uses the same “rules” (or a
subset of them) but provides for individual differences relative importance of those rules across people

Types of MDS models & analyses, cont.
There are four major types of MDS analyses Group Comparison Analyses (need a priori groups)
Form a composite solution for each “group” and compare them -- looking for similarities and differences in “rules” or “quantification” across the groups
Group Identification Analyses (“like” clustering) Identify groups of participants that have similar
pairwise dissimilarity data -- these folks use similar rules/quantifications -- then identify the group


![Untitled-1 [spanish.mbgs.com.au]...Generation of ply models, working section models, coal quality models and block models Independent model reviews and audits Utilisation of industry](https://img.pdfslide.us/doc/110x75/5e2bd299eac48066260869f1/untitled-1-generation-of-ply-models-working-section-models-coal-quality.jpg)