Embed Size (px)
Citation preview

1
Introduction to SPSS 16.0
Kevin Schoepp
2
Outline
• Review of Concepts (stats and scales)
• Data entry (the workspace and
labels)
–By hand
– Import Excel
• Running an analysis- frequency,
central tendency, correlation
3
Types of Statistics
• Descriptive- summarize or describe our observations
• Inferential- use observations to
allow us to make predictions (inferences) about a situation that has not yet occurred

4
Descriptive or Inferential?
a) I cycle about 50 km per week on average.
b)We can expect a lot of rain this
time of year.
Rowntree, D. (1981). Statistics without tears. London: Penguin Books.

Population vs Sample
• A population refers to all the cases to which a researcher wants his estimates
to apply to
–White mice, lightbulb life, students
• A sample is used because it is normally impossible to study all the members of a
population
• Descriptive stats simply summarize a
sample
• Inferential stats generalize from a
sample to the wider population5
Variables
• Samples are made up of individuals, all individuals have characteristics.
Members of a sample will differ on certain characteristics. Hence, we call this variation amongst
individuals variable characteristics or variables for short.
6
Rowntree, D. (1981). Statistics without tears. London: Penguin Books.
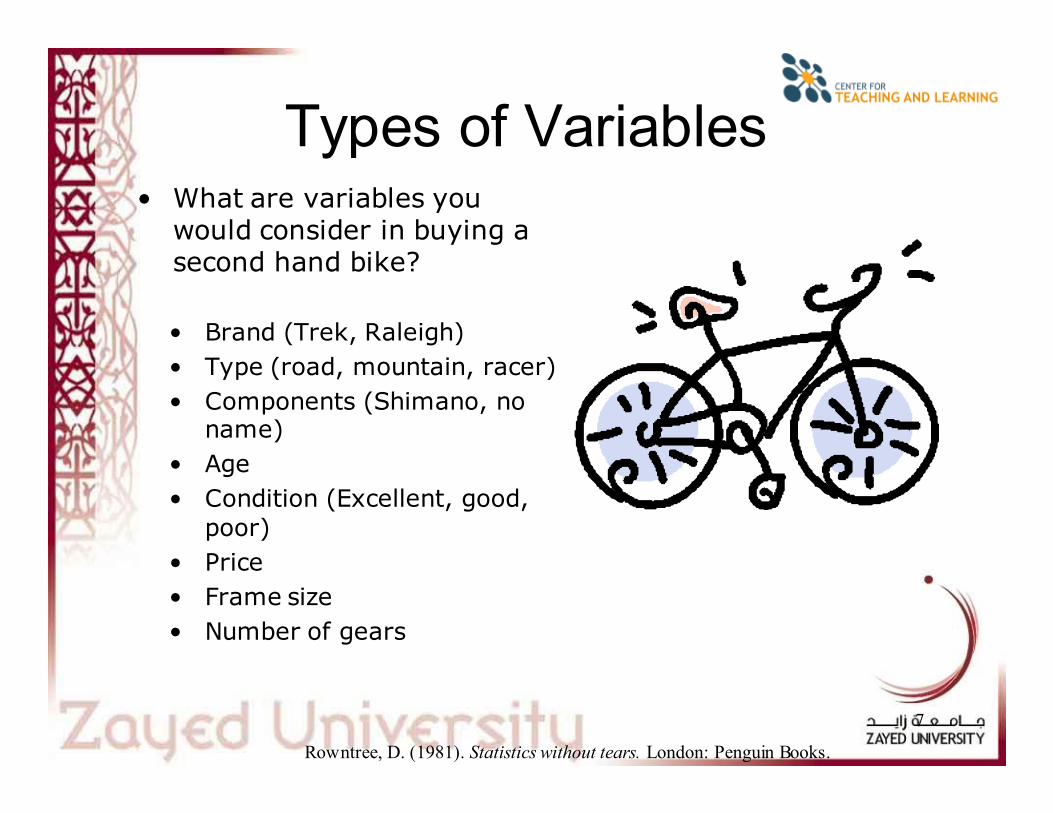
Types of Variables• What are variables you would consider in buying a second hand bike?
7
Rowntree, D. (1981). Statistics without tears. London: Penguin Books.
• Brand (Trek, Raleigh)
• Type (road, mountain, racer)
• Components (Shimano, no name)
• Age
• Condition (Excellent, good,
poor)
• Price
• Frame size
• Number of gears
8
Types of Scales
• Nominal- objects or people are categorized according to some criterion
(gender, job category)
• Ordinal- Categories which are ranked
according to characteristics (income-
low, moderate, high)
• Interval- contain equal distance between units of measure- but no zero
(calendar years, temperature)
• Ratio- has an absolute zero and
consistent intervals (distance, weight)
Parametric vs Non-parametric
• Parametric stats are more powerful than non-parametric stats- for real
numbers- T test
• Non-parametric stats are not as powerful but good for category variables - Mann-Whitney U
(likert)
9

10
The Workspace
Cases
Variables
Toggle between
Data and Variable
Views
Value labels
11
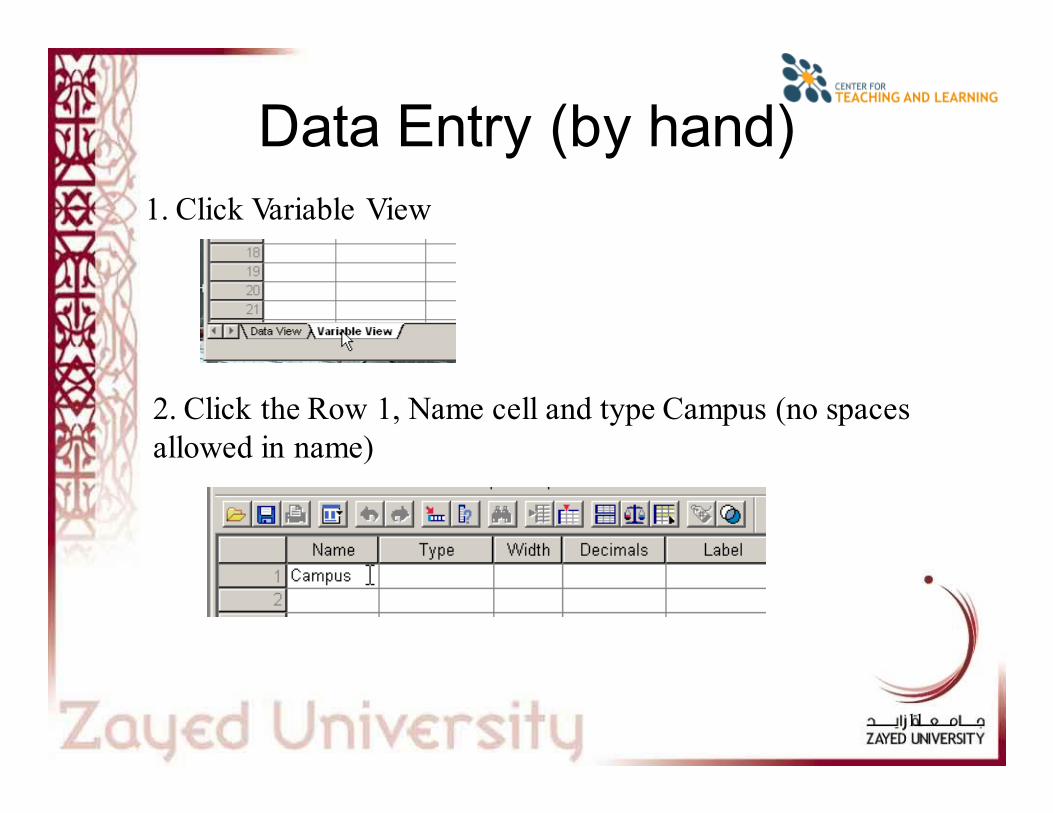
Data Entry (by hand)
1. Click Variable View
2. Click the Row 1, Name cell and type Campus (no spaces
allowed in name)
12
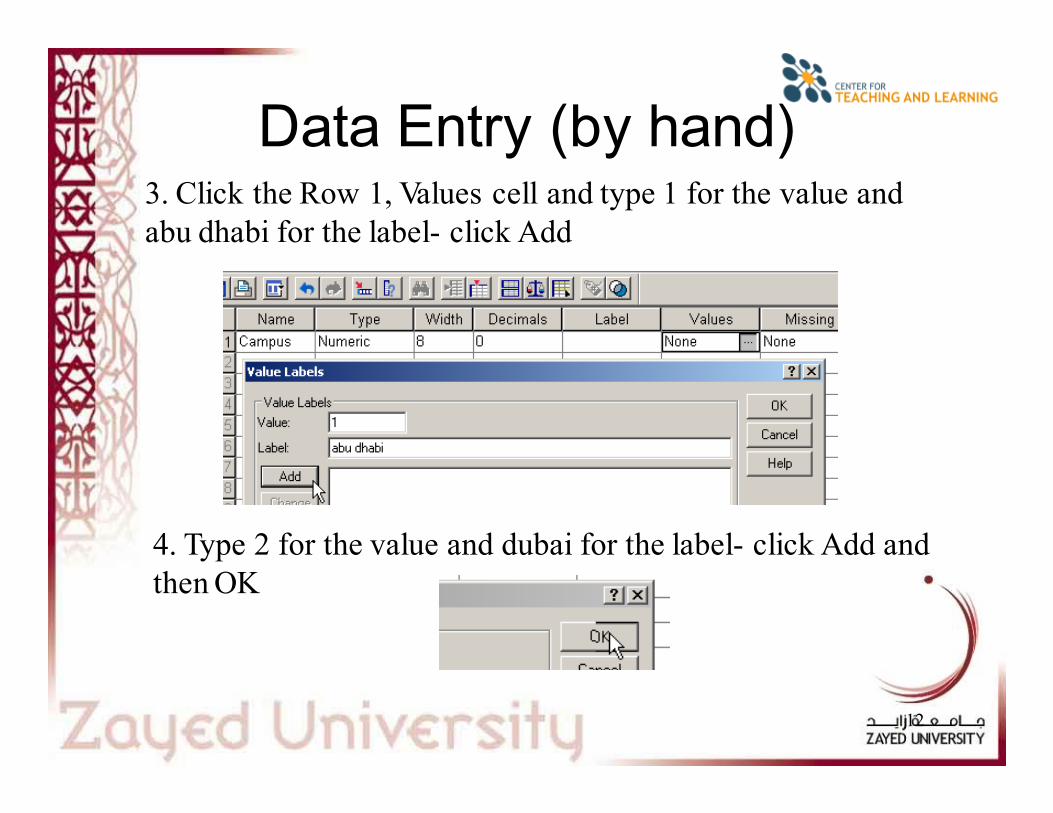
4. Type 2 for the value and dubai for the label- click Add and
then OK
3. Click the Row 1, Values cell and type 1 for the value and
abu dhabi for the label- click Add
Data Entry (by hand)

13
Data Entry (by hand)5. Click the Row 2, Name cell and type TOEFL
6. Click the Row 2, Label cell and type Paper based TOEFL
Scores
14
Data Entry (by hand)
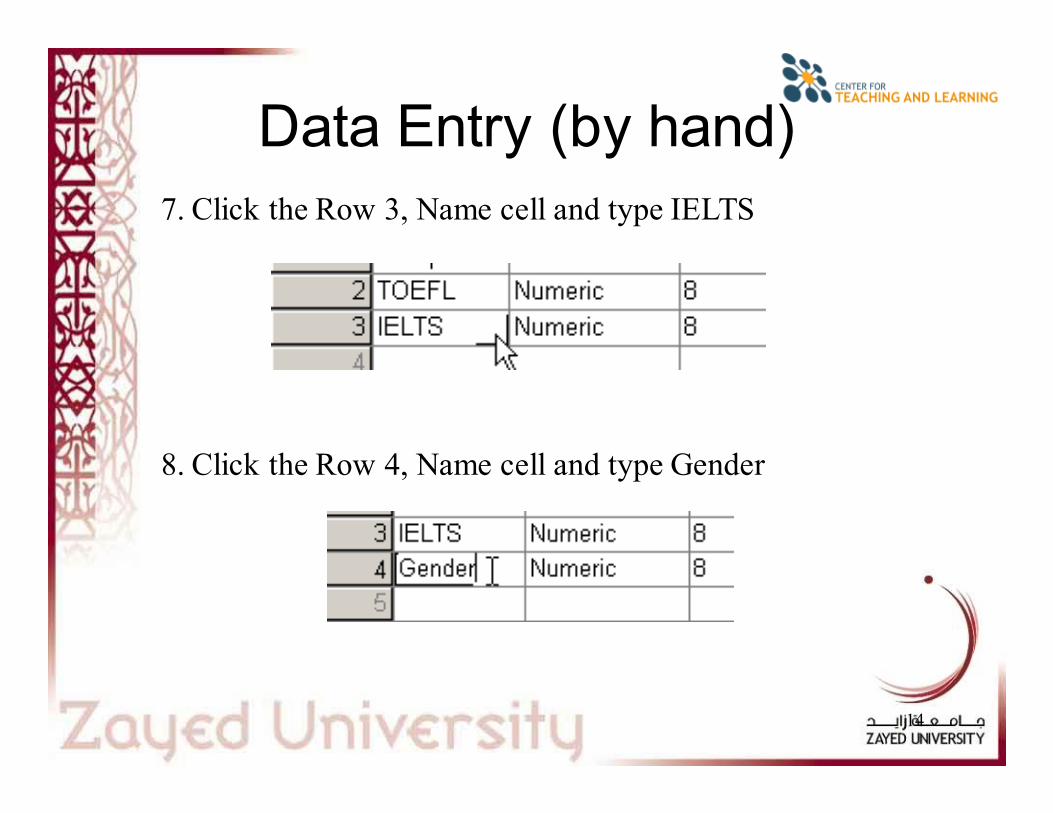
8. Click the Row 4, Name cell and type Gender
7. Click the Row 3, Name cell and type IELTS

15
Data Entry (by hand)9. Click the Row 4, Type cell and click String and click OK
10. Click the Row 4, Values cell and type m for the value and
male for the label- click Add

16
Data Entry (by hand)11. Type f for the value and female for the label- click Add
and then OK (notice the measure is now nominal)
12. Click Data View in the bottom left corner to start entering
the data

17
Data Entry (by hand)13. Click on the cells and enter the data (either type numbers
of select from the dropdown menu)
18
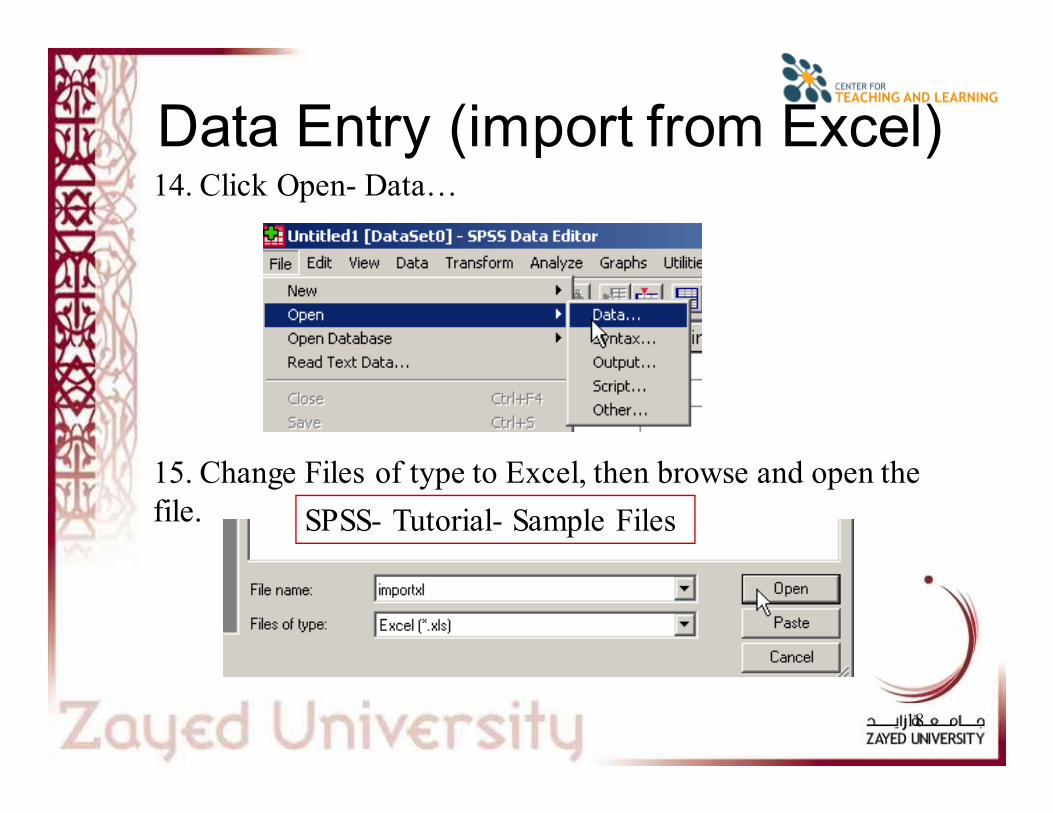
Data Entry (import from Excel)14. Click Open- Data…
15. Change Files of type to Excel, then browse and open the
file. SPSS- Tutorial- Sample Files

19
Data Entry (import from Excel)16. Select the worksheet, the range (if desired), and if to read
variable names- click OK
The data and variable names will
appear
20
Running Analyses
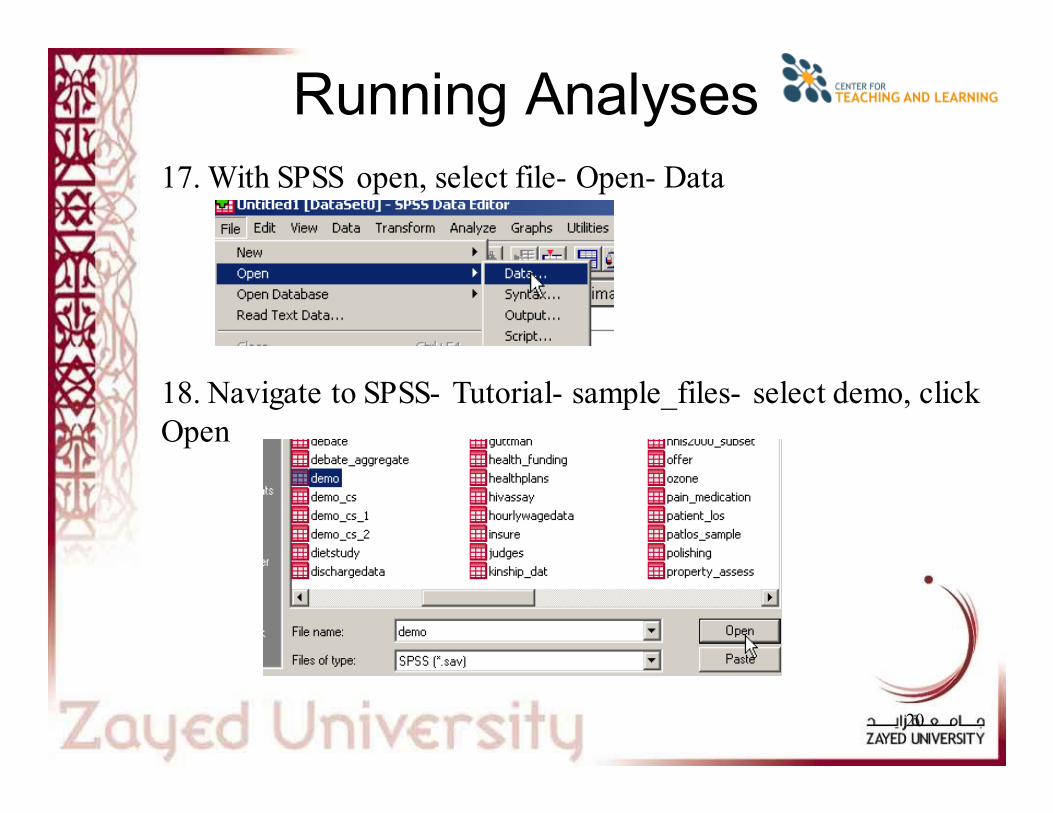
17. With SPSS open, select file- Open- Data
18. Navigate to SPSS- Tutorial- sample_files- select demo, click
Open

21
Running Analyses (Frequency)19. Select Analyze- Descriptive Stats- Frequencies
20. Select the desired variables and click the arrow to move them
to the right side

22
21. Click Statistics
22. Select any stats that you want to see, click Continue
Running Analyses (Frequency)
23
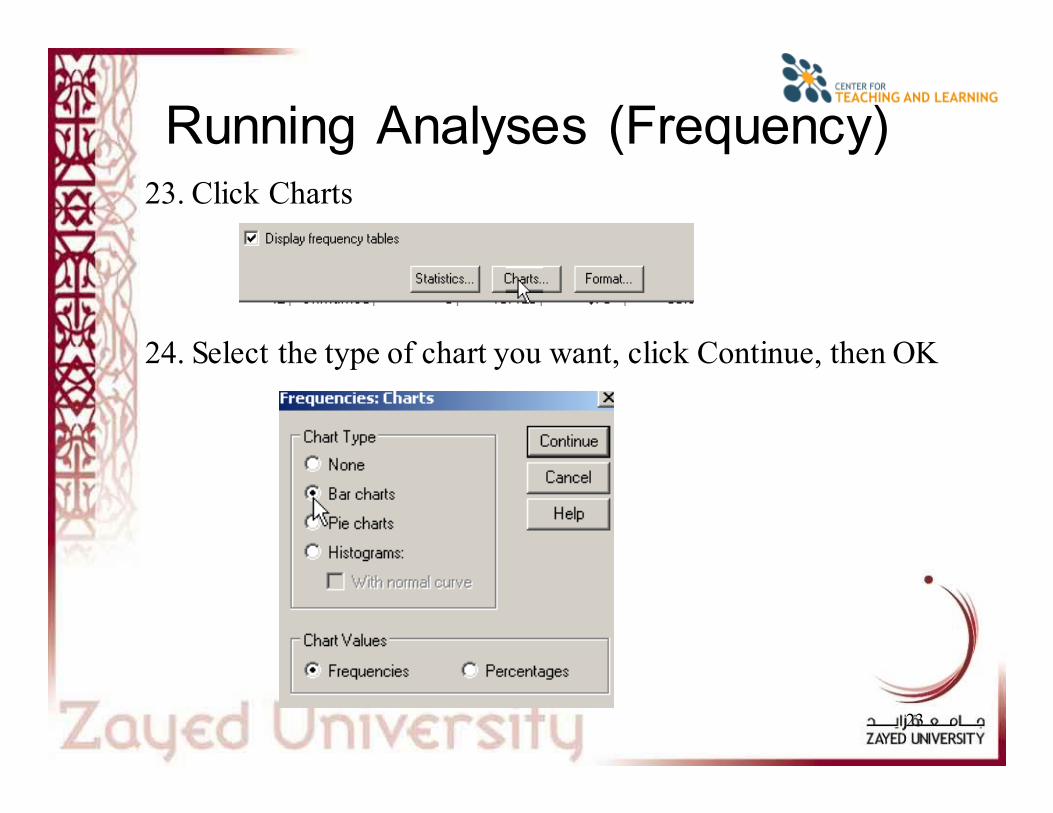
Running Analyses (Frequency)23. Click Charts
24. Select the type of chart you want, click Continue, then OK

24
Running Analyses (Frequency)Result Tables and Graphs will appear

25
Running Analyses (Central
Tendency)
26. Select the desired variables (household income) and click the
arrow to move them to the right side
25. Select Analyze- Descriptive Stats- Frequencies

26
Running Analyses (Central
Tendency)
Results will appear
27. Select some measures of
central tendency and
dispersion- click Continue
then OK
27
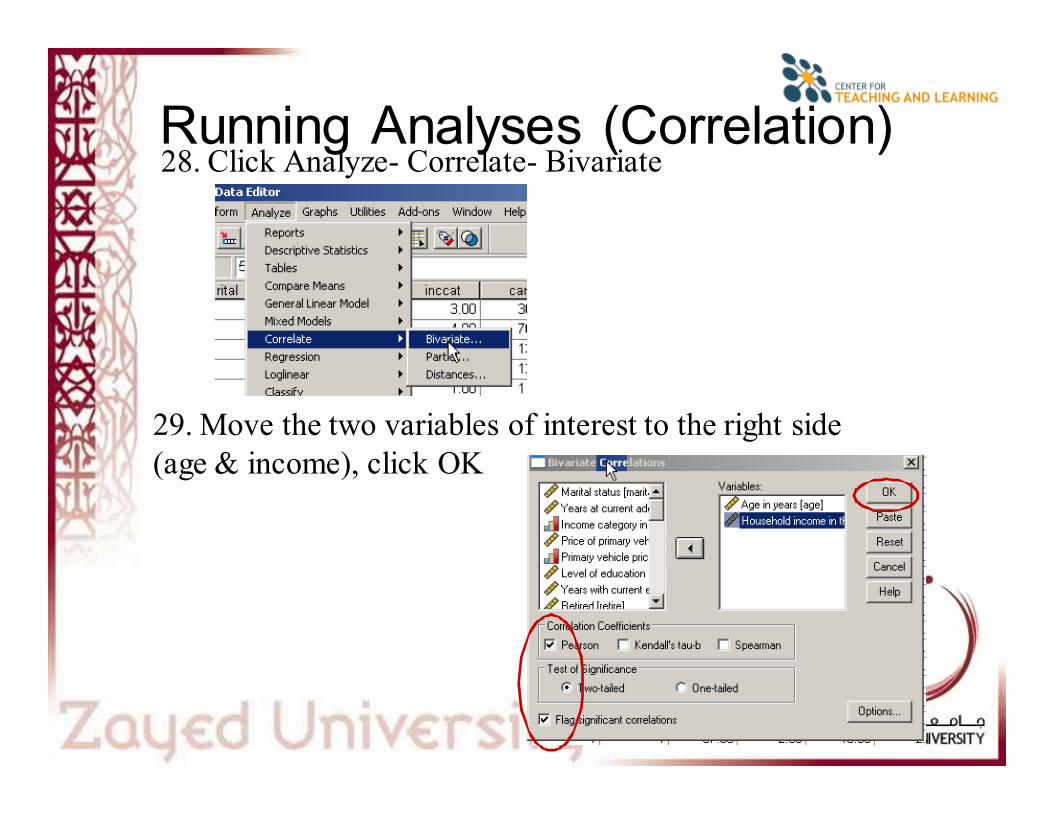
Running Analyses (Correlation)28. Click Analyze- Correlate- Bivariate
29. Move the two variables of interest to the right side
(age & income), click OK
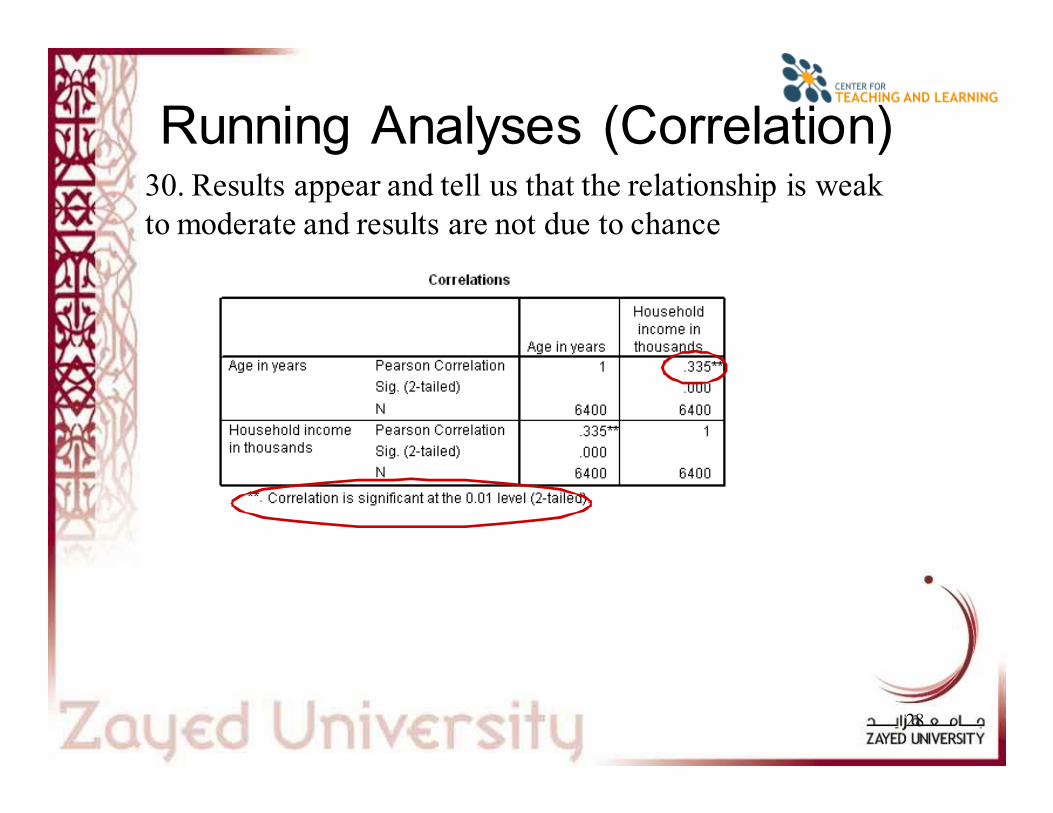
28
Running Analyses (Correlation)30. Results appear and tell us that the relationship is weak
to moderate and results are not due to chance

29
Resources• Texas A & M- a huge selection of helpful movies http://www.stat.tamu.edu/spss.php
• UCLA- SPSS 12.0 Starter Kit (useful movies, FAQs, etc) http://www.ats.ucla.edu/stat/spss/sk/default.htm
• Indiana University- Getting Started (useful instructions with screenshots)http://www.indiana.edu/~statmath/stat/spss/win/
• University of Toronto- A Brief Tutorial (screenshots, instructions and basic stats)
http://www.psych.utoronto.ca/courses/c1/spss/page1.htm• Central Michigan- Tutorials and Clips (movies, screenshots, instructions- slow loading but good)http://calcnet.mth.cmich.edu/org/spss/toc.htm
• SPSS Statistics Coach and Tutorial (under Help) as well as the ZU library
• Online Statistics Textbookhttp://www.statsoft.com/textbook/stathome.html