Embed Size (px)
Citation preview
Design. Build. Ship. Service.
Six Sigma Operational Green Belt Training
FSG-S-M01
Introduction to Six Sigma
2Design. Build. Ship. Service.
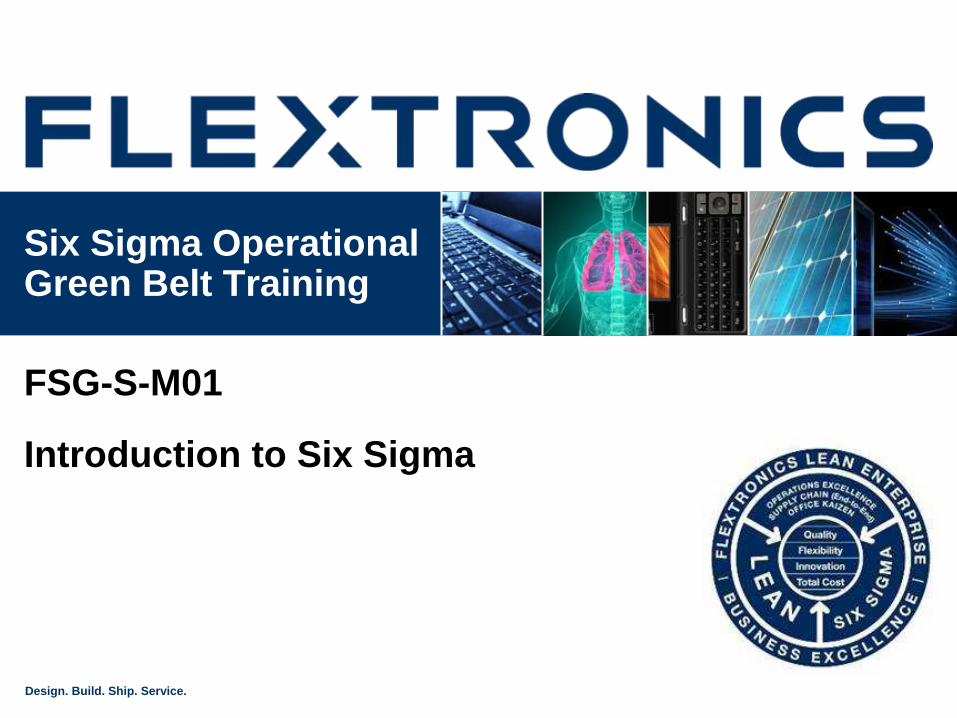
Course Navigation Tips
This course is designed so that the user advances the slides. Use the movie control panel at the bottom (1), or the course menu on the right (2) to navigate between the slides.
11
22
Click Play to startClick Play to start
3Design. Build. Ship. Service.
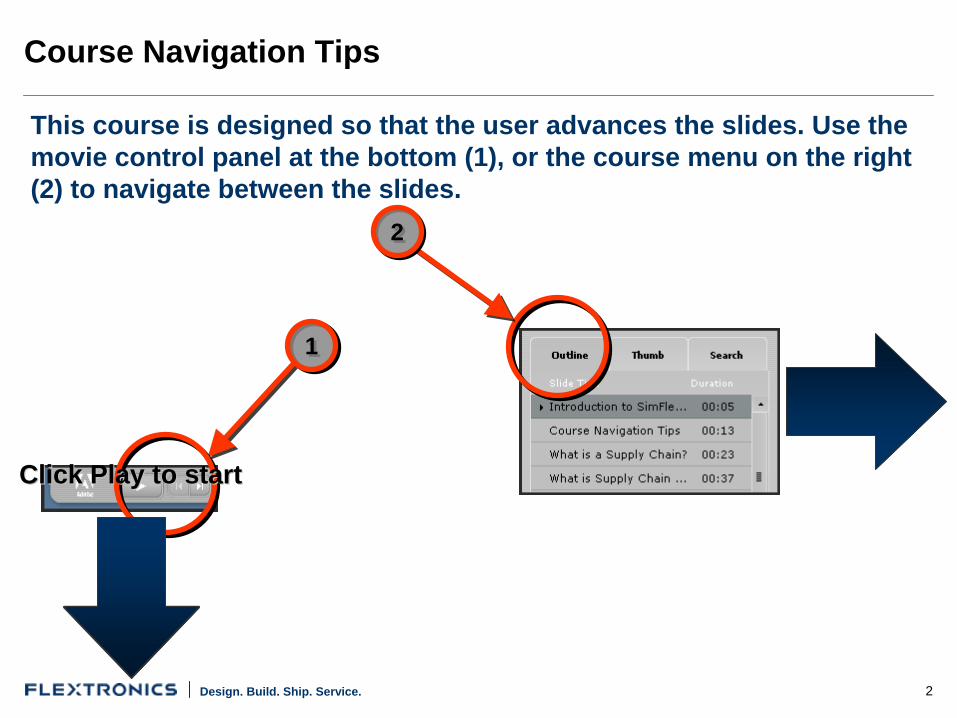
APPROVALS
NAME TITLE DEPT NAME DATE Anand Pradhan Senior Director Six Sigma
REVISION HISTORY
REVISION DESCRIPTION OF CHANGE ORIGINATOR RELEASE DATE 01 Document formatted as per DMS policy Victor Chow April 26, 2010
This document is proprietary and confidential property of Flextronics.
Document Title: Introduction to Six Sigma
Document# FSG-S-M01
Organization: Global Business Excellence
Revision: 01
Document Owner: Victor Chow
Effective Date: April 26, 2010
4Design. Build. Ship. Service.
Green Belt Training Objectives
• To learn the systematic approach of Six Sigma problem solving method:• M before A before I before C
• To understand and effectively utilise the M.A.I.C. tool kit
• To understand how you will be affected by the application of the Six Sigma methodology
5Design. Build. Ship. Service.
Module Objectives
• Six Sigma concept
• Define, Measure, Analyze, Improve and Control
• Explain the definition and scope of Green Belt and Black Belt
• Define KPIV and KPOV
• Explain how process outputs are a function of the inputs
• Explain the value of measurement
6Design. Build. Ship. Service.
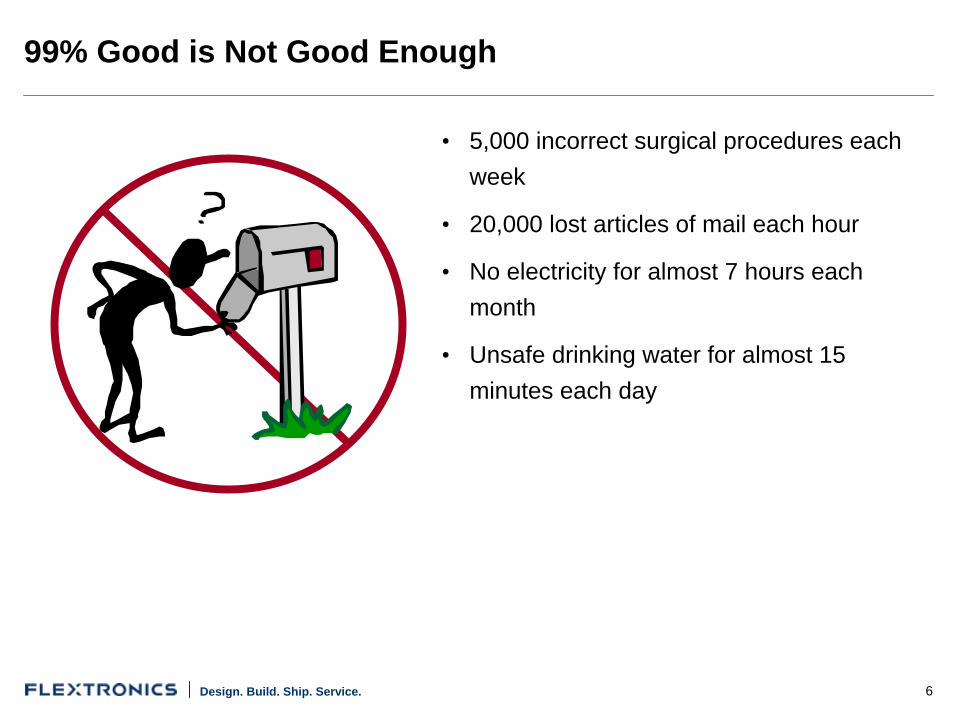
99% Good is Not Good Enough
• 5,000 incorrect surgical procedures each week
• 20,000 lost articles of mail each hour
• No electricity for almost 7 hours each month
• Unsafe drinking water for almost 15 minutes each day
7Design. Build. Ship. Service.
7
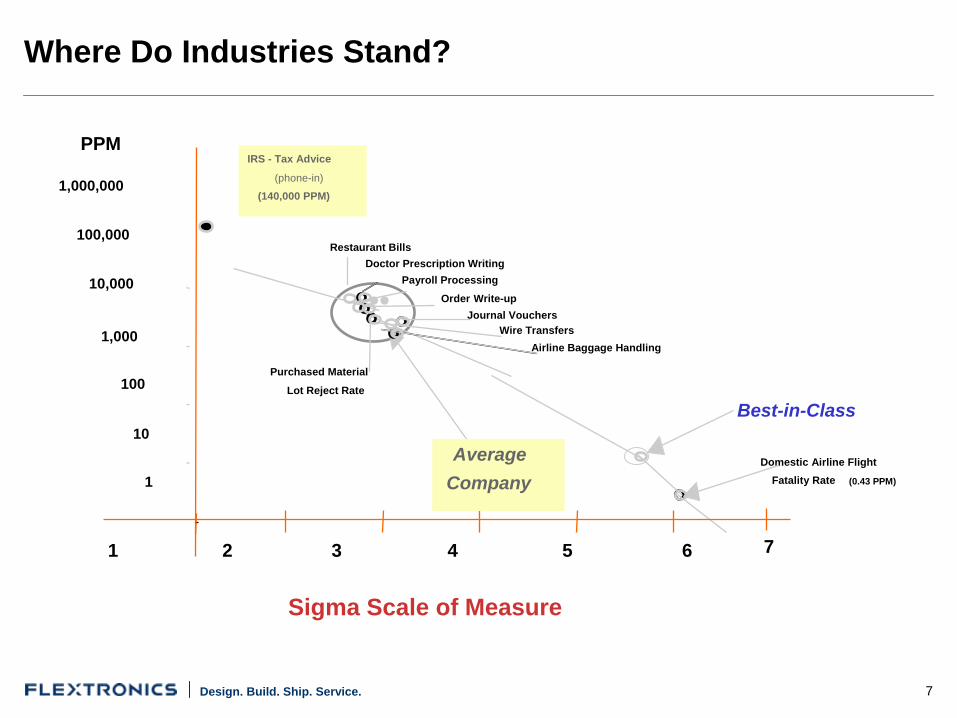
Sigma Scale of Measure
1,000,000
100,000
10,000
1,000
100
10
1
PPM
••
Restaurant BillsDoctor Prescription Writing
Payroll Processing
Order Write-upJournal Vouchers
Wire TransfersAirline Baggage Handling
Purchased Material
Lot Reject Rate
Domestic Airline Flight Fatality Rate (0.43 PPM)
Best-in-Class
AverageCompany
3 4 5 621
IRS - Tax Advice
(phone-in)
(140,000 PPM)
Where Do Industries Stand?
8Design. Build. Ship. Service.
How Does Six Sigma Make the Difference?
• Vision
• Philosophy
• Vehicle for:• Customer focus• Breakthrough improvement• Continuous improvement• People involvement
• Aggressive goal
• Metric (standard of measurement)
• Method
9Design. Build. Ship. Service.
Six Sigma Vision
The Vision of Six Sigma is• to delight customers• by delivering world-class quality products
through• the achievement of Six Sigma levels of
performance• in everything we do
10Design. Build. Ship. Service.
Six Sigma Philosophy
The Philosophy of Six Sigma is• to apply a structured, systematic
approach• to achieve breakthrough
improvement• across all areas of our business
11Design. Build. Ship. Service.
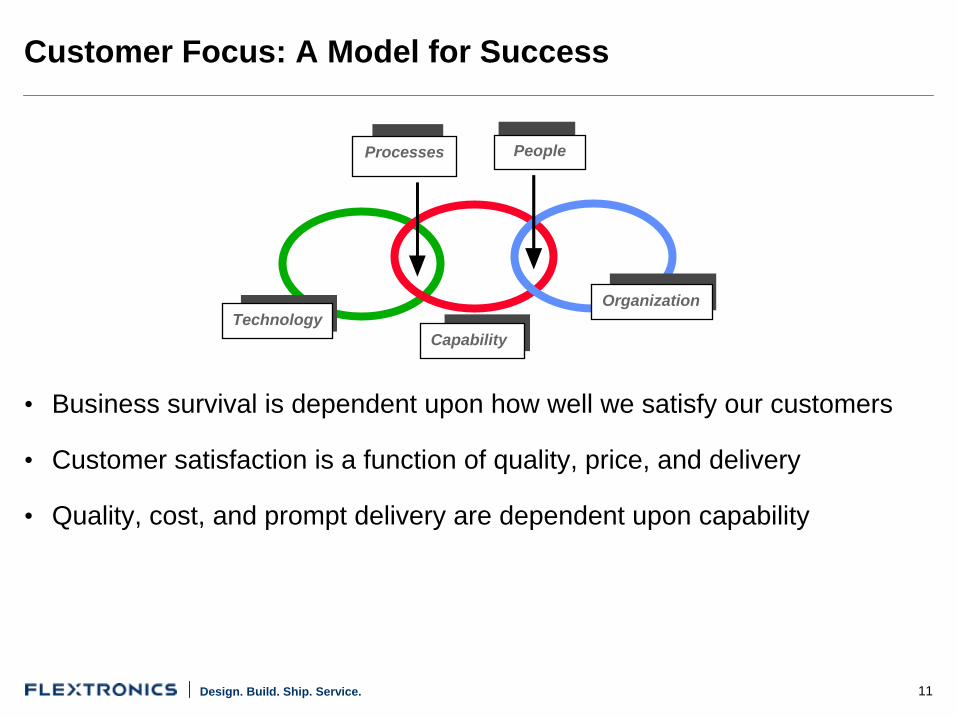
TechnologyCapability
Organization
PeopleProcesses
Customer Focus: A Model for Success
• Business survival is dependent upon how well we satisfy our customers
• Customer satisfaction is a function of quality, price, and delivery
• Quality, cost, and prompt delivery are dependent upon capability
12Design. Build. Ship. Service.
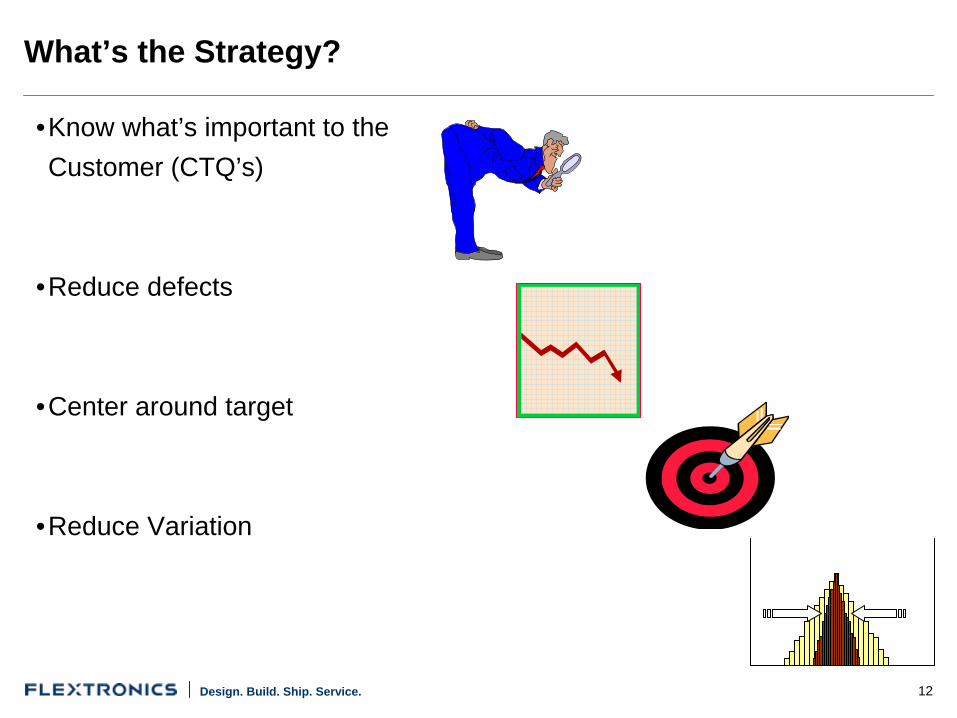
What’s the Strategy?
• Know what’s important to the Customer (CTQ’s)
• Reduce defects
• Center around target
• Reduce Variation
13Design. Build. Ship. Service.
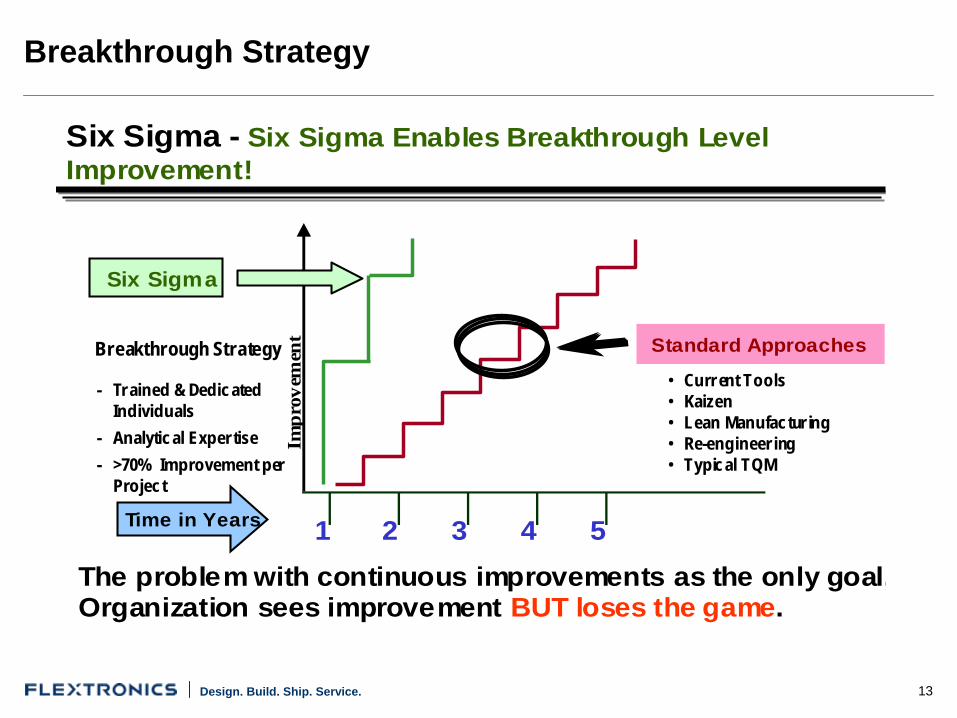
Six Sigma - Six Sigma Enables Breakthrough Level Improvement!
1 2 3 4 5The problem with continuous improvements as the only goal,Organization sees improvement BUT loses the game.
Time in Years
Standard Approaches
• Curr ent Tools• Kaizen• Lean Manufactur ing• Re-engineer ing• Typical TQM
Impr
ovem
entBreakthrough Strategy
- Tr ained & Dedicated Individuals
- Analytical Exper tise- >70% Improvement per
Project
Six Sigma
Breakthrough Strategy
14Design. Build. Ship. Service.
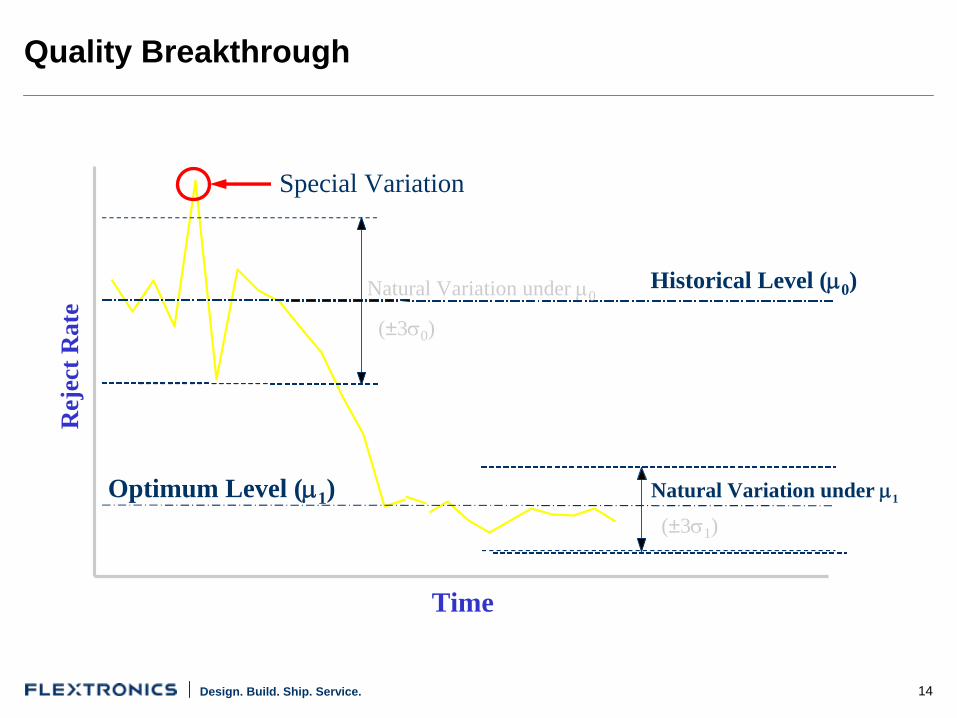
Time
Rej
ect R
ate
Special Variation
Historical Level (0 )
Optimum Level (1 )
Natural Variation under 0
Natural Variation under 1
(±30 )
(±31 )
Quality Breakthrough
15Design. Build. Ship. Service.
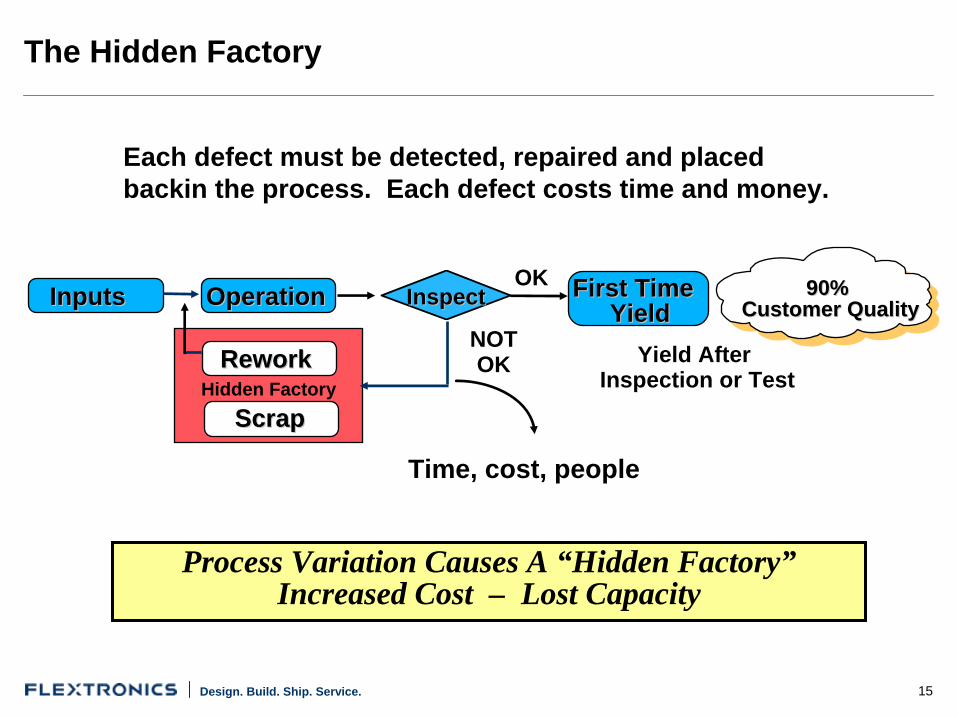
Process Variation Causes A “Hidden Factory” Increased Cost – Lost Capacity
Each defect must be detected, repaired and placed backin the process. Each defect costs time and money.
Yield After Inspection or Test
ScrapScrap
ReworkReworkHidden Factory
NOT OK
OperationOperationInputsInputs InspectInspect First Time First Time YieldYield
OK
Time, cost, people
90% 90% Customer QualityCustomer Quality
The Hidden Factory
16Design. Build. Ship. Service.
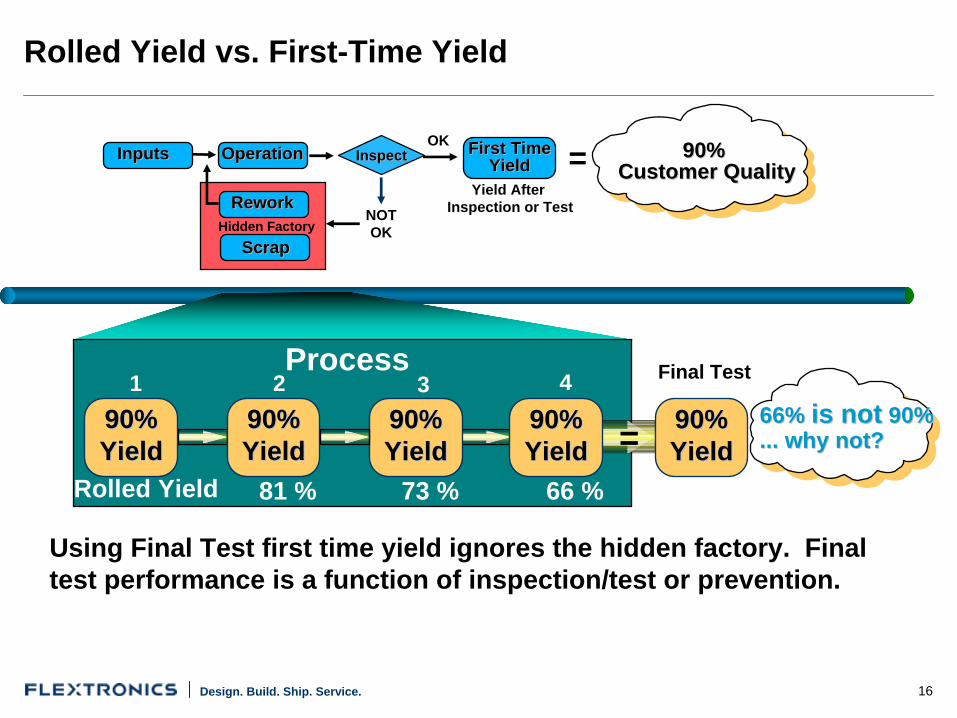
66% 66% is notis not 90% 90% ... why not?... why not?
ScrapScrap
90% 90% Customer QualityCustomer Quality
ReworkReworkHidden Factory
NOT OK
Yield After Inspection or Test
OperationOperationInputsInputs InspectInspect First TimeFirst Time YieldYield =
OK
Process1 2 3
Rolled Yield 81 % 73 %
4
66 %
Final Test
=90%90% YieldYield
90%90% YieldYield
90%90% YieldYield
90%90% YieldYield
90%90% YieldYield
Using Final Test first time yield ignores the hidden factory. Final test performance is a function of inspection/test or prevention.
Rolled Yield vs. First-Time Yield
17Design. Build. Ship. Service.
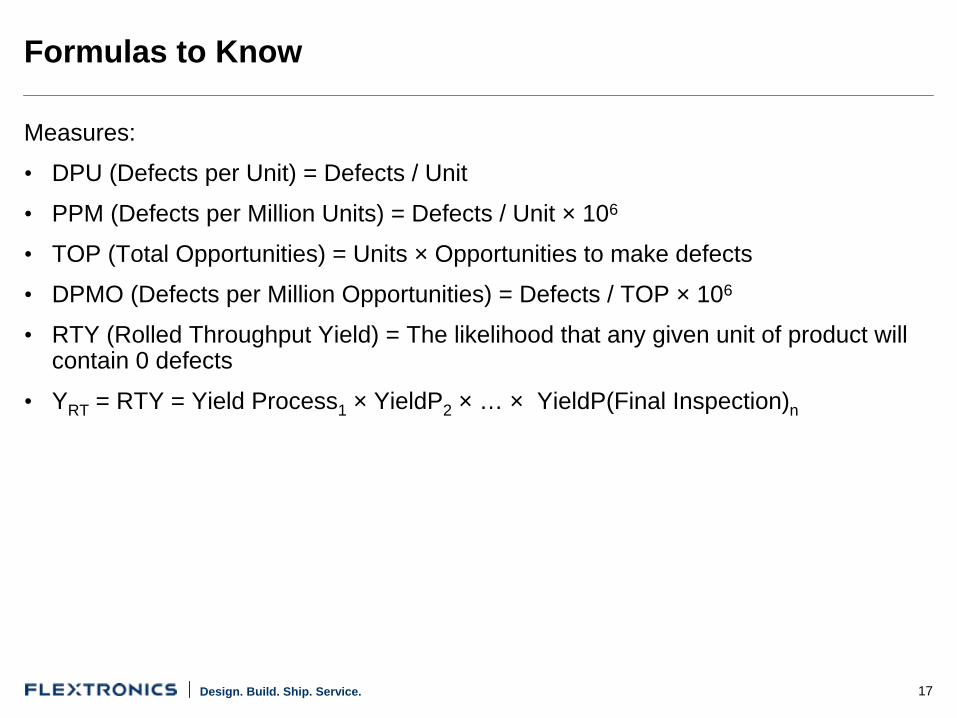
Formulas to Know
Measures:
• DPU (Defects per Unit) = Defects / Unit
• PPM (Defects per Million Units) = Defects / Unit × 106
• TOP (Total Opportunities) = Units × Opportunities to make defects
• DPMO (Defects per Million Opportunities) = Defects / TOP × 106
• RTY (Rolled Throughput Yield) = The likelihood that any given unit of product will contain 0 defects
• YRT = RTY = Yield Process1 × YieldP2 × … × YieldP(Final Inspection)n
18Design. Build. Ship. Service.
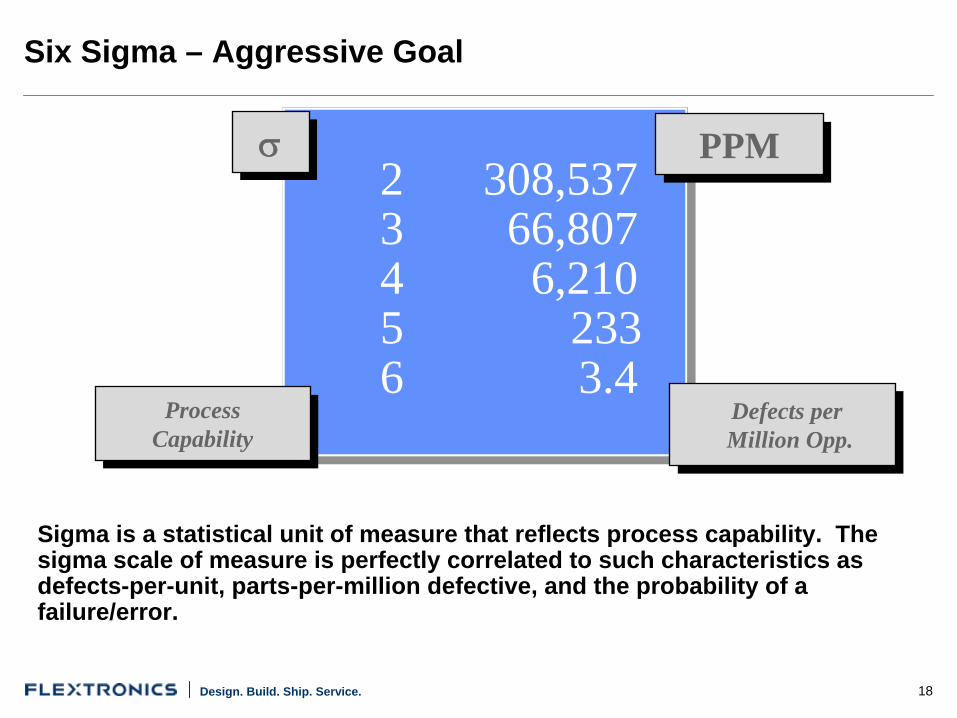
Sigma is a statistical unit of measure that reflects process capability. The sigma scale of measure is perfectly correlated to such characteristics as defects-per-unit, parts-per-million defective, and the probability of a failure/error.
2 308,5373 66,8074 6,2105 2336 3.4
PPMPPM
ProcessCapabilityProcess
CapabilityDefects perMillion Opp.
Six Sigma – Aggressive Goal
19Design. Build. Ship. Service.
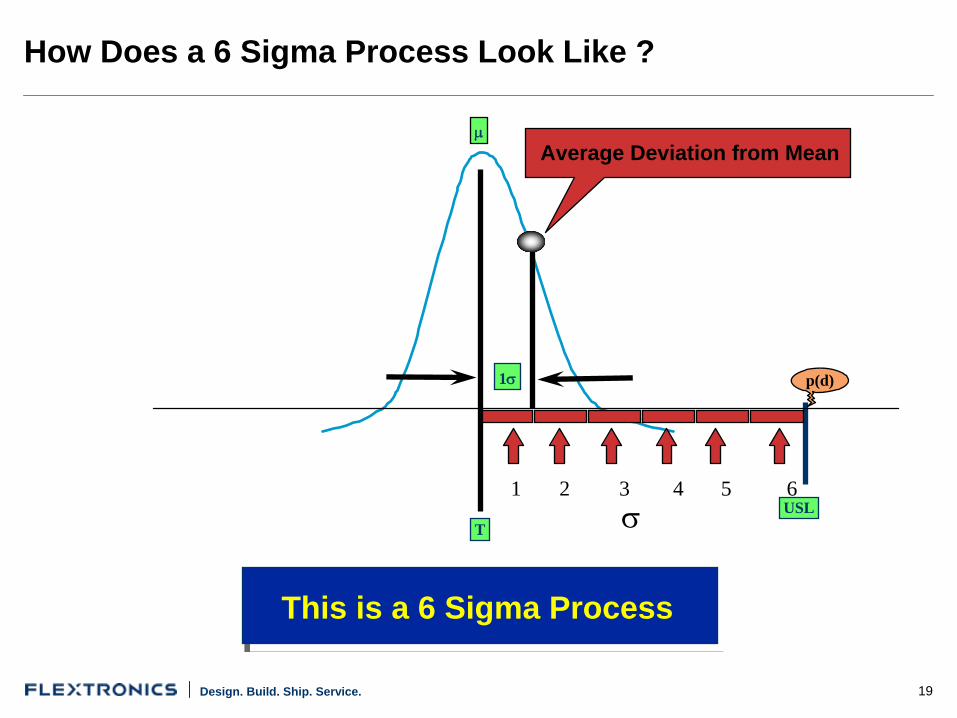
How Does a 6 Sigma Process Look Like ?
Average Deviation from Mean
1
TUSL
p(d)
p(d)
1 2 3 4 5 6
33
This is a 6 Sigma Process
20Design. Build. Ship. Service.
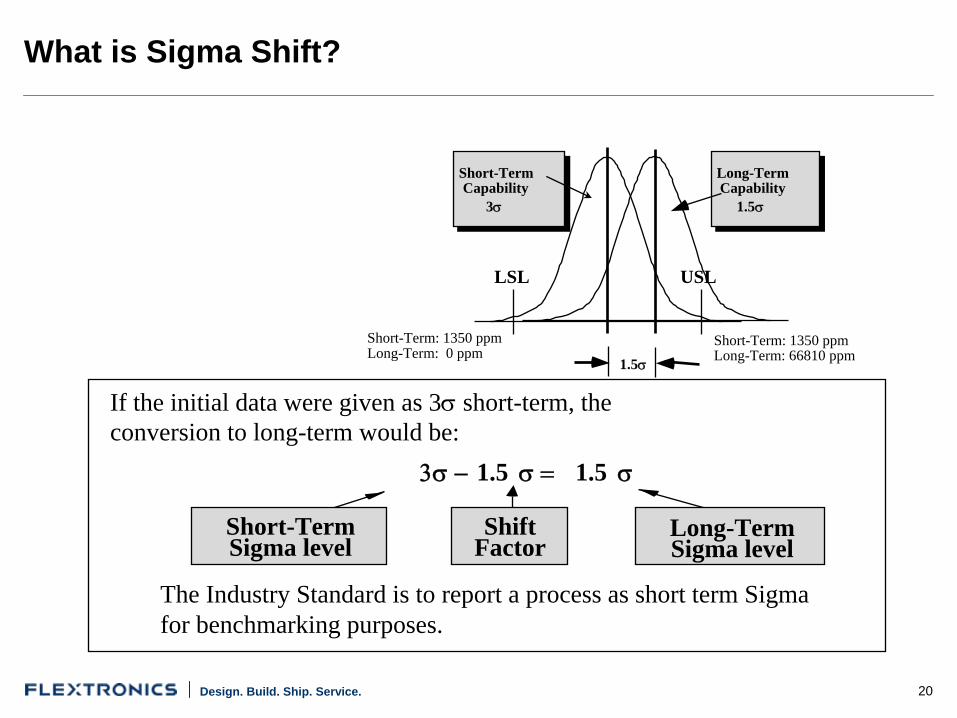
If the initial data were given as 3
short-term, the conversion to long-term would be:
The Industry Standard is to report a process as short term Sigma for benchmarking purposes.
1.5 1.5
Short-TermSigma level
ShiftFactor
Long-TermSigma level
LSL USL
Short-Term: 1350 ppmLong-Term: 66810 ppm1.5
Short-TermCapability
3
Long-TermCapability
1.5
Short-Term: 1350 ppmLong-Term: 0 ppm
What is Sigma Shift?
21Design. Build. Ship. Service.
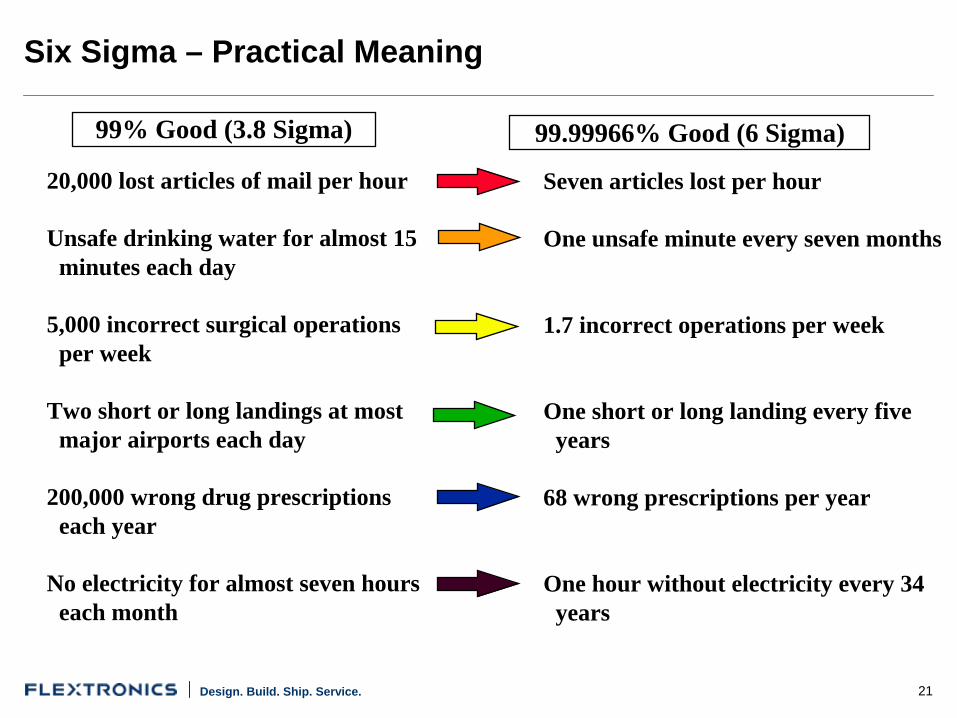
99.99966% Good (6 Sigma)
20,000 lost articles of mail per hour
Unsafe drinking water for almost 15 minutes each day
5,000 incorrect surgical operations per week
Two short or long landings at most major airports each day
200,000 wrong drug prescriptions each year
No electricity for almost seven hours each month
Seven articles lost per hour
One unsafe minute every seven months
1.7 incorrect operations per week
One short or long landing every five years
68 wrong prescriptions per year
One hour without electricity every 34 years
99% Good (3.8 Sigma)
Six Sigma – Practical Meaning
22Design. Build. Ship. Service.
- - - - - - - - - - - - - - - - - - - - - - - - - - - - - - - - - -
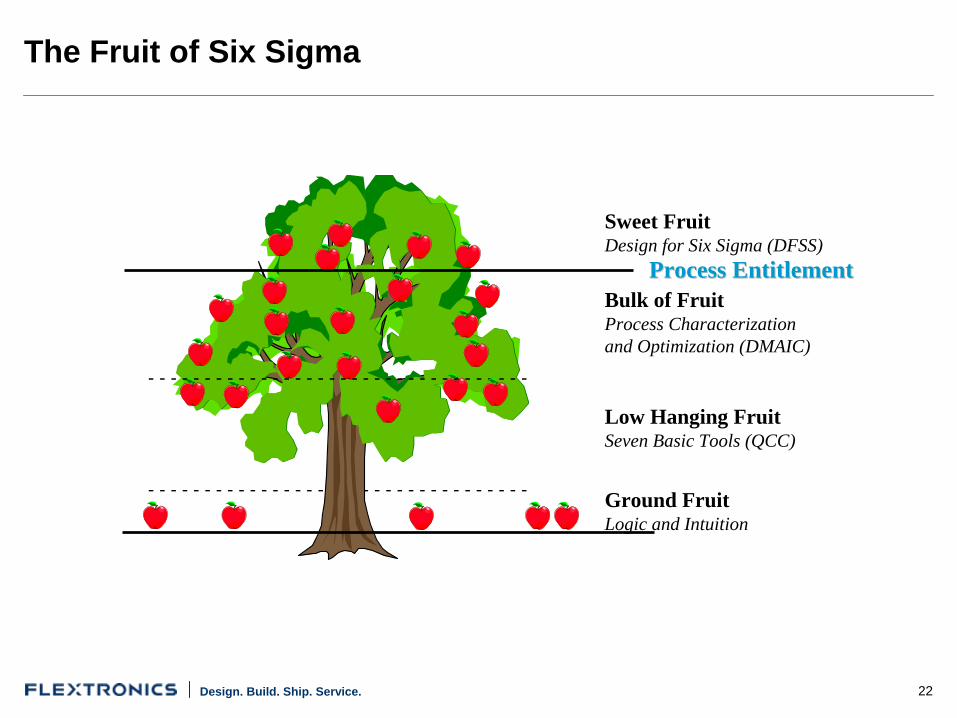
Sweet FruitDesign for Six Sigma (DFSS)
Bulk of FruitProcess Characterization and Optimization (DMAIC)
Low Hanging FruitSeven Basic Tools (QCC)
Ground FruitLogic and Intuition
Process EntitlementProcess Entitlement
- - - - - - - - - - - - - - - - - - - - - - - - - - - - - - - - - -
The Fruit of Six Sigma
23Design. Build. Ship. Service.
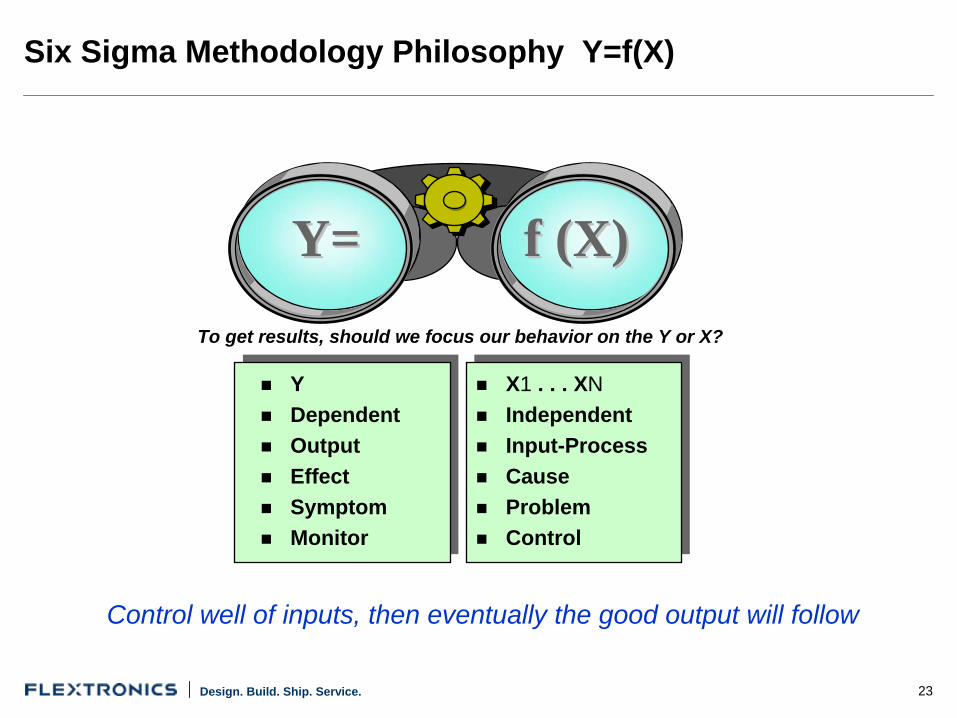
Y
Dependent
Output
Effect
Symptom
Monitor
X1 . . . XN
Independent
Input-Process
Cause
Problem
Control
f (X)f (X)Y=Y=To get results, should we focus our behavior on the Y or X?
Control well of inputs, then eventually the good output will follow
Six Sigma Methodology Philosophy Y=f(X)
24Design. Build. Ship. Service.
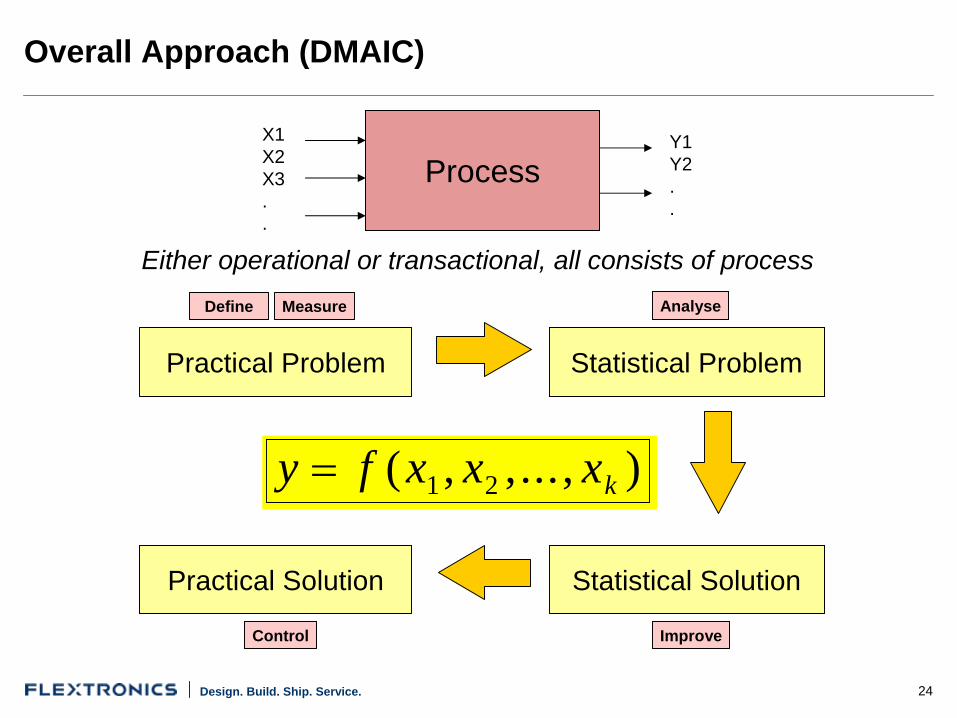
ProcessX1X2X3..
Y1Y2..
Either operational or transactional, all consists of process
y f x x xk ( , ,... , )1 2
Practical Problem
Measure
Statistical Problem
Analyse
Statistical Problem
Analyse
Statistical Solution
Improve
Statistical Solution
Improve
Practical Solution
Control
Practical Solution
Control
Define
Overall Approach (DMAIC)
25Design. Build. Ship. Service.
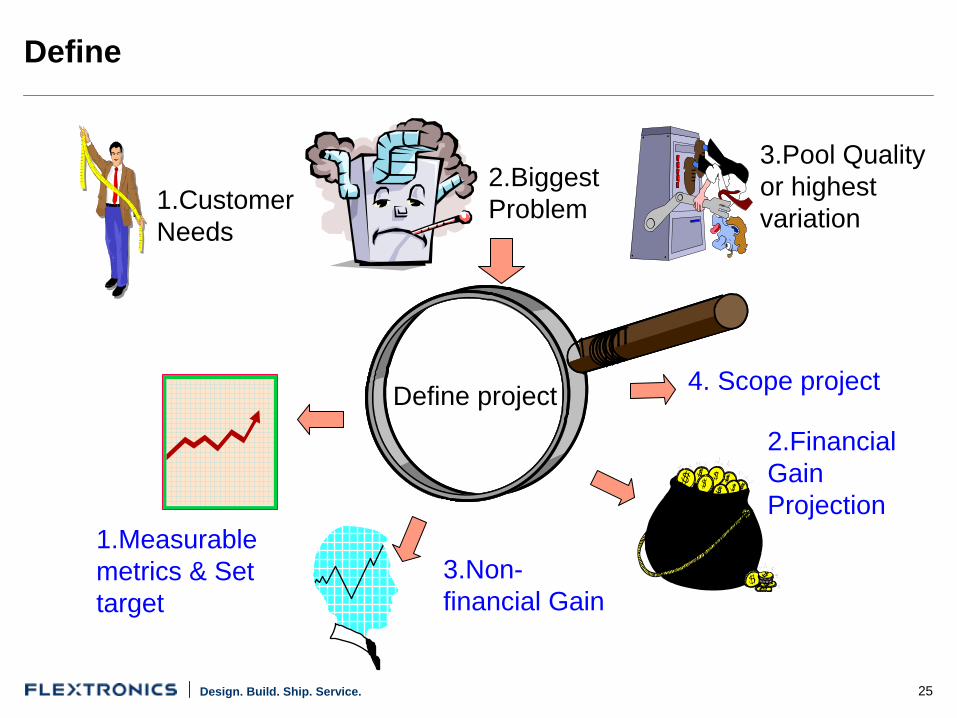
1.Customer Needs
2.Biggest Problem
3.Pool Quality or highest variation
Define project
2.Financial Gain Projection
1.Measurable metrics & Set target
3.Non- financial Gain
4. Scope project
Define
26Design. Build. Ship. Service.
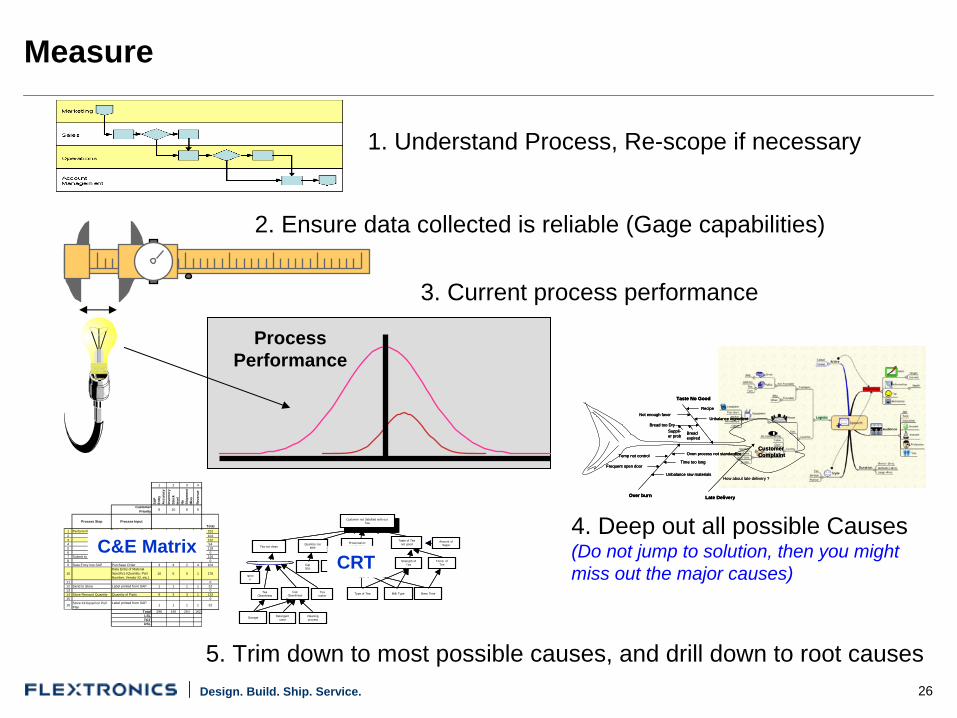
Process Performance
3. Current process performance
2. Ensure data collected is reliable (Gage capabilities)
1. Understand Process, Re-scope if necessary
Late Delivery
Taste No Good
Over burn
Customer Complaint
Recipe
Unbalance ingredientNot enough favor
Bread too Dry
Bread expired
Suppli-er prob
Oven process not standardize
Time too long
Unbalance raw materials
Temp not control
Frequent open door
How about late delivery ?
Late DeliveryLate Delivery
Taste No GoodTaste No Good
Over burnOver burn
Customer Complaint
Recipe
Unbalance ingredientNot enough favor
Bread too Dry
Recipe
Unbalance ingredientNot enough favor
Bread too Dry
Bread expired
Suppli-er prob
Bread expired
Suppli-er prob
Oven process not standardize
Time too long
Unbalance raw materials
Temp not control
Frequent open door
Oven process not standardize
Time too long
Unbalance raw materials
Temp not control
Frequent open door
How about late delivery ?
4. Deep out all possible Causes(Do not jump to solution, then you might miss out the major causes)
1 2 3 4
SAP
Entr
y A
ccur
acy
Inve
ntor
y St
ock
leve
lN
o Sh
ipm
ent
Mis
s
Rev
enue
Customer Priority 8 10 8 6
Process Step Process InputTotal
1 Perform Receiving Delivery Plan Local Parts 2 8 4 4 1522 Purchase Order 3 4 2 4 1043 Day & Time of Delivery 2 6 4 4 1324 Bill of Materials 6 0 0 1 545 Material 0 6 5 3 1186 07 Submit to IQC Quality Plan 0 6 6 3 1268 09 Data Entry into SAP Purchase Order 3 4 2 4 104
10Data Entry of Material Specifics (Quantity, Part Number, Vendor ID, etc.)
10 5 5 1 176
11 012 Send to Store Label printed from SAP 1 1 1 1 3213 014 Store Recount Quantity Quantity of Parts 9 3 3 1 13215 0
16 Store Kit based on Pull Plan
Label printed from SAP1 1 1 1 32
Total 296 440 264 162LSLTGTUSL
5. Trim down to most possible causes, and drill down to root causes
C&E MatrixCup Size
Customer not Satisfied with our Tea
Customer not Satisfied with our Tea
Brew TimeType of Tea Milk Type
Amount of Sugar
Strength of Tea
Temp. of TeaColor of
TeaCup
Design
Cup Cleanliness
Tea Cleanliness
Cleaning process
Detergent used
Storage
Tea maker
spoon
Quantity too littleTea not clean
Taste of Tea not goodPresentation
not attractive
Cup Size
Customer not Satisfied with our Tea
Customer not Satisfied with our Tea
Brew TimeType of Tea Milk Type
Amount of Sugar
Strength of Tea
Temp. of TeaColor of
TeaCup
Design
Cup Cleanliness
Tea Cleanliness
Cleaning process
Detergent used
Storage
Tea maker
spoon
Quantity too littleTea not clean
Taste of Tea not goodPresentation
not attractive
CRT
Measure
27Design. Build. Ship. Service.
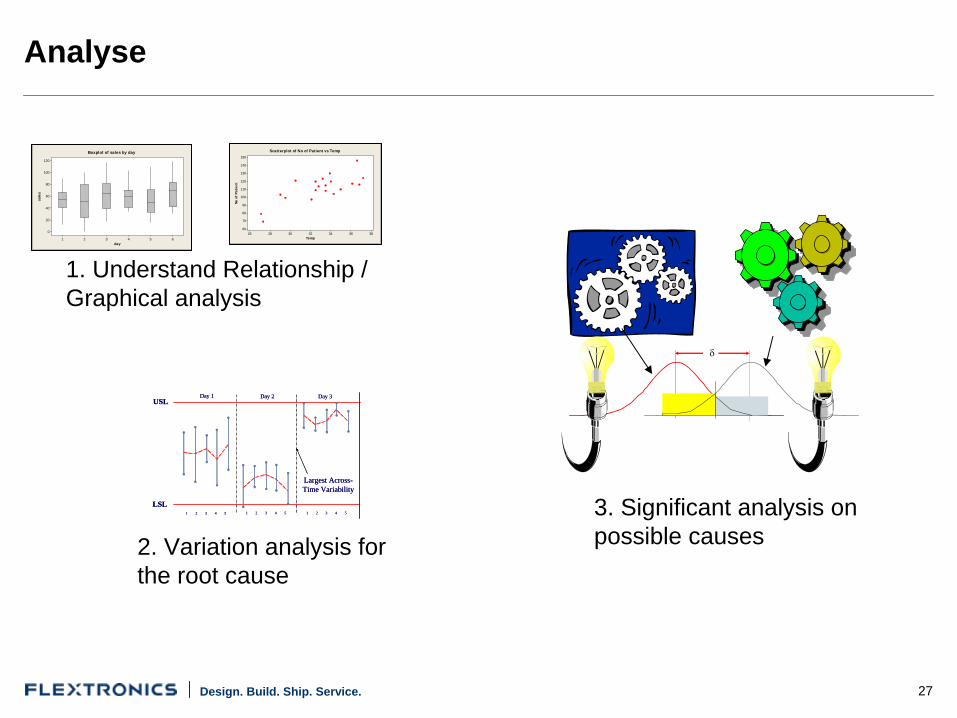
1. Understand Relationship / Graphical analysis
day
sale
s
654321
120
100
80
60
40
20
0
Boxplot of sales by day
TempNo
of
Pati
ent
38363432302826
150
140
130
120
110
100
90
80
70
60
Scatterplot of No of Patient vs Temp
3. Significant analysis on possible causes
USL
LSL1 2 3 4 5
Largest Across-Time Variability
1 2 3 4 5 1 2 3 4 5
Day 1 Day 2 Day 3USL
LSL1 2 3 4 5
Largest Across-Time Variability
1 2 3 4 5 1 2 3 4 5
Day 1 Day 2 Day 3
2. Variation analysis for the root cause
Analyse
28Design. Build. Ship. Service.
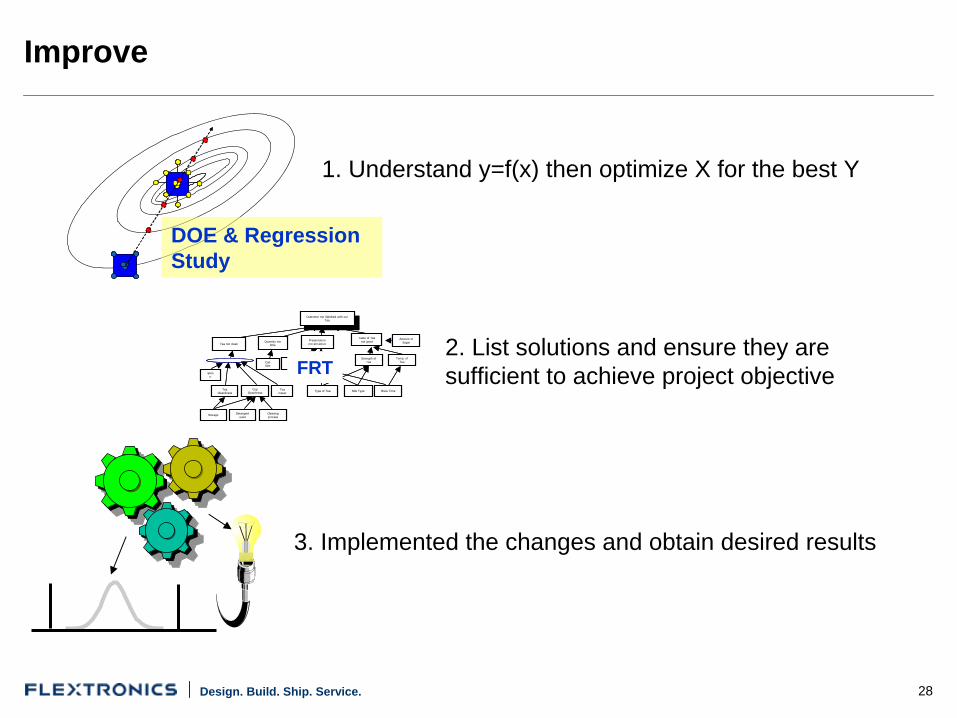
1. Understand y=f(x) then optimize X for the best Y
3. Implemented the changes and obtain desired results
DOE & Regression Study
Cup Size
Customer not Satisfied with our Tea
Customer not Satisfied with our Tea
Brew TimeType of Tea Milk Type
Amount of Sugar
Strength of Tea
Temp. of TeaColor of
TeaCup
Design
Cup Cleanliness
Tea Cleanliness
Cleaning process
Detergent used
Storage
Tea maker
spoon
Quantity too littleTea not clean
Taste of Tea not goodPresentation
not attractive
FRT2. List solutions and ensure they are sufficient to achieve project objective
Improve
29Design. Build. Ship. Service.
Report Name Reporting Period From ToOrganization Baseline Period From ToProject Improveme nt GoalDepartment Unit DefinitionDeliverable CharacteristicDeliverable ID Units of MeasureProcess Upper SpecificationStep Target ValueMachine ID Lower SpecificationSpecial Note Default Shift 1.50
Line Charact eri stic D U OP TOP DPU DPO DPMO Shi ft Z.B1 Type A 10 860 42 36,120 0.012 0.0003 277 1.50 4.952 Type B 56 698 95 66,310 0.080 0.0008 845 1.50 4.643 Type C 56 299 65 19,435 0.187 0.0029 2,881 1.50 4.264 Type D 24 257 66 16,962 0.093 0.0014 1,415 1.50 4.495 Type E 54 182 63 11,466 0.297 0.0047 4,710 1.50 4.106 Type F 13 133 37 4,921 0.098 0.0026 2,642 1.50 4.29
7 Type G 58 736 48 35,328 0.079 0.0016 1,642 1.50 4.448 Type H 45 540 45 24,300 0.083 0.0019 1,852 1.50 4.409 Type I 67 952 49 46,648 0.070 0.0014 1,436 1.50 4.48
10 Type J 54 985 43 42,355 0.055 0.0013 1,275 1.50 4.5211 Type K 8 991 38 37,658 0.008 0.0002 212 1.50 5.0212 Type L 71 987 13 12,831 0.072 0.0055 5,533 1.50 4.0413 Type M 39 2 66 132 19.500 0.2955 295,455 1.50 2.0414 Type N 16 724 38 27,512 0.022 0.0006 582 1.50 4.7515 Type O 49 702 62 43,524 0.070 0.0011 1,126 1.50 4.5616 Type P 89 385 62 23,870 0.231 0.0037 3,729 1.50 4.1817 Type Q 89 413 35 14,455 0.215 0.0062 6,157 1.50 4.0018 Type R 8 430 83 35,690 0.019 0.0002 224 1.50 5.0119 Type S 63 864 98 84,672 0.073 0.0007 744 1.50 4.6820 Type T 59 493 35 17,255 0.120 0.0034 3,419 1.50 4.20
Grand = 928 601,444 0.0015 1,543 1.50 4.46
Report Name Reporting Period From ToOrganization Baseline Period From ToProject Improveme nt GoalDepartment Unit DefinitionDeliverable CharacteristicDeliverable ID Units of MeasureProcess Upper SpecificationStep Target ValueMachine ID Lower SpecificationSpecial Note Default Shift 1.50
Line Charact eri stic D U OP TOP DPU DPO DPMO Shi ft Z.B1 Type A 10 860 42 36,120 0.012 0.0003 277 1.50 4.952 Type B 56 698 95 66,310 0.080 0.0008 845 1.50 4.643 Type C 56 299 65 19,435 0.187 0.0029 2,881 1.50 4.264 Type D 24 257 66 16,962 0.093 0.0014 1,415 1.50 4.495 Type E 54 182 63 11,466 0.297 0.0047 4,710 1.50 4.106 Type F 13 133 37 4,921 0.098 0.0026 2,642 1.50 4.297 Type G 58 736 48 35,328 0.079 0.0016 1,642 1.50 4.448 Type H 45 540 45 24,300 0.083 0.0019 1,852 1.50 4.409 Type I 67 952 49 46,648 0.070 0.0014 1,436 1.50 4.4810 Type J 54 985 43 42,355 0.055 0.0013 1,275 1.50 4.5211 Type K 8 991 38 37,658 0.008 0.0002 212 1.50 5.0212 Type L 71 987 13 12,831 0.072 0.0055 5,533 1.50 4.0413 Type M 39 2 66 132 19.500 0.2955 295,455 1.50 2.0414 Type N 16 724 38 27,512 0.022 0.0006 582 1.50 4.7515 Type O 49 702 62 43,524 0.070 0.0011 1,126 1.50 4.5616 Type P 89 385 62 23,870 0.231 0.0037 3,729 1.50 4.1817 Type Q 89 413 35 14,455 0.215 0.0062 6,157 1.50 4.0018 Type R 8 430 83 35,690 0.019 0.0002 224 1.50 5.0119 Type S 63 864 98 84,672 0.073 0.0007 744 1.50 4.6820 Type T 59 493 35 17,255 0.120 0.0034 3,419 1.50 4.20
Grand = 928 601,444 0.0015 1,543 1.50 4.46
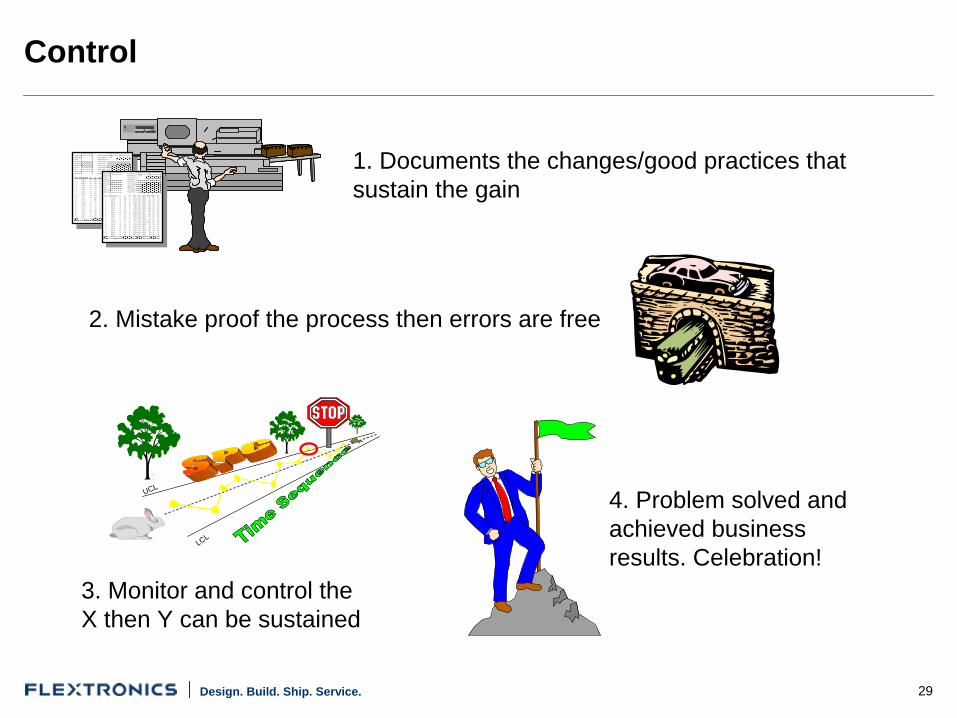
1. Documents the changes/good practices that sustain the gain
2. Mistake proof the process then errors are free
UCL
LCL
3. Monitor and control the X then Y can be sustained
4. Problem solved and achieved business results. Celebration!
Control
30Design. Build. Ship. Service.
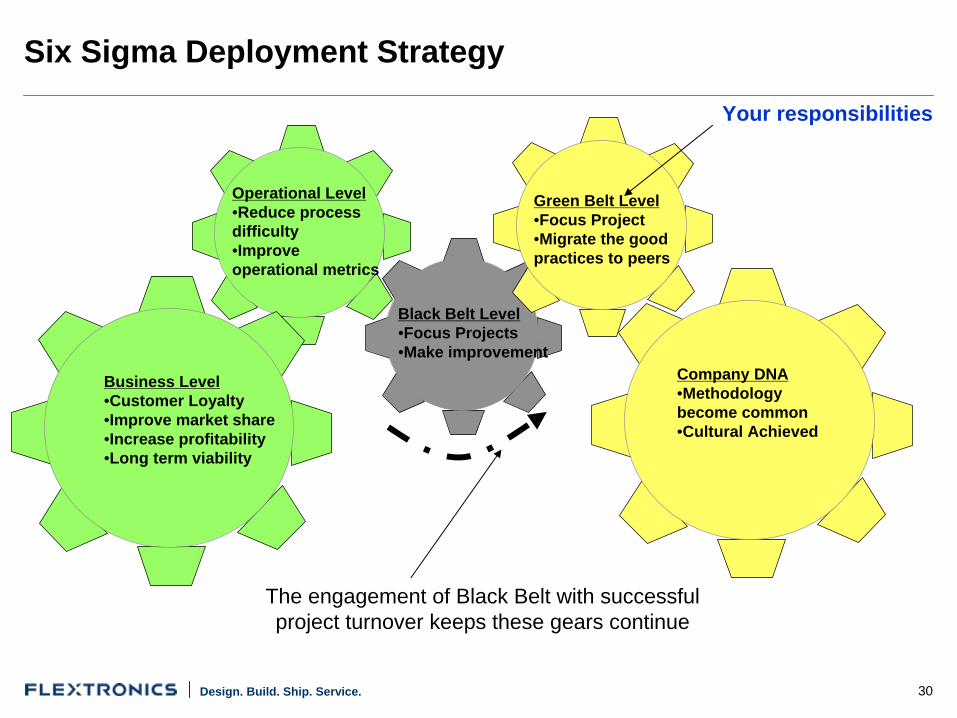
Six Sigma Deployment Strategy
Black Belt Level•Focus Projects•Make improvement
Operational Level•Reduce process difficulty•Improve operational metrics
Business Level•Customer Loyalty•Improve market share•Increase profitability•Long term viability
Green Belt Level•Focus Project•Migrate the good practices to peers
Company DNA•Methodology become common•Cultural Achieved
The engagement of Black Belt with successful project turnover keeps these gears continue
Your responsibilities
31Design. Build. Ship. Service.
Six Sigma Strategy in Line with Company Vision
32Design. Build. Ship. Service.
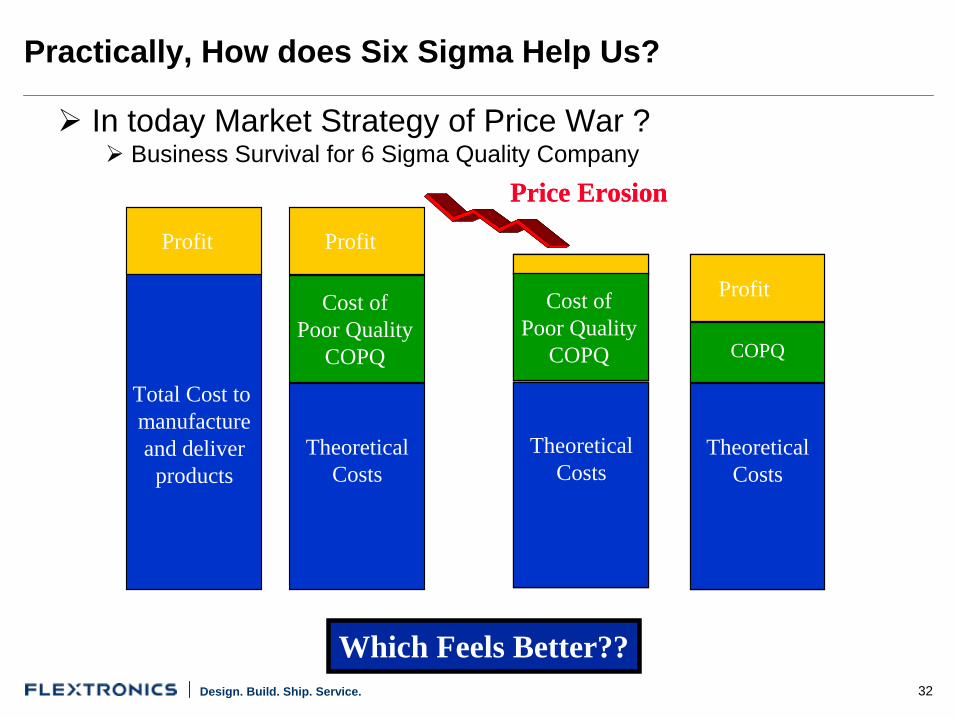
Practically, How does Six Sigma Help Us?
In today Market Strategy of Price War ? Business Survival for 6 Sigma Quality Company
Profit
Total Cost to manufactureand deliver
products
Profit
TheoreticalCosts
Cost ofPoor Quality
COPQ
Price Erosion
TheoreticalCosts
Cost ofPoor Quality
COPQ
Price Erosion
TheoreticalCosts
Cost ofPoor Quality
COPQ
TheoreticalCosts
Cost ofPoor Quality
COPQ
Profit
TheoreticalCosts
COPQ
Profit
TheoreticalCosts
COPQ
Which Feels Better??
33Design. Build. Ship. Service.
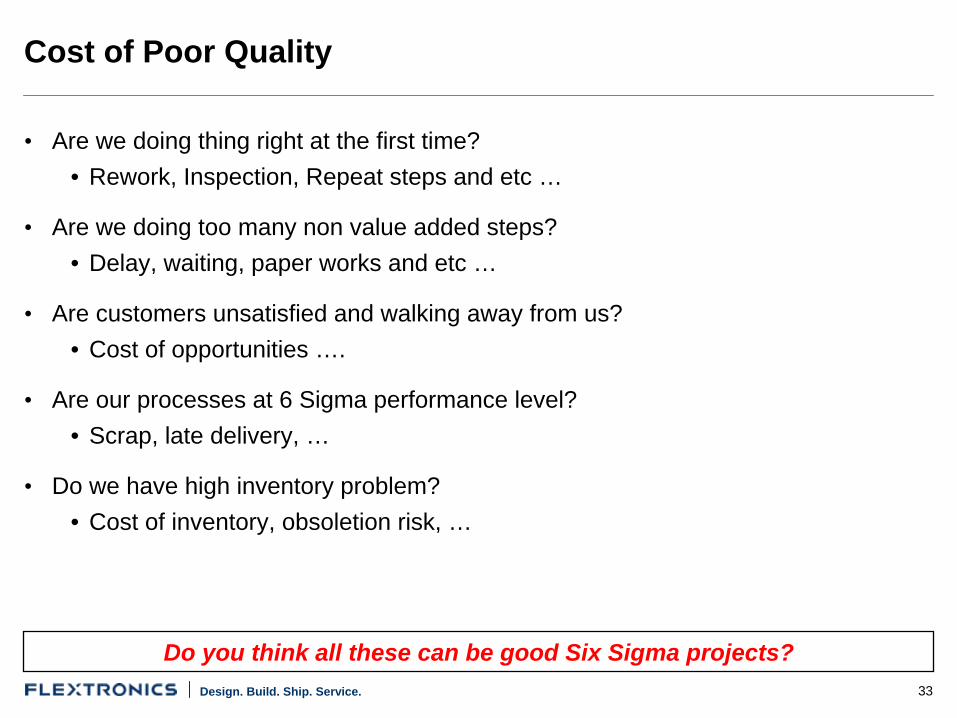
Cost of Poor Quality
• Are we doing thing right at the first time?• Rework, Inspection, Repeat steps and etc …
• Are we doing too many non value added steps?• Delay, waiting, paper works and etc …
• Are customers unsatisfied and walking away from us?• Cost of opportunities ….
• Are our processes at 6 Sigma performance level?• Scrap, late delivery, …
• Do we have high inventory problem?• Cost of inventory, obsoletion risk, …
Do you think all these can be good Six Sigma projects?
34Design. Build. Ship. Service.
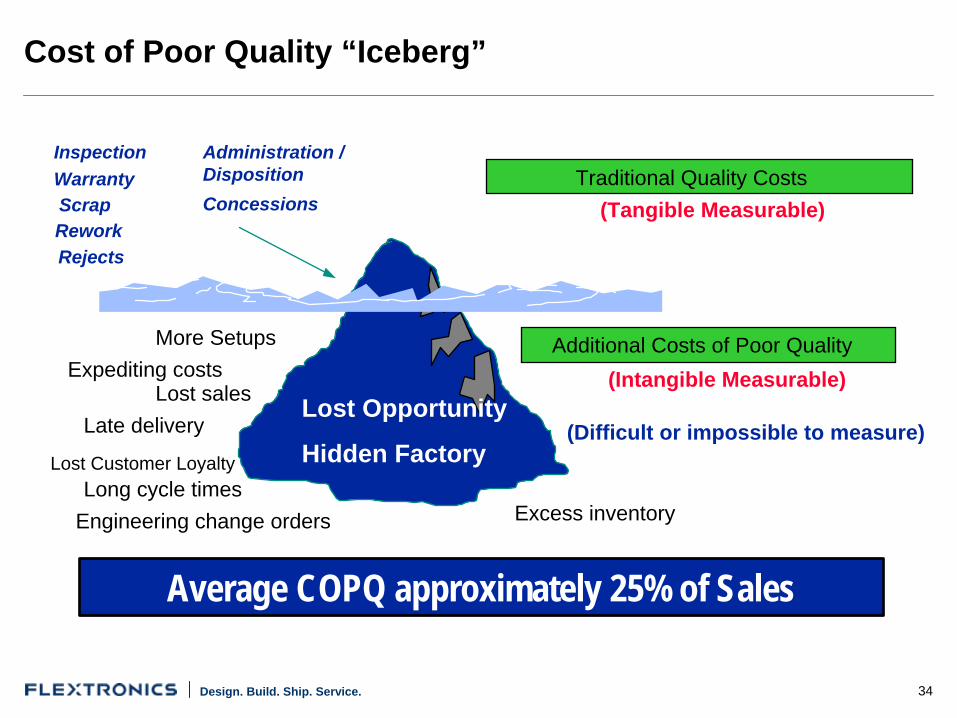
Cost of Poor Quality “Iceberg”
Engineering change orders
Traditional Quality Costs
Lost Opportunity
Hidden Factory
Lost salesLate delivery
Long cycle times
Expediting costs
Excess inventory
Additional Costs of Poor Quality(Intangible Measurable)
(Tangible Measurable)
(Difficult or impossible to measure)Lost Customer Loyalty
More Setups
ScrapRework
InspectionWarranty
Rejects
Administration / DispositionConcessions
Average COPQ approximately 25% of Sales
35Design. Build. Ship. Service.
Summary
• Six Sigma is more than just a statistical measure – it is a strategy and a cultural shift.
• Six Themes of 6 Sigma• Genuine Focus on Customer• Data and Fact Driven Management• Process Focus, Management and Improvement• Proactive Management• Boundary-less Collaboration• Drive for Perfection
Design. Build. Ship. Service. 36
Six Sigma Operational Green Belt Training
FSG-S-M01
Introduction to Six Sigma
Appendix: Terms and Definitions
37Design. Build. Ship. Service.
Six Sigma Terms and Definitions
1. Customer• Any “one” who receives a product, service or information from an operation or
process.• The term is frequently used to describe “External” customers – those who
purchase the manufactured products or services which are the basis for the existence of the business. However, “Internal” customers, also important, are internal “persons” who receive the intermediate or internal products or services from internal “Suppliers”.
2. CTQ• Critical to Quality Characteristic – a characteristic of a product, service or
information which is important to the customer. CTQs must be measurable in either a “continuous-scale” manner (e.g. 3.02 mg, etc) or a descriptive manner (correct/incorrect, etc).
38Design. Build. Ship. Service.
Six Sigma Terms and Definitions (cont)
3. Opportunity• Any event which generates an output (product, service or information).
4. Unit• A discrete item (lamp, invoice, etc) which possesses one or more CTQ (note:
units must be considered with regard for the specific CTQ(s) of concern by a customer and/or for a specific process)
5. Defect• Any output of an opportunity which does not meet a defined specification:
OR a failure to meet an imposed requirement on a single quality characteristic or a single instance of non-conformance to the specification.
6. DPU• Defects per Unit – the number of defects counted, divided by the number of
“products” or “characteristics” (units) produced.
39Design. Build. Ship. Service.
Six Sigma Terms and Definitions (cont)
7. DPMO• Defects per Million Opportunities – the number of defects counted, divided
by the actual number of opportunities to generate the defect, multiplied by one million.
8. COPQ• Cost of Poor Quality – the cost incurred from generating a defect
OR Cost which would be avoided if, rather than a “defect”, the “opportunity” yielded a “success”.
9. KPIV• Key Process INPUT Variable – an independent material or element, with
descriptive characteristic(s), which is either an object (going into) or a parameter of a process (step) and which has a significant (key) effect on the output of the process.
40Design. Build. Ship. Service.
Six Sigma Terms and Definitions (cont)
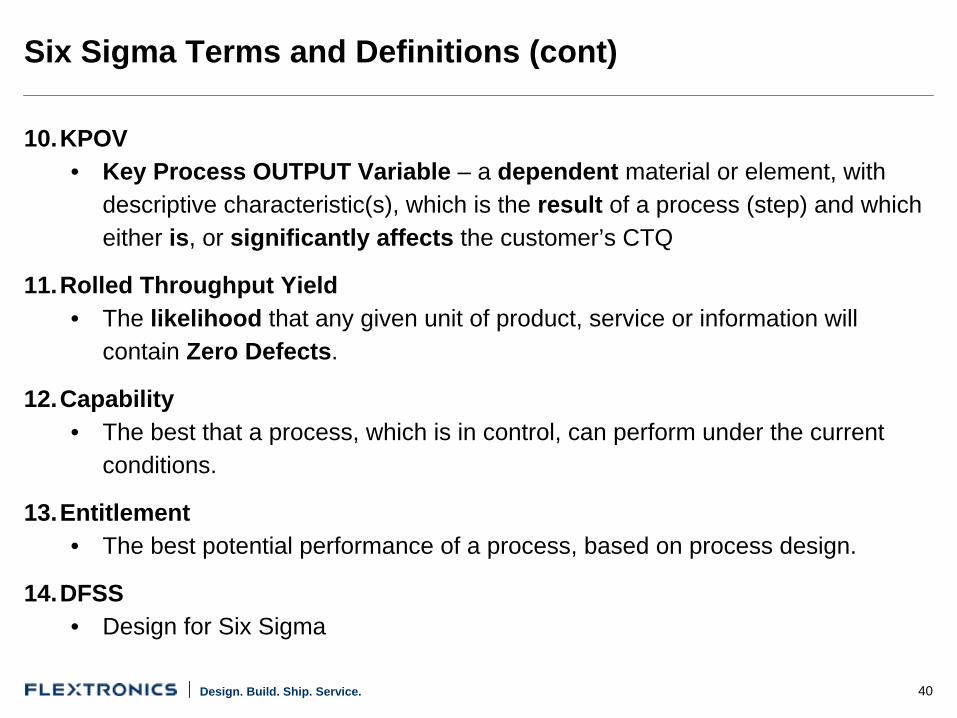
10.KPOV• Key Process OUTPUT Variable – a dependent material or element, with
descriptive characteristic(s), which is the result of a process (step) and which either is, or significantly affects the customer’s CTQ
11.Rolled Throughput Yield• The likelihood that any given unit of product, service or information will
contain Zero Defects.
12.Capability• The best that a process, which is in control, can perform under the current
conditions.
13.Entitlement• The best potential performance of a process, based on process design.
14.DFSS• Design for Six Sigma
Design. Build. Ship. Service. 41
Thank You
You can now close the browser to exit the course
Download Course file


![Introduction to Six Sigma[1]](https://img.pdfslide.us/doc/110x75/577cdeb21a28ab9e78afa1f5/introduction-to-six-sigma1.jpg)