Embed Size (px)
Citation preview
1
C H A P T E R
1Introduction to SAS Enterprise
Miner 5.3 Software
Data Mining Overview 1Layout of the Enterprise Miner Window 2
About the Graphical Interface 2
Enterprise Miner Menus 4
Diagram Workspace Pop-up Menus 8
Organization and Uses of Enterprise Miner Nodes 8About Nodes 8
Sample Nodes 9
Explore Nodes 11
Modify Nodes 13
Model Nodes 15
Assess Nodes 17Utility Nodes 18
Usage Rules for Nodes 19
Overview of the SAS Enterprise Miner 5.3 Getting Started Example 19
Example Problem Description 20
Software Requirements 22
Data Mining OverviewSAS defines data mining as the process of uncovering hidden patterns in large
amounts of data. Many industries use data mining to address business problems andopportunities such as fraud detection, risk and affinity analyses, database marketing,householding, customer churn, bankruptcy prediction, and portfolio analysis.The SASdata mining process is summarized in the acronym SEMMA, which stands forsampling, exploring, modifying, modeling, and assessing data.
� Sample the data by creating one or more data tables. The sample should be largeenough to contain the significant information, yet small enough to process.
� Explore the data by searching for anticipated relationships, unanticipated trends,and anomalies in order to gain understanding and ideas.
� Modify the data by creating, selecting, and transforming the variables to focus themodel selection process.
� Model the data by using the analytical tools to search for a combination of thedata that reliably predicts a desired outcome.
� Assess the data by evaluating the usefulness and reliability of the findings fromthe data mining process.
You might not include all of these steps in your analysis, and it might be necessary torepeat one or more of the steps several times before you are satisfied with the results.

2 Layout of the Enterprise Miner Window � Chapter 1
After you have completed the assessment phase of the SEMMA process, you apply thescoring formula from one or more champion models to new data that might or might notcontain the target. The goal of most data mining tasks is to apply models that areconstructed using training and validation data in order to make accurate predictionsabout observations of new, raw data.
The SEMMA data mining process is driven by a process flow diagram, which you canmodify and save. The Graphical User Interface is designed in such a way that thebusiness analyst who has little statistical expertise can navigate through the datamining methodology, while the quantitative expert can go “behind the scenes” tofine-tune the analytical process.
SAS Enterprise Miner 5.3 contains a collection of sophisticated analysis tools thathave a common user-friendly interface that you can use to create and compare multiplemodels. Analytical tools include clustering, association and sequence discovery, marketbasket analysis, path analysis, self-organizing maps / Kohonen, variable selection,decision trees and gradient boosting, linear and logistic regression, two stage modeling,partial least squares, support vector machines, and neural networking. Datapreparation tools include outlier detection, variable transformations, variableclustering, interactive binning, principal components, rule building and induction, dataimputation, random sampling, and the partitioning of data sets (into train, test, andvalidate data sets). Advanced visualization tools enable you to quickly and easilyexamine large amounts of data in multidimensional histograms and to graphicallycompare modeling results.
Enterprise Miner is designed for PCs or servers that are running under Windows XP,UNIX, Linux, or subsequent releases of those operating environments. The figures andscreen captures that are presented in this document were taken on a PC that wasrunning under Windows XP.
Layout of the Enterprise Miner Window
About the Graphical InterfaceYou use the Enterprise Miner graphical interface to build a process flow diagram that
controls your data mining project.Figure 1.1 shows the components of the Enterprise Miner window.

Introduction to SAS Enterprise Miner 5.3 Software � About the Graphical Interface 3
Figure 1.1 The Enterprise Miner Window
The Enterprise Miner window contains the following interface components:� Toolbar and Toolbar shortcut buttons — The Enterprise Miner Toolbar is a graphic
set of node icons that are organized by SEMMA categories. Above the Toolbar is acollection of Toolbar shortcut buttons that are commonly used to build process flowdiagrams in the Diagram Workspace. Move the mouse pointer over any node, orshortcut button to see the text name. Drag a node into the Diagram Workspace touse it. The Toolbar icon remains in place and the node in the Diagram Workspaceis ready to be connected and configured for use in your process flow diagram. Clickon a shortcut button to use it.
� Project Panel — Use the Project Panel to manage and view data sources,diagrams, model packages, and project users.
� Properties Panel — Use the Properties Panel to view and edit the settings of datasources, diagrams, nodes, and model packages.
� Diagram Workspace — Use the Diagram Workspace to build, edit, run, and saveprocess flow diagrams. This is where you graphically build, order, sequence andconnect the nodes that you use to mine your data and generate reports.
� Property Help Panel — The Property Help Panel displays a short description ofthe property that you select in the Properties Panel. Extended help can be found
4 Enterprise Miner Menus � Chapter 1
in the Help Topics selection from the Help main menu or from the Help button onmany windows.
� Status Bar — The Status Bar is a single pane at the bottom of the window thatindicates the execution status of a SAS Enterprise Miner task.
Enterprise Miner MenusHere is a summary of the Enterprise Miner menus:� File
� New� Project — creates a new project.� Diagram — creates a new diagram.� Data Source — creates a new data source using the Data Source wizard.� Library — creates a new SAS library.
� Open Project — opens an existing project. You can also create a new projectfrom the Open Project window.
� Recent Projects — lists the projects on which you were most recentlyworking. You can open recent projects using this menu item.
� Open Model Package — opens a model package SAS Package (SPK) file thatyou have previously created.
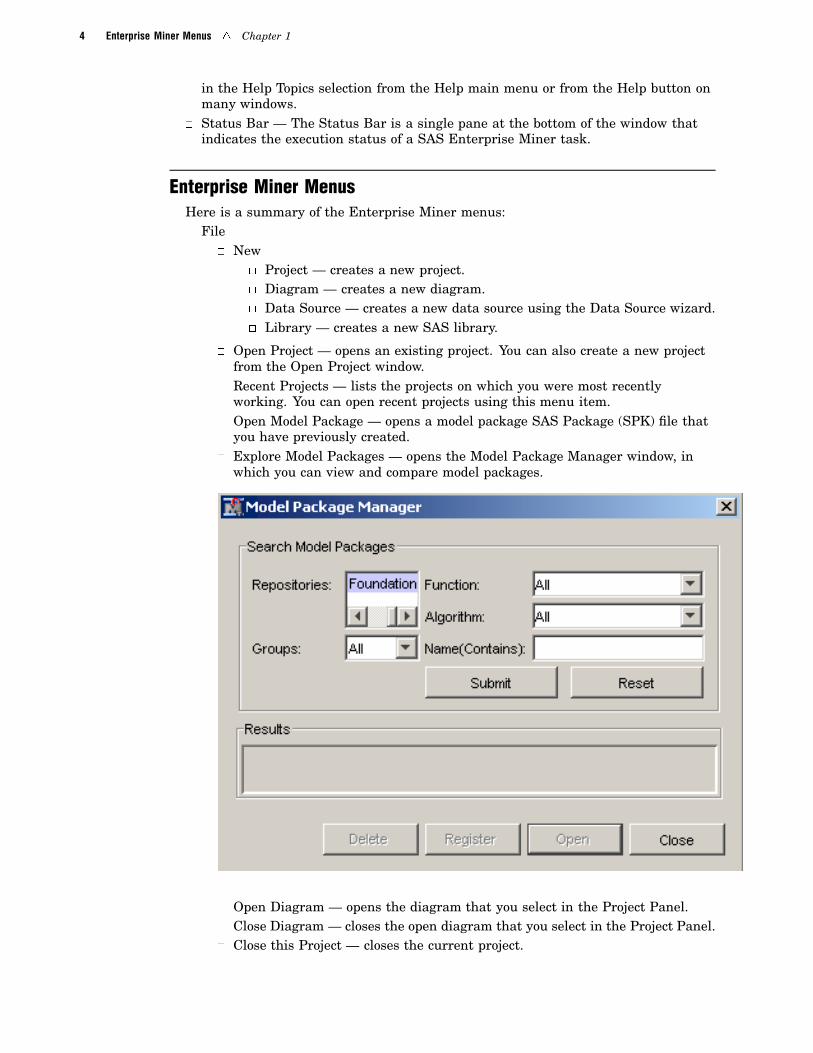
� Explore Model Packages — opens the Model Package Manager window, inwhich you can view and compare model packages.
� Open Diagram — opens the diagram that you select in the Project Panel.� Close Diagram — closes the open diagram that you select in the Project Panel.� Close this Project — closes the current project.

Introduction to SAS Enterprise Miner 5.3 Software � Enterprise Miner Menus 5
� Delete this Project — deletes the current project.� Import Diagram from XML — imports a diagram that has been defined by an
XML file.� Save Diagram As — saves a diagram as an image (BMP or GIF) or as an
XML file. You must have an open diagram and that diagram must be selectedin the Project Panel. Otherwise, this menu item appears as Save As and isdimmed and unavailable.
� Print Diagram — prints the contents of the window that is open in theDiagram Workspace. You must have an open diagram and that diagram mustbe selected in the Project Panel. Otherwise, this menu item is dimmed andunavailable.
� Print Preview — displays a preview of the Diagram Workspace that can beprinted. You must have an open diagram and that diagram must be selectedin the Project Panel. Otherwise, this menu item is dimmed and unavailable.
� Exit — ends the Enterprise Miner session and closes the window.
� Edit� Cut — deletes the selected item and copies it to the clipboard.� Copy — copies the selected node to the clipboard.� Paste — pastes a copied object from the clipboard.� Delete — deletes the selected diagram, data source, or node.� Rename — renames the selected diagram, data source, or node.� Duplicate — creates a copy of the selected data source.� Select All — selects all of the nodes in the open diagram, selects all texts in the
Program Editor, Log, or Output windows.� Clear All — clears text from the Program Editor, Log, or Output windows.� Find/Replace — opens the Find/Replace window so that you can search for and
replace text in the Program Editor, Log, and Results windows.� Go To Line — opens the Go To Line window. Enter the line number on which
you want to enter or view text.� Layout
� Horizontally — creates an orderly horizontal arrangement of the layout ofnodes that you have placed in the Diagram Workspace.
� Vertically — creates an orderly vertical arrangement of the layout of nodesthat you have placed in the Diagram Workspace.
� Zoom — increases or decreases the size of the process flow diagram within thediagram window.
� Copy Diagram to Clipboard — copies the Diagram Workspace to the clipboard.
� View� Program Editor — opens a SAS Program Editor window in which you can enter
SAS code.� Log — opens a SAS Log window.� Output — opens a SAS Output window.� Explorer — opens a window that displays the SAS libraries (and their contents)
to which Enterprise Miner has access.� Graphs — opens the Graphs window. Graphs that you create with SAS code in
the Program Editor are displayed in this window.� Refresh Project — updates the project tree to incorporate any changes that were
made to the project from outside the Enterprise Miner user interface.

6 Enterprise Miner Menus � Chapter 1
� Actions� Add Node — adds a node that you have selected to the Diagram Workspace.� Select Nodes — opens the Select Nodes window.� Connect nodes — opens the Connect Nodes window. You must select a node in
the Diagram Workspace to make this menu item available. You can connect thenode that you select to any nodes that have been placed in your DiagramWorkspace.
� Disconnect Nodes — opens the Disconnect Nodes window. You must select anode in the Diagram Workspace to make this menu item available. You candisconnect the selected node from a predecessor node or a successor node.
� Update — updates the selected node to incorporate any changes that you havemade.
� Run — runs the selected node and any predecessor nodes in the process flowthat have not been executed, or submits any code that you type in the ProgramEditor window.
� Stop Run — interrupts a currently running process flow.� View Results — opens the Results window for the selected node.� Create Model Package — generates a mining model package.� Export Path as SAS Program — saves the path that you select as a SAS
program. In the window that opens, you can specify the location to which youwant to save the file. You also specify whether you want the code to run thepath or create a model package.
� Options� Preferences — opens the Preferences window. Use the following options to
change the user interface:

Introduction to SAS Enterprise Miner 5.3 Software � Enterprise Miner Menus 7
� Look and Feel — you can select Cross Platform, which uses a standardappearance scheme that is the same on all platforms, or System which usesthe appearance scheme that you have chosen for your platform.
� Property Sheet Tooltips — controls whether tooltips are displayed on variousproperty sheets appearing throughout the user interface.
� Tools Palette Tooltips — controls how much tooltip information you wantdisplayed for the tool icons in the Toolbar.
� Sample Methods — generates a sample that will be used for graphicaldisplays. You can specify either Top or Random.
� Fetch Size — specifies the number of observations to download for graphicaldisplays. You can choose either Default or Max.
� Random Seed — specifies the value you want to use to randomly sampleobservations from your input data.
� Generate C Score Code — creates C score code when you create a report. Thedefault is No.
� Generate Java Score Code — creates Java score code when you create areport. The default is No. If you select Yes for Generate Java Score Code,you must enter a filename for the score code package in the Java Score CodePackage box.
� Java Score Code Package — identifies the filename of the Java Score Codepackage.
� Grid Processing — enables you to use grid processing when you are runningdata mining flows on grid-enabled servers.
� Window� Tile — displays windows in the Diagram Workspace so that all windows are
visible at the same time.� Cascade — displays windows in the Diagram Workspace so that windows
overlap.
� Help� Contents — opens the Enterprise Miner Help window, which enables you to
view all the Enterprise Miner Reference Help.� Component Properties — opens a table that displays the component
properties of each tool.� Generate Sample Data Sources — creates sample data sources that you can
access from the Data Sources folder.� Configuration — displays the current system configuration of your Enterprise
Miner session.� About — displays information about the version of Enterprise Miner that you
are using.

8 Diagram Workspace Pop-up Menus � Chapter 1
Diagram Workspace Pop-up MenusYou can use the Diagram Workspace pop-up menus to perform many tasks. To open
the pop-up menu, right-click in an open area of the Diagram Workspace. (Note that youcan also perform many of these tasks by using the pull-down menus.) The pop-up menucontains the following items:
� Add node — accesses the Add Node window.� Paste — pastes a node from the clipboard to the Diagram Workspace.� Select All — selects all nodes in the process flow diagram.� Select Nodes — opens a window that displays all the nodes that are on your
diagram. You can select as many as you want.� Layout — creates an orderly horizontally or vertically aligned arrangement of the
nodes in the Diagram Workspace.� Zoom — increases or decreases the size of the process flow diagram within the
diagram window by the amount that you choose.� Copy Diagram to Clipboard — copies the Diagram Workspace to the clipboard.
Organization and Uses of Enterprise Miner Nodes
About NodesThe nodes of Enterprise Miner are organized according to the Sample, Explore,
Modify, Model, and Assess (SEMMA) data mining methodology. In addition, there arealso Credit Scoring and Utility node tools. You use the Credit Scoring node tools toscore your data models and to create freestanding code. You use the Utility node toolsto submit SAS programming statements, and to define control points in the process flowdiagram.
Note: The Credit Scoring tab does not appear in all installed versions ofEnterprise Miner. �
Remember that in a data mining project, it can be an advantage to repeat parts ofthe data mining process. For example, you might want to explore and plot the data atseveral intervals throughout your project. It might be advantageous to fit models,assess the models, and then refit the models and then assess them again.
The following tables list the nodes and give each node’s primary purpose.

Introduction to SAS Enterprise Miner 5.3 Software � Sample Nodes 9
Sample Nodes
Node Name Description
Append Use the Append node to append data sets that are exported by twodifferent paths in a single process flow diagram. The Append nodecan also append train, validation, and test data sets into a newtraining data set.
Data Partition Use the Data Partition node to partition data sets into training, test,and validation data sets. The training data set is used forpreliminary model fitting. The validation data set is used to monitorand tune the model weights during estimation and is also used formodel assessment. The test data set is an additional hold-out dataset that you can use for model assessment. This node uses simplerandom sampling, stratified random sampling, or clustered samplingto create partitioned data sets. See Chapter 3.
Filter Use the Filter node to create and apply filters to your training dataset and optionally, to the validation and test data sets. You can usefilters to exclude certain observations, such as extreme outliers anderrant data that you do not want to include in your mining analysis.Filtering extreme values from the training data tends to producebetter models because the parameter estimates are more stable. Bydefault, the Filter node ignores target and rejected variables.
Input Data Source Use the Input Data Source node to access SAS data sets and othertypes of data. This node introduces a predefined Enterprise MinerData Source and metadata into a Diagram Workspace for processing.You can view metadata information about your data in the InputData Source node, such as initial values for measurement levels andmodel roles of each variable. Summary statistics are displayed forinterval and class variables. See Chapter 3.
Merge Use the Merge node to merge observations from two or more datasets into a single observation in a new data set.

10 Sample Nodes � Chapter 1
Node Name Description
Sample Use the Sample node to take random, stratified random samples,and to take cluster samples of data sets. Sampling is recommendedfor extremely large databases because it can significantly decreasemodel training time. If the random sample sufficiently represents thesource data set, then data relationships that Enterprise Miner findsin the sample can be extrapolated upon the complete source data set.The Sample node writes the sampled observations to an output dataset and saves the seed values that are used to generate the randomnumbers for the samples so that you can replicate the samples.
Time Series Use the Time Series node to convert transactional data to time seriesdata to perform seasonal and trend analysis. This node enables youto understand trends and seasonal variations in the transaction datathat you collect from your customers and suppliers over the time, byconverting transactional data into time series data. Transactionaldata is time-stamped data that is collected over time at no particularfrequency. By contrast, time series data is time-stamped data that iscollected over time at a specific frequency. The size of transactiondata can be very large, which makes traditional data mining tasksdifficult. By condensing the information into a time series, you candiscover trends and seasonal variations in customer and supplierhabits that might not be visible in transactional data.
Introduction to SAS Enterprise Miner 5.3 Software � Explore Nodes 11
Explore Nodes
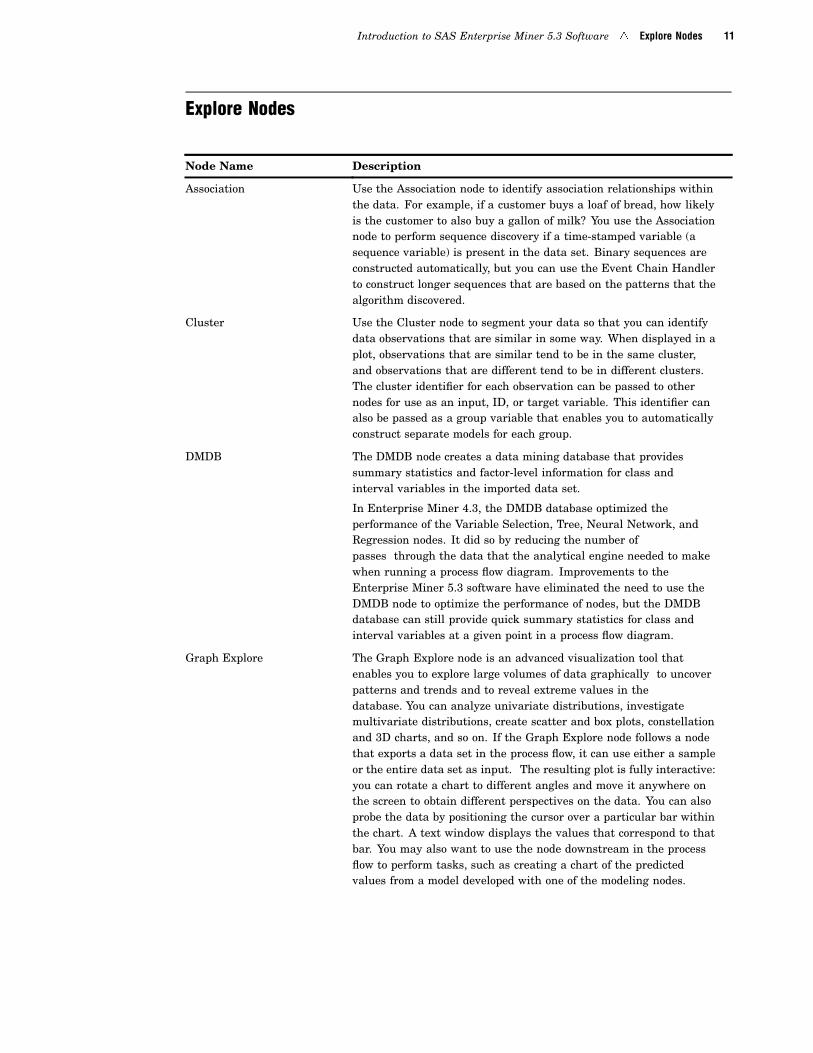
Node Name Description
Association Use the Association node to identify association relationships withinthe data. For example, if a customer buys a loaf of bread, how likelyis the customer to also buy a gallon of milk? You use the Associationnode to perform sequence discovery if a time-stamped variable (asequence variable) is present in the data set. Binary sequences areconstructed automatically, but you can use the Event Chain Handlerto construct longer sequences that are based on the patterns that thealgorithm discovered.
Cluster Use the Cluster node to segment your data so that you can identifydata observations that are similar in some way. When displayed in aplot, observations that are similar tend to be in the same cluster,and observations that are different tend to be in different clusters.The cluster identifier for each observation can be passed to othernodes for use as an input, ID, or target variable. This identifier canalso be passed as a group variable that enables you to automaticallyconstruct separate models for each group.
DMDB The DMDB node creates a data mining database that providessummary statistics and factor-level information for class andinterval variables in the imported data set.
In Enterprise Miner 4.3, the DMDB database optimized theperformance of the Variable Selection, Tree, Neural Network, andRegression nodes. It did so by reducing the number ofpasses through the data that the analytical engine needed to makewhen running a process flow diagram. Improvements to theEnterprise Miner 5.3 software have eliminated the need to use theDMDB node to optimize the performance of nodes, but the DMDBdatabase can still provide quick summary statistics for class andinterval variables at a given point in a process flow diagram.
Graph Explore The Graph Explore node is an advanced visualization tool thatenables you to explore large volumes of data graphically to uncoverpatterns and trends and to reveal extreme values in thedatabase. You can analyze univariate distributions, investigatemultivariate distributions, create scatter and box plots, constellationand 3D charts, and so on. If the Graph Explore node follows a nodethat exports a data set in the process flow, it can use either a sampleor the entire data set as input. The resulting plot is fully interactive:you can rotate a chart to different angles and move it anywhere onthe screen to obtain different perspectives on the data. You can alsoprobe the data by positioning the cursor over a particular bar withinthe chart. A text window displays the values that correspond to thatbar. You may also want to use the node downstream in the processflow to perform tasks, such as creating a chart of the predictedvalues from a model developed with one of the modeling nodes.

12 Explore Nodes � Chapter 1
Node Name Description
Market Basket The Market Basket node performs association rule mining overtransaction data in conjunction with item taxonomy. Transactiondata contain sales transaction records with details about itemsbought by customers. Market basket analysis uses the informationfrom the transaction data to give you insight about which productstend to be purchased together. This information can be used tochange store layouts, to determine which products to put on sale, orto determine when to issue coupons or some other profitable courseof action.
The market basket analysis is not limited to the retail marketingdomain. The analysis framework can be abstracted to other areassuch as word co-occurrence relationships in text documents.
The Market Basket node is not included with SAS Enterprise Minerfor the Desktop.
MultiPlot Use the MultiPlot node to explore larger volumes of data graphically.The MultiPlot node automatically creates bar charts and scatterplots for the input and target variables without requiring you tomake several menu or window item selections. The code that iscreated by this node can be used to create graphs in a batchenvironment. See Chapter 3.
Path Analysis Use the Path Analysis node to analyze Web log data and todetermine the paths that visitors take as they navigate through aWeb site. You can also use the node to perform sequence analysis.
SOM/Kohonen Use the SOM/Kohonen node to perform unsupervised learning byusing Kohonen vector quantization (VQ), Kohonen self-organizingmaps (SOMs), or batch SOMs with Nadaraya-Watson or local-linearsmoothing. Kohonen VQ is a clustering method, whereas SOMs areprimarily dimension-reduction methods.
StatExplore Use the StatExplore node to examine variable distributions andstatistics in your data sets. You can use the StatExplore node tocompute standard univariate distribution statistics, to computestandard bivariate statistics by class target and class segment, and tocompute correlation statistics for interval variables by interval inputand target. You can also combine the StatExplore node with otherEnterprise Miner tools to perform data mining tasks such as usingthe StatExplore node with the Metadata node to reject variables,using the StatExplore node with the Transform Variables node tosuggest transformations, or even using the StatExplore node withthe Regression node to create interactions terms. See Chapter 3.

Introduction to SAS Enterprise Miner 5.3 Software � Modify Nodes 13
Node Name Description
Variable Clustering Variable clustering is a useful tool for data reduction, such aschoosing the best variables or cluster components foranalysis. Variable clustering removes collinearity, decreases variableredundancy, and helps to reveal the underlying structure of the inputvariables in a data set. When properly used as a variable-reductiontool, the Variable Clustering node can replace a large set of variableswith the set of cluster components with little loss of information.
Variable Selection Use the Variable Selection node to evaluate the importance of inputvariables in predicting or classifying the target variable. To preselectthe important inputs, the Variable Selection node uses either anR-Square or a Chi-Square selection (tree-based) criterion. You canuse the R-Square criterion to remove variables in hierarchies,remove variables that have large percentages of missing values, andremove class variables that are based on the number of uniquevalues. The variables that are not related to the target are set to astatus of rejected. Although rejected variables are passed tosubsequent nodes in the process flow diagram, these variables arenot used as model inputs by a more detailed modeling node, such asthe Neural Network and Decision Tree nodes. You can reassign thestatus of the input model variables to rejected in the VariableSelection node. See Chapter 5.
Modify Nodes
Node Name Description
Drop Use the Drop node to drop certain variables from your scoredEnterprise Miner data sets. You can drop variables that have rolesof Assess, Classification, Frequency, Hidden, Input, Predict,Rejected, Residual, Target, and Other from your scored data sets.
Impute Use the Impute node to impute (fill in) values for observations thathave missing values. You can replace missing values for intervalvariables with the mean, median, midrange, mid-minimum spacing,distribution-based replacement. Alternatively, you can use areplacement M-estimator such as Tukey’s biweight, Hubers, orAndrew’s Wave. You can also estimate the replacement values foreach interval input by using a tree-based imputation method.Missing values for class variables can be replaced with the mostfrequently occurring value, distribution-based replacement,tree-based imputation, or a constant. See Chapter 5.

14 Modify Nodes � Chapter 1
Node Name Description
Interactive Binning The Interactive Binning node is an interactive grouping tool that youuse to model nonlinear functions of multiple modes of continuousdistributions. The interactive tool computes initial bins by quantiles;then you can interactively split and combine the initial bins.You usethe Interactive Binning node to create bins or buckets or classes ofall input variables. You can create bins in order to reduce thenumber of unique levels as well as attempt to improve the predictivepower of each input. The Interactive Binning node enables you toselect strong characteristics based on the Gini statistic and to groupthe selected characteristics based on business considerations. Thenode is helpful in shaping the data to represent risk ranking trendsrather than modeling quirks, which might lead to overfitting.
Principal Components Use the Principal Components node to perform a principalcomponents analysis for data interpretation and dimensionreduction. The node generates principal components that areuncorrelated linear combinations of the original input variables andthat depend on the covariance matrix or correlation matrix of theinput variables. In data mining, principal components are usuallyused as the new set of input variables for subsequent analysis bymodeling nodes.
Replacement Use the Replacement node to impute (fill in) values for observationsthat have missing values and to replace specified non-missing valuesfor class variables in data sets. You can replace missing values forinterval variables with the mean, median, midrange, ormid-minimum spacing, or with a distribution-based replacement.Alternatively, you can use a replacement M-estimator such asTukey’s biweight, Huber’s, or Andrew’s Wave. You can also estimatethe replacement values for each interval input by using a tree-basedimputation method. Missing values for class variables can bereplaced with the most frequently occurring value,distribution-based replacement, tree-based imputation, or aconstant. See Chapters 3, 4, and 5.
Rules Builder The Rules Builder node accesses the Rules Builder window so youcan create ad hoc sets of rules with user-definable outcomes. You caninteractively define the values of the outcome variable and the pathsto the outcome. This is useful in ad hoc rule creation such asapplying logic for posterior probabilities and scorecard values. AnyInput Data Source data set can be used as an input to the RulesBuilder node. Rules are defined using charts and histograms basedon a sample of the data.
Transform Variables Use the Transform Variables node to create new variables that aretransformations of existing variables in your data. Transformationsare useful when you want to improve the fit of a model to the data.For example, transformations can be used to stabilize variances,remove nonlinearity, improve additivity, and correct nonnormality invariables. In Enterprise Miner, the Transform Variables node alsoenables you to transform class variables and to create interactionvariables. See Chapter 5.

Introduction to SAS Enterprise Miner 5.3 Software � Model Nodes 15
Model Nodes
Node Name Description
AutoNeural Use the AutoNeural node to automatically configure a neuralnetwork. It conducts limited searches for a better networkconfiguration. See Chapters 5 and 6.
Decision Tree Use the Decision Tree node to fit decision tree models to your data.The implementation includes features that are found in a variety ofpopular decision tree algorithms such as CHAID, CART, and C4.5.The node supports both automatic and interactive training. Whenyou run the Decision Tree node in automatic mode, it automaticallyranks the input variables, based on the strength of theircontribution to the tree. This ranking can be used to select variablesfor use in subsequent modeling. You can override any automatic stepwith the option to define a splitting rule and prune explicit tools orsubtrees. Interactive training enables you to explore and evaluate alarge set of trees as you develop them. See Chapters 4 and 6.
Dmine Regression Use the Dmine Regression node to compute a forward stepwiseleast-squares regression model. In each step, an independentvariable is selected that contributes maximally to the modelR-square value.
DMNeural Use DMNeural node to fit an additive nonlinear model. The additivenonlinear model uses bucketed principal components as inputs topredict a binary or an interval target variable.
Ensemble Use the Ensemble node to create new models by combining theposterior probabilities (for class targets) or the predicted values (forinterval targets) from multiple predecessor models.
Gradient Boosting Gradient boosting is a boosting approach that creates a series ofsimple decision trees that together form a single predictive model.Each tree in the series is fit to the residual of the prediction from theearlier trees in the series. Each time the data is used to grow a tree,the accuracy of the tree is computed. The successive samples areadjusted to accommodate previously computed inaccuracies. Becauseeach successive sample is weighted according to the classificationaccuracy of previous models, this approach is sometimes calledstochastic gradient boosting. Boosting is defined for binary, nominal,and interval targets.
MBR (Memory-BasedReasoning)
Use the MBR (Memory-Based Reasoning) node to identify similarcases and to apply information that is obtained from these cases to anew record. The MBR node uses k-nearest neighbor algorithms tocategorize or predict observations.
Model Import Use the Model Import node to import and assess a model that wasnot created by one of the Enterprise Miner modeling nodes. You canthen use the Model Comparison node to compare the user-definedmodel with one or more models that you developed with anEnterprise Miner modeling node. This process is called integratedassessment.
16 Model Nodes � Chapter 1
Node Name Description
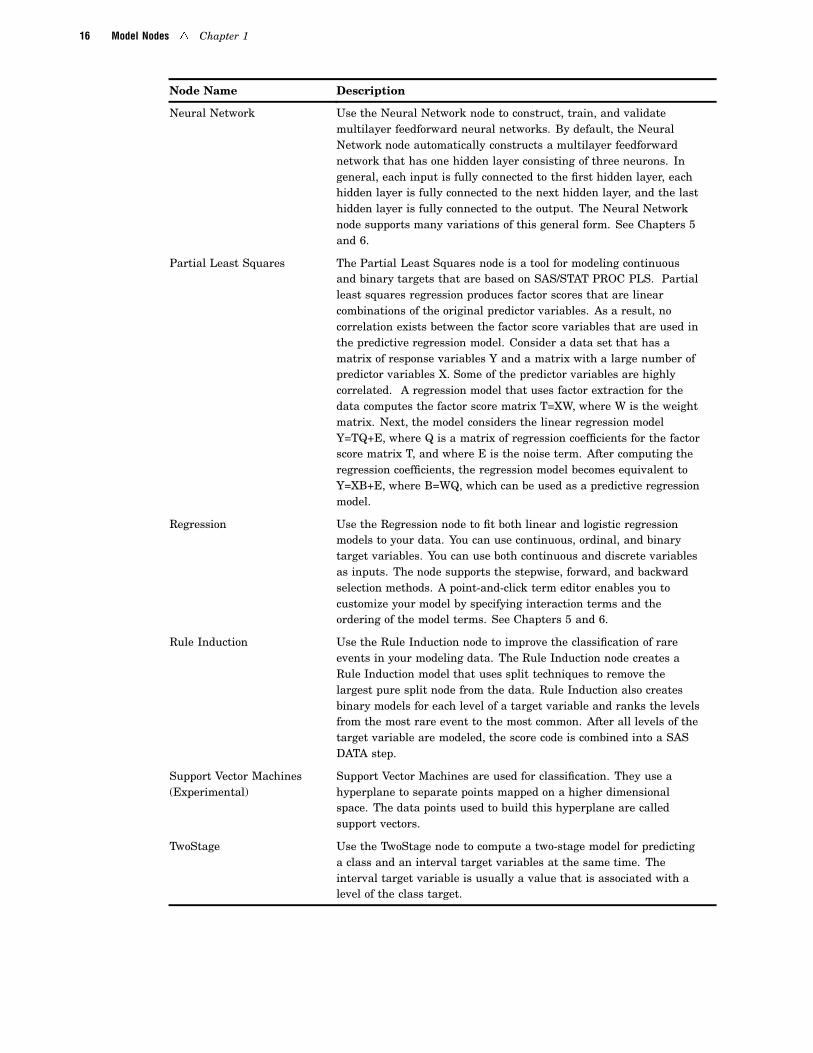
Neural Network Use the Neural Network node to construct, train, and validatemultilayer feedforward neural networks. By default, the NeuralNetwork node automatically constructs a multilayer feedforwardnetwork that has one hidden layer consisting of three neurons. Ingeneral, each input is fully connected to the first hidden layer, eachhidden layer is fully connected to the next hidden layer, and the lasthidden layer is fully connected to the output. The Neural Networknode supports many variations of this general form. See Chapters 5and 6.
Partial Least Squares The Partial Least Squares node is a tool for modeling continuousand binary targets that are based on SAS/STAT PROC PLS. Partialleast squares regression produces factor scores that are linearcombinations of the original predictor variables. As a result, nocorrelation exists between the factor score variables that are used inthe predictive regression model. Consider a data set that has amatrix of response variables Y and a matrix with a large number ofpredictor variables X. Some of the predictor variables are highlycorrelated. A regression model that uses factor extraction for thedata computes the factor score matrix T=XW, where W is the weightmatrix. Next, the model considers the linear regression modelY=TQ+E, where Q is a matrix of regression coefficients for the factorscore matrix T, and where E is the noise term. After computing theregression coefficients, the regression model becomes equivalent toY=XB+E, where B=WQ, which can be used as a predictive regressionmodel.
Regression Use the Regression node to fit both linear and logistic regressionmodels to your data. You can use continuous, ordinal, and binarytarget variables. You can use both continuous and discrete variablesas inputs. The node supports the stepwise, forward, and backwardselection methods. A point-and-click term editor enables you tocustomize your model by specifying interaction terms and theordering of the model terms. See Chapters 5 and 6.
Rule Induction Use the Rule Induction node to improve the classification of rareevents in your modeling data. The Rule Induction node creates aRule Induction model that uses split techniques to remove thelargest pure split node from the data. Rule Induction also createsbinary models for each level of a target variable and ranks the levelsfrom the most rare event to the most common. After all levels of thetarget variable are modeled, the score code is combined into a SASDATA step.
Support Vector Machines(Experimental)
Support Vector Machines are used for classification. They use ahyperplane to separate points mapped on a higher dimensionalspace. The data points used to build this hyperplane are calledsupport vectors.
TwoStage Use the TwoStage node to compute a two-stage model for predictinga class and an interval target variables at the same time. Theinterval target variable is usually a value that is associated with alevel of the class target.

Introduction to SAS Enterprise Miner 5.3 Software � Assess Nodes 17
Note: These modeling nodes use a directory table facility, called the Model Manager,in which you can store and access models on demand. The modeling nodes also enableyou to modify the target profile or profiles for a target variable. �
Assess Nodes
Node Name Description
Cutoff The Cutoff node provides tabular and graphical information to assistusers in determining an appropriate probability cutoff point fordecision making with binary target models. The establishment of acutoff decision point entails the risk of generating false positives andfalse negatives, but an appropriate use of the Cutoff node can helpminimize those risks.
You will typically run the node at least twice. In the first run, youobtain all the plots and tables. In subsequent runs, you can changethe values of the Cutoff Method and Cutoff User Input properties,customizing the plots, until an optimal cutoff value is obtained.
Decisions Use the Decisions node to define target profiles for a target thatproduces optimal decisions. The decisions are made using auser-specified decision matrix and output from a subsequentmodeling procedure.
Model Comparison Use the Model Comparison node to use a common framework forcomparing models and predictions from any of the modeling tools(such as Regression, Decision Tree, and Neural Network tools). Thecomparison is based on the expected and actual profits or losses thatwould result from implementing the model. The node produces thefollowing charts that help to describe the usefulness of the model:lift, profit, return on investment, receiver operating curves,diagnostic charts, and threshold-based charts. See Chapter 6.
Segment Profile Use the Segment Profile node to assess and explore segmented datasets. Segmented data is created from data BY-values, clustering, orapplied business rules. The Segment Profile node facilitates dataexploration to identify factors that differentiate individual segmentsfrom the population, and to compare the distribution of key factorsbetween individual segments and the population. The SegmentProfile node outputs a Profile plot of variable distributions acrosssegments and population, a Segment Size pie chart, a VariableWorth plot that ranks factor importance within each segment, andsummary statistics for the segmentation results. The SegmentProfile node does not generate score code or modify metadata.
Score Use the Score node to manage, edit, export, and execute scoring codethat is generated from a trained model. Scoring is the generation ofpredicted values for a data set that might not contain a targetvariable. The Score node generates and manages scoring formulas inthe form of a single SAS DATA step, which can be used in most SASenvironments even without the presence of Enterprise Miner. SeeChapter 6.

18 Utility Nodes � Chapter 1
Utility Nodes
Node Name Description
Control Point Use the Control Point node to establish a control point to reduce thenumber of connections that are made in process flow diagrams. Forexample, suppose three Input Data nodes are to be connected tothree modeling nodes. If no Control Point node is used, then nineconnections are required to connect all of the Input Data nodes to allof the modeling nodes. However, if a Control Point node is used, onlysix connections are required.
End Groups The End Groups node is used only in conjunction with the StartGroups node. The End Groups node acts as a boundary marker thatdefines the end of group processing operations in a process flowdiagram. Group processing operations are performed on the portionof the process flow diagram that exists between the Start Groupsnode and the End Groups node.
If the group processing function that is specified in the Start Groupsnode is stratified, bagging, or boosting, the End Groups nodefunctions as a model node and presents the final aggregated model.Enterprise Miner tools that follow the End Groups node continuedata mining processes normally.
Start Groups The Start Groups node is useful when your data can be segmentedor grouped, and you want to process the grouped data in differentways. The Start Groups node uses BY-group processing as a methodto process observations from one or more data sources that aregrouped or ordered by values of one or more common variables. BYvariables identify the variable or variables by which the data sourceis indexed, and BY statements process data and order outputaccording to the BY-group values.
You can use the Enterprise Miner Start Groups node to performthese tasks:
� define group variables such as GENDER or JOB, in order toobtain separate analyses for each level of a group variable
� analyze more than one target variable in the same process flow
� specify index looping, or how many times the flow that followsthe node should loop
� resample the data set and use unweighted sampling to createbagging models
� resample the training data set and use reweighted sampling tocreate boosting models
Metadata Use the Metadata node to modify the columns metadata informationat some point in your process flow diagram. You can modifyattributes such as roles, measurement levels, and order.

Introduction to SAS Enterprise Miner 5.3 Software � Overview of the SAS Enterprise Miner 5.3 Getting Started Example 19
Node Name Description
Reporter The Reporter node uses SAS Output Delivery System (ODS)capability to create a single PDF or RTF file that containsinformation about the open process flow diagram. The PDF or RTFdocuments can be viewed and saved directly and are included inEnterprise Miner report package files.
The report contains a header that shows the Enterprise Minersettings, process flow diagram, and detailed information for eachnode. Based on the Nodes property setting, each node that isincluded in the open process flow diagram has a header, propertysettings, and a variable summary. Moreover, the report also includesresults such as variable selection, model diagnostic tables, and plotsfrom the Results browser. Score code, log, and output listing are notincluded in the report. Those items are found in the EnterpriseMiner package folder.
SAS Code Use the SAS Code node to incorporate new or existing SAS code intoprocess flows that you develop using Enterprise Miner. The SASCode node extends the functionality of Enterprise Miner by makingother SAS procedures available in your data mining analysis. Youcan also write a SAS DATA step to create customized scoring code, toconditionally process data, and to concatenate or to merge existingdata sets. See Chapter 6.
Usage Rules for NodesHere are some general rules that govern the placement of nodes in a process flow
diagram:
� The Input Data Source node cannot be preceded by any other nodes.� All nodes except the Input Data Source and SAS Code nodes must be preceded by
a node that exports a data set.
� The SAS Code node can be defined in any stage of the process flow diagram. Itdoes not require an input data set that is defined in the Input Data Source node.
� The Model Comparison node must be preceded by one or more modeling nodes.
� The Score node must be preceded by a node that produces score code. Forexample, the modeling nodes produce score code.
� The Ensemble node must be preceded by a modeling node.� The Replacement node must follow a node that exports a data set, such as a Data
Source, Sample, or Data Partition node.
Overview of the SAS Enterprise Miner 5.3 Getting Started ExampleThis book uses an extended example that is intended to familiarize you with the
many features of Enterprise Miner. Several key components of the Enterprise Minerprocess flow diagram are covered.
In this step-by-step example you learn to do basic tasks in Enterprise Miner: youcreate a project and build a process flow diagram. In your diagram you perform tasks

20 Example Problem Description � Chapter 1
such as accessing data, preparing the data, building multiple predictive models,comparing the models, selecting the best model, and applying the chosen model to newdata (known as scoring data). You also perform tasks such as filtering data, exploringdata, and transforming variables. The example is designed to be used in conjunctionwith Enterprise Miner software.
Example Problem DescriptionA national charitable organization seeks to better target its solicitations for
donations. By only soliciting the most likely donors, less money will be spent onsolicitation efforts and more money will be available for charitable concerns.Solicitations involve sending a small gift to an individual along with a request for adonation. Gifts include mailing labels and greeting cards.
The organization has more than 3.5 million individuals in its mailing database.These individuals have been classified by their response to previous solicitation efforts.Of particular interest is the class of individuals who are identified as lapsing donors.These individuals have made their most recent donation between 12 and 24 monthsago. The organization has found that by predicting the response of this group, they canuse the model to rank all 3.5 million individuals in their database. The campaign refersto a greeting card mailing sent in June of 1997. It is identified in the raw data as the97NK campaign.
When the most appropriate model for maximizing solicitation profit by screening themost likely donors is determined, the scoring code will be used to create a new scoredata set that is named Donor.ScoreData. Scoring new data that does not contain thetarget is the end result of most data mining applications.
When you are finished with this example, your process flow diagram will resemblethe one shown below.
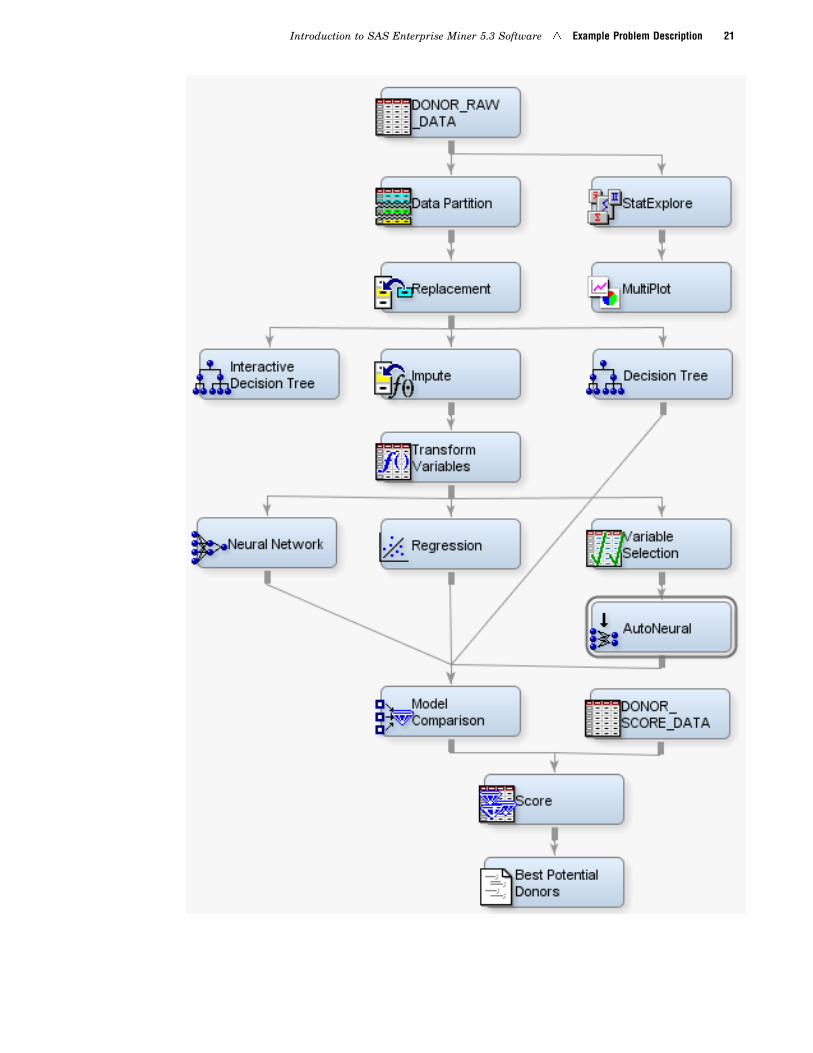
Introduction to SAS Enterprise Miner 5.3 Software � Example Problem Description 21
22 Software Requirements � Chapter 1
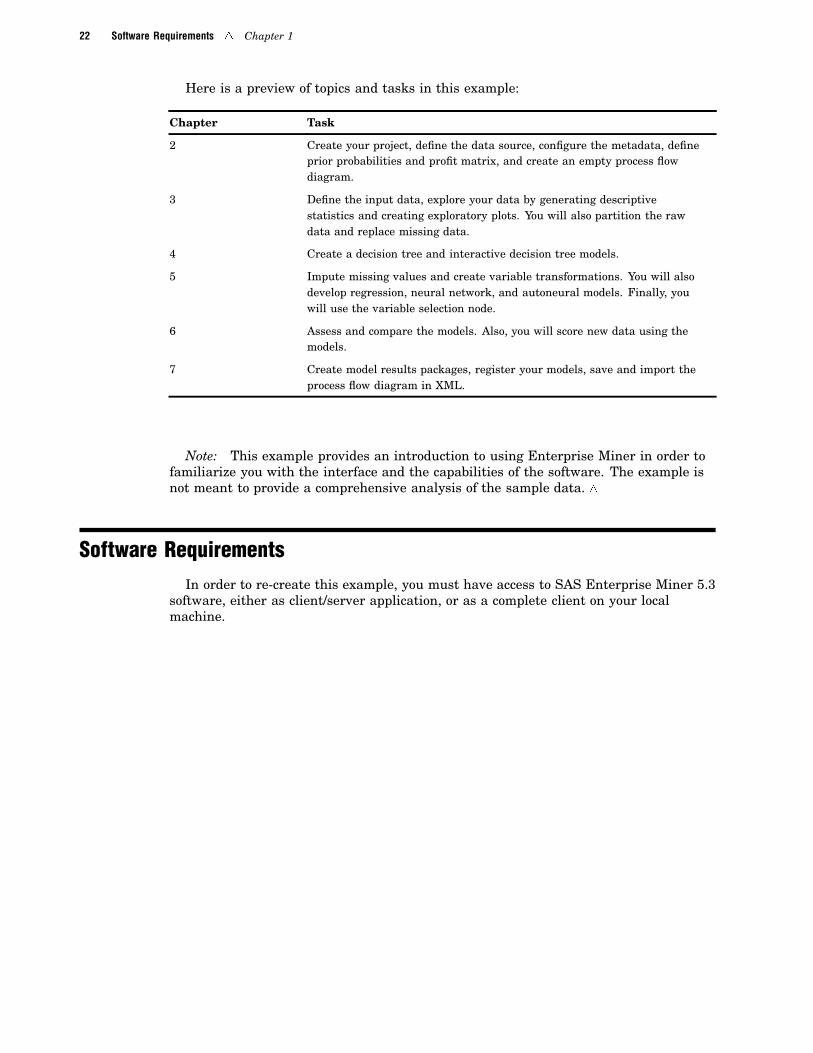
Here is a preview of topics and tasks in this example:
Chapter Task
2 Create your project, define the data source, configure the metadata, defineprior probabilities and profit matrix, and create an empty process flowdiagram.
3 Define the input data, explore your data by generating descriptivestatistics and creating exploratory plots. You will also partition the rawdata and replace missing data.
4 Create a decision tree and interactive decision tree models.
5 Impute missing values and create variable transformations. You will alsodevelop regression, neural network, and autoneural models. Finally, youwill use the variable selection node.
6 Assess and compare the models. Also, you will score new data using themodels.
7 Create model results packages, register your models, save and import theprocess flow diagram in XML.
Note: This example provides an introduction to using Enterprise Miner in order tofamiliarize you with the interface and the capabilities of the software. The example isnot meant to provide a comprehensive analysis of the sample data. �
Software RequirementsIn order to re-create this example, you must have access to SAS Enterprise Miner 5.3
software, either as client/server application, or as a complete client on your localmachine.