Embed Size (px)
Citation preview
www.nasa.gov
National Aeronautics and Space Administration
ARSET Applied Remote Sensing Training http://arset.gsfc.nasa.gov @NASAARSET
Introduction to SAR Interferometry
Eric Fielding Jet Propulsion Laboratory
National Aeronautics and Space Administration Applied Remote Sensing Training Program 2
Learning Objectives
By the end of this presentation, you will be able to: • Understand the basic physics of SAR interferometry • Describe what SAR interferometric phase tells about the land surface • Describe the necessary data preprocessing • Understand the information content in SAR interferometric images

National Aeronautics and Space Administration Applied Remote Sensing Training Program 3
Prerequisites
• Basics of Synthetic Aperture Radar • SAR Processing and Data Analysis
SAR Interferometry Theory
National Aeronautics and Space Administration Applied Remote Sensing Training Program
SAR Imagery and Speckle
5
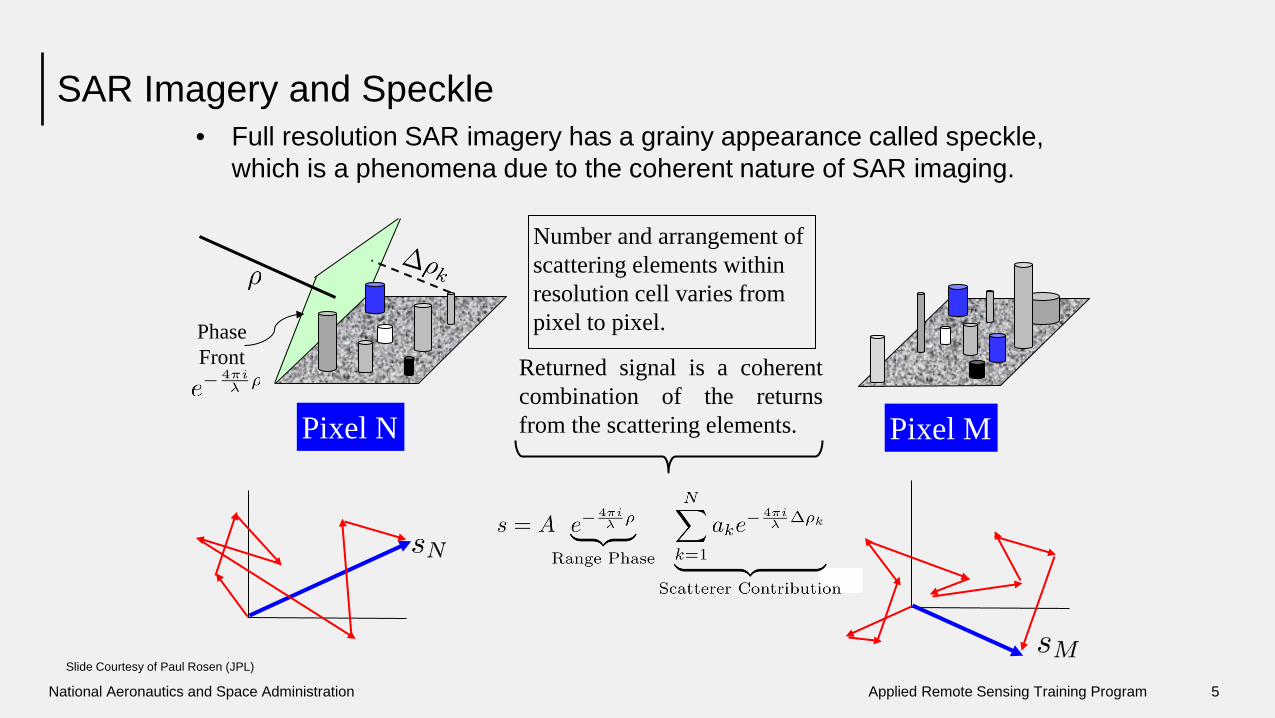
• Full resolution SAR imagery has a grainy appearance called speckle, which is a phenomena due to the coherent nature of SAR imaging.
Pixel N Pixel M
Number and arrangement of scattering elements within resolution cell varies from pixel to pixel.
Returned signal is a coherent combination of the returns from the scattering elements.
Phase Front
Slide Courtesy of Paul Rosen (JPL)
National Aeronautics and Space Administration Applied Remote Sensing Training Program
SAR Phase - A Measure of the Range and Surface Complexity
6
Collection of random path lengths jumbles the phase of the echo
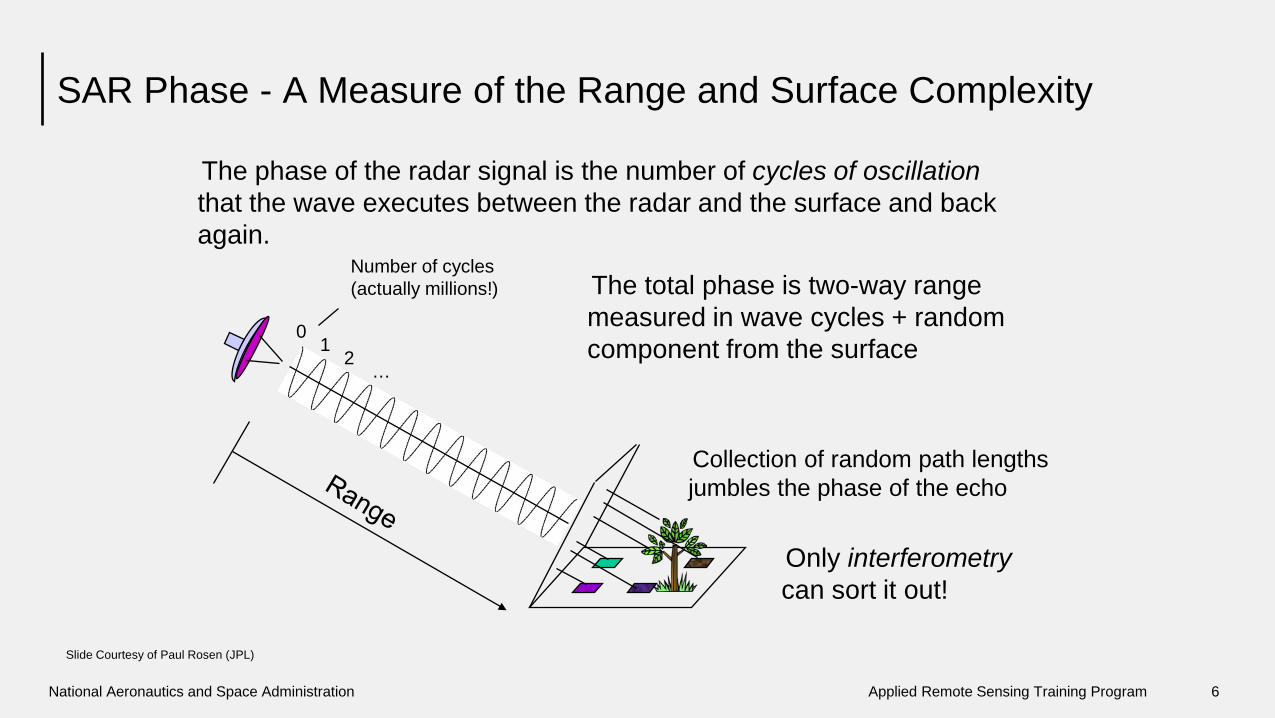
The phase of the radar signal is the number of cycles of oscillation that the wave executes between the radar and the surface and back again.
The total phase is two-way range measured in wave cycles + random component from the surface
Only interferometry can sort it out!
0 1
2 …
Number of cycles (actually millions!)
Slide Courtesy of Paul Rosen (JPL)

National Aeronautics and Space Administration Applied Remote Sensing Training Program
Simplistic view of SAR phase
1. The “other constants” cannot be directly determined.
2. “Other constants” depends on scatterer distribution in the resolution cell, which is unknown and varies from cell to cell.
3. Only way of observing the range change is through interferometry (cancellation of “other constants”).
7
Phase of image 1
Phase of image 2
Slide modified from Paul Rosen (JPL)
National Aeronautics and Space Administration Applied Remote Sensing Training Program
Types of Radar Interferometry
8
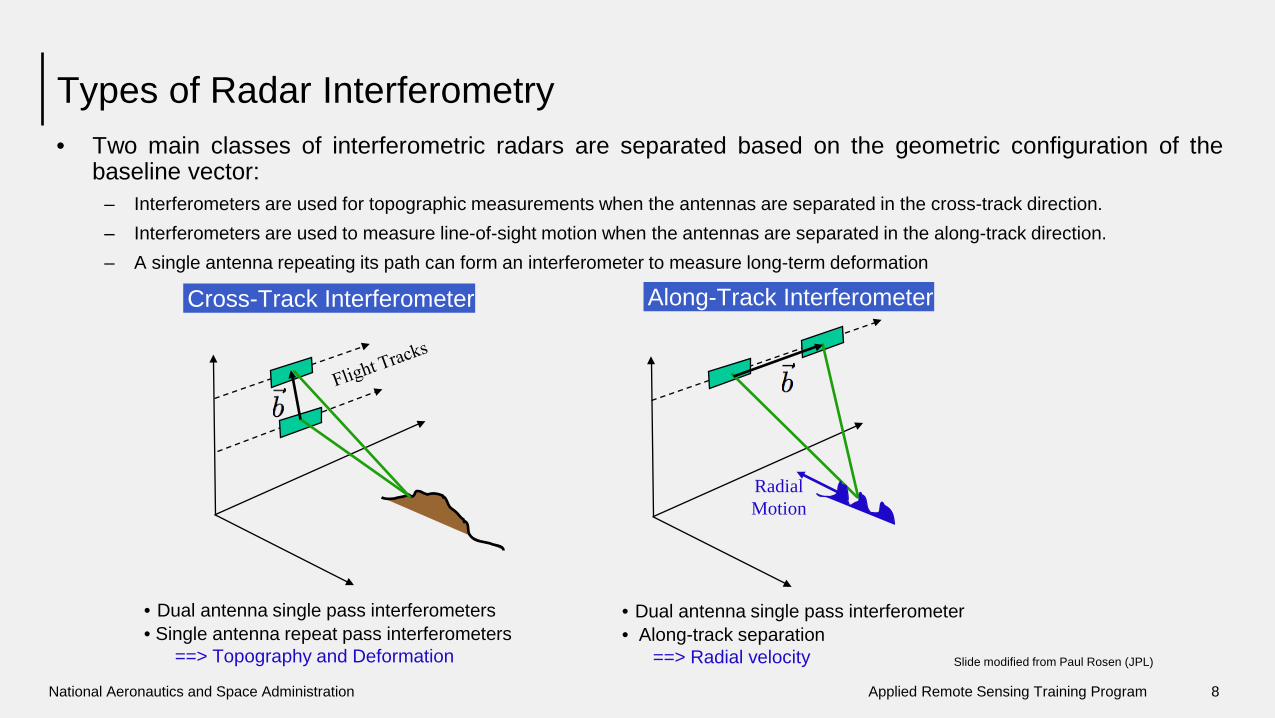
• Two main classes of interferometric radars are separated based on the geometric configuration of the baseline vector:
– Interferometers are used for topographic measurements when the antennas are separated in the cross-track direction. – Interferometers are used to measure line-of-sight motion when the antennas are separated in the along-track direction. – A single antenna repeating its path can form an interferometer to measure long-term deformation
• Dual antenna single pass interferometers • Single antenna repeat pass interferometers ==> Topography and Deformation
• Dual antenna single pass interferometer • Along-track separation ==> Radial velocity
Radial Motion
Cross-Track Interferometer Along-Track Interferometer
Slide modified from Paul Rosen (JPL)

National Aeronautics and Space Administration Applied Remote Sensing Training Program
SAR Interferometry Applications
9
• Mapping/Cartography – Radar Interferometry from airborne platforms is routinely used to produce topographic maps as digital elevation models (DEMs).
• 2-5 meter circular position accuracy • 5-10 m post spacing and resolution • 10 km by 80 km DEMs produced in 1 hr on mini-supercomputer
– Radar imagery is automatically geocoded, becoming easily combined with other (multispectral) data sets. – Applications of topography enabled by interferometric rapid mapping
• Land use management, classification, hazard assessment, intelligence, urban planning, short and long time scale geology, hydrology
• Deformation Mapping and Change Detection – Repeat Pass Radar Interferometry from spaceborne platforms is routinely used to produce topographic change maps as digital
displacement models (DDMs). • 0.3-1 centimeter relative displacement accuracy • 10-100 m post spacing and resolution • 100 km by 100 km DDMs produced rapidly once data is available
– Applications include • Earthquake and volcano monitoring and modeling, landslides and subsidence • Glacier and ice sheet dynamics • Deforestation, change detection, disaster monitoring
Slide modified from Paul Rosen (JPL)

National Aeronautics and Space Administration Applied Remote Sensing Training Program
Interferometry for Topography
10
Measured phase difference:
Triangulation:
Critical Interferometer Knowledge: - Baseline, ,to mm’s - System phase differences, to deg’s
⊗
Slide modified from Paul Rosen (JPL)

National Aeronautics and Space Administration Applied Remote Sensing Training Program
Data Collection Options For single pass interferometry (SPI) both antennas are located on the same platform, which is ideal for
measuring topography. Two modes of data collection are common: • single-antenna-transmit mode - one antenna transmits and both receive • ping-pong mode - each antenna transmits and receives its own echoes effectively doubling the physical
baseline. Ping-Pong Classic
∆ ∆
Slide modified from Paul Rosen (JPL)

National Aeronautics and Space Administration Applied Remote Sensing Training Program
Data Collection Options II
Interferometric data can also be collected in the repeat pass mode (RPI). In this mode two spatially close radar observations of the same scene are made separated in time. The time interval may range from seconds to years. The two observations may be made with different sensors provided they have nearly identical radar system parameters. This kind of data can be used for topography or surface deformation measurements.
Second observation made at some later time.
∆
Slide modified from Paul Rosen (JPL)

National Aeronautics and Space Administration Applied Remote Sensing Training Program
Differential Interferometry
When two observations are made from the same location in space but at different times, the interferometric phase is proportional to any change in the range of a surface feature directly.
Slide modified from Paul Rosen (JPL)

National Aeronautics and Space Administration Applied Remote Sensing Training Program
Differential Interferometry and Topography • Generally two observations are made from different locations in space and at different times, so the
interferometric phase is proportional to topography and topographic change.
If topography is known, then second term can be eliminated to reveal surface change
Note: Sensitivity of phase with respect to change is much greater than with respect to topographic relief
Topography Term
Change Term
∆
∆
∆
∆
Slide modified from Paul Rosen (JPL)

National Aeronautics and Space Administration Applied Remote Sensing Training Program
Differential Interferometry Sensitivities • The reason differential interferometry can detect millimeter level surface deformation is that the
differential phase is much more sensitive to displacements than to topography.
Topographic Sensitivity
Displacement Sensitivity
Topographic Sensitivity Term
Displacement Sensitivity Term
Since ==>
Meter Scale Topography Measurement - Millimeter Scale Topographic Change
(φ ∆φ)
Slide modified from Paul Rosen (JPL)
National Aeronautics and Space Administration Applied Remote Sensing Training Program
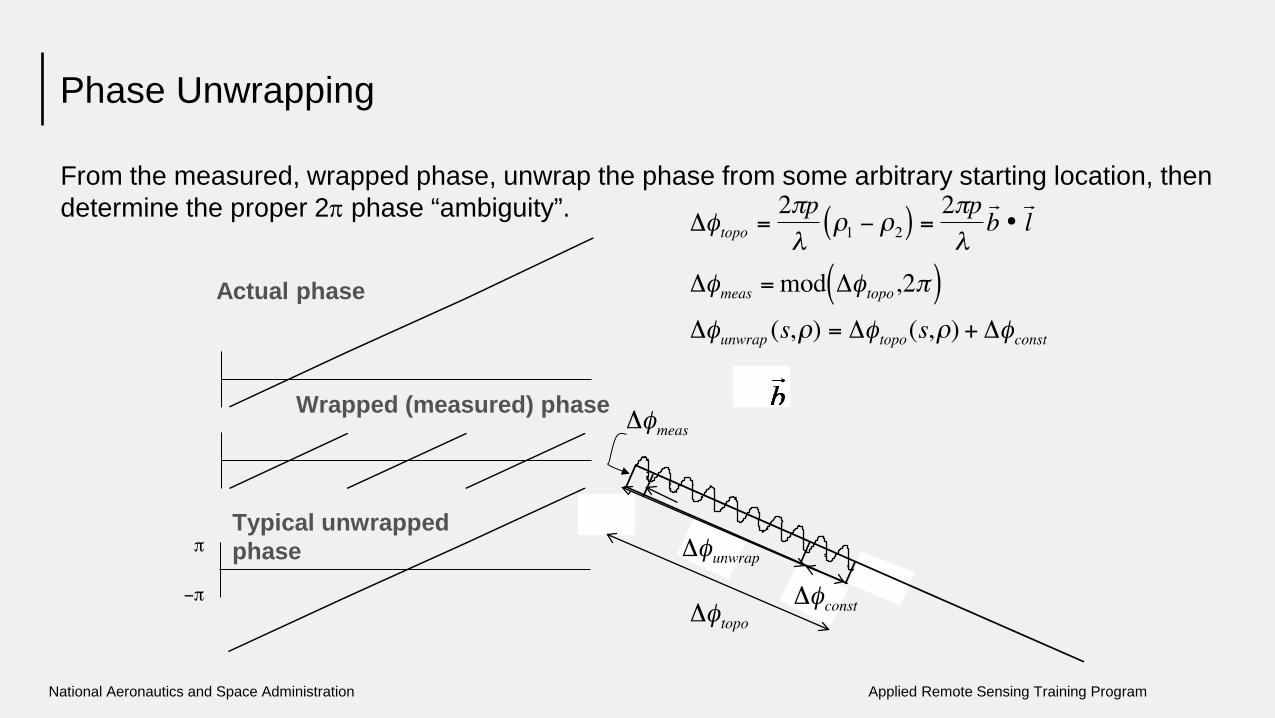
Phase Unwrapping
From the measured, wrapped phase, unwrap the phase from some arbitrary starting location, then determine the proper 2π phase “ambiguity”.
Actual phase
Wrapped (measured) phase
Typical unwrapped phase

National Aeronautics and Space Administration Applied Remote Sensing Training Program
Correlation* Theory
• InSAR signals decorrelate (become incoherent) due to
- Thermal and Processor Noise - Differential Geometric and Volumetric Scattering - Rotation of Viewing Geometry - Random Motions Over Time
• Decorrelation relates to the local phase standard deviation of the interferogram phase - Affects height and displacement accuracy
- Affects ability to unwrap phase
*“Correlation” and “Coherence” are often used synonymously
Slide modified from Paul Rosen (JPL)
National Aeronautics and Space Administration Applied Remote Sensing Training Program
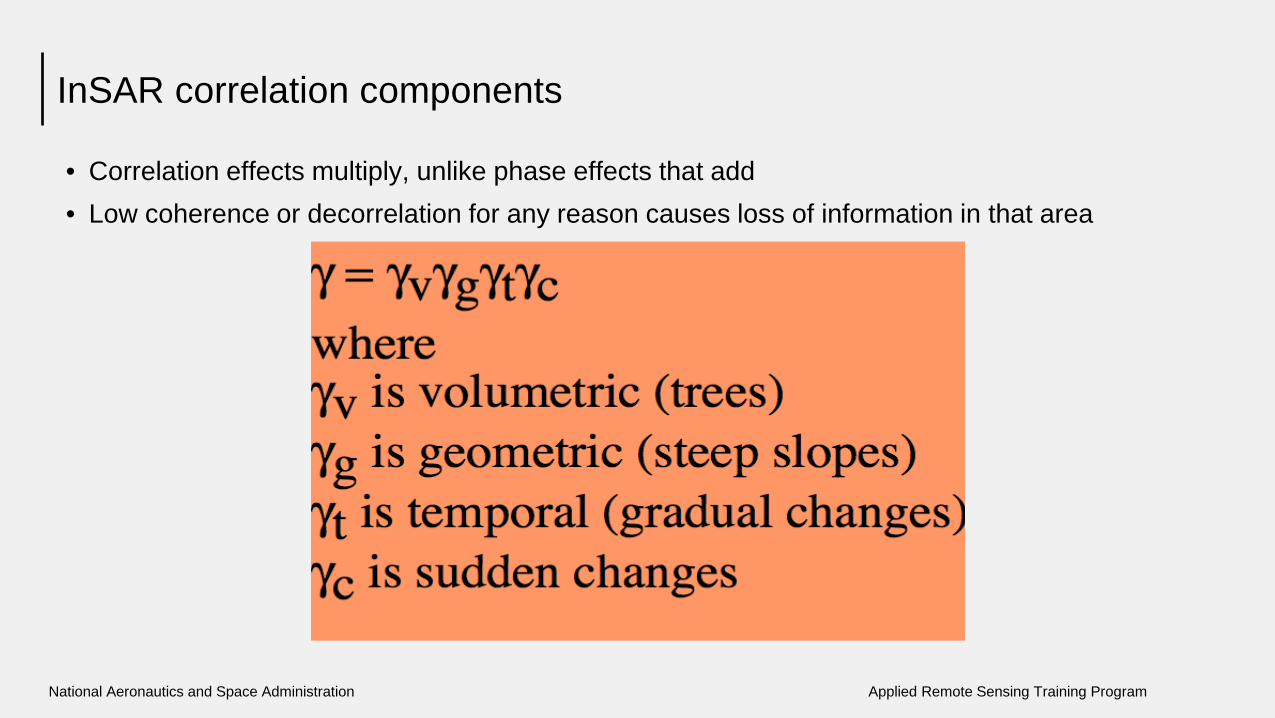
InSAR correlation components
• Correlation effects multiply, unlike phase effects that add • Low coherence or decorrelation for any reason causes loss of information in that area

InSAR Applications

National Aeronautics and Space Administration Applied Remote Sensing Training Program
Some Examples of Deformation
Hector Mine Earthquake Etna Volcano
Joughin et al , 1999
Ice Velocities
Slide modified from Paul Rosen (JPL)
National Aeronautics and Space Administration Applied Remote Sensing Training Program
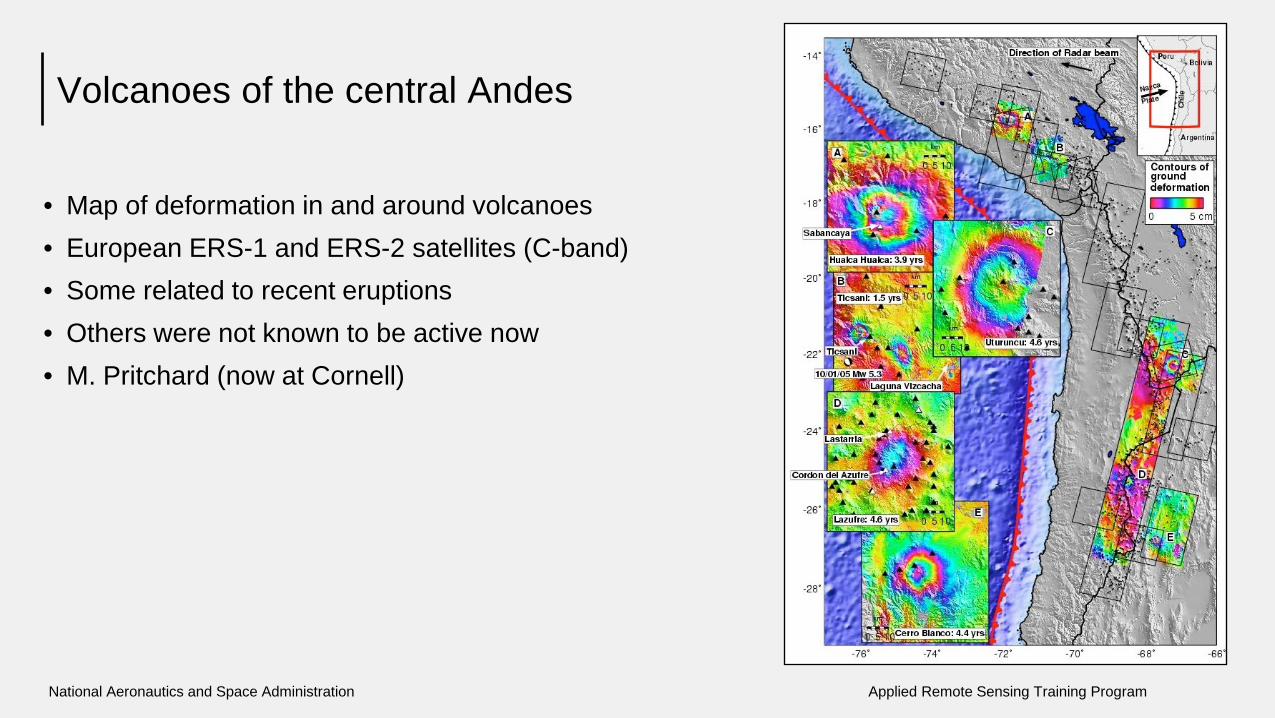
Volcanoes of the central Andes
• Map of deformation in and around volcanoes • European ERS-1 and ERS-2 satellites (C-band) • Some related to recent eruptions • Others were not known to be active now • M. Pritchard (now at Cornell)
National Aeronautics and Space Administration Applied Remote Sensing Training Program
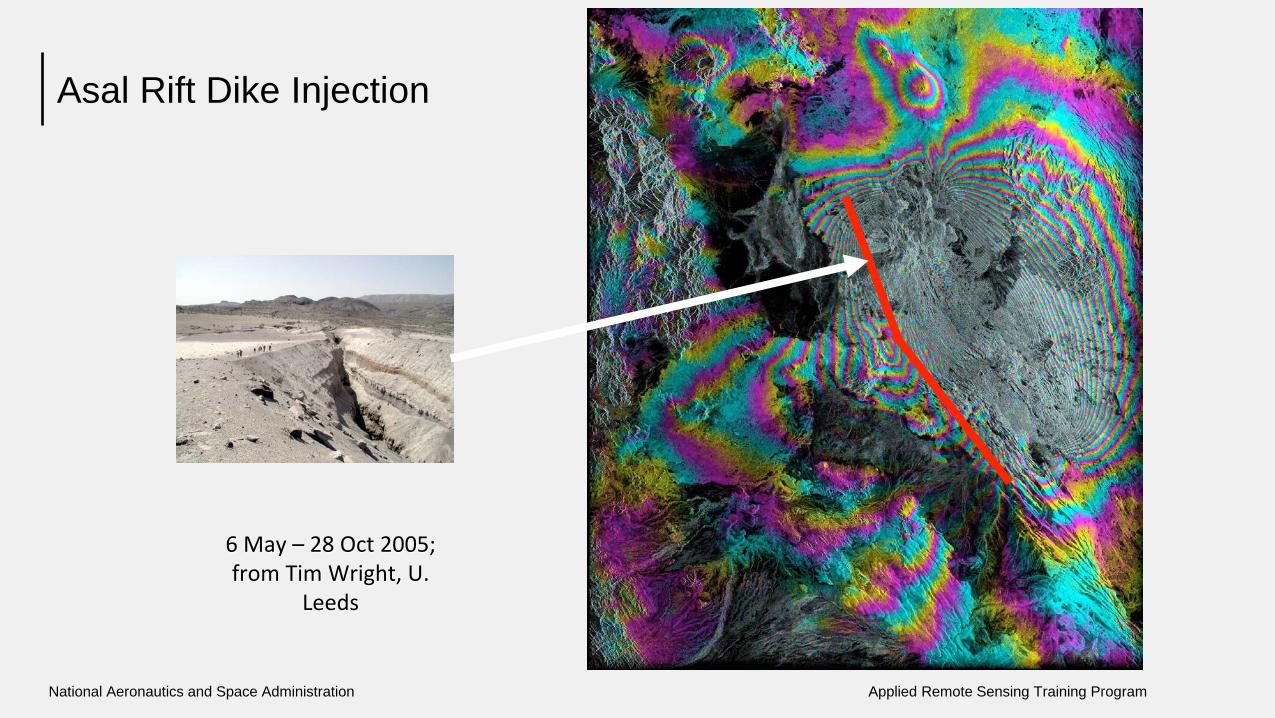
6 May – 28 Oct 2005; from Tim Wright, U.
Leeds
Asal Rift Dike Injection
National Aeronautics and Space Administration Applied Remote Sensing Training Program
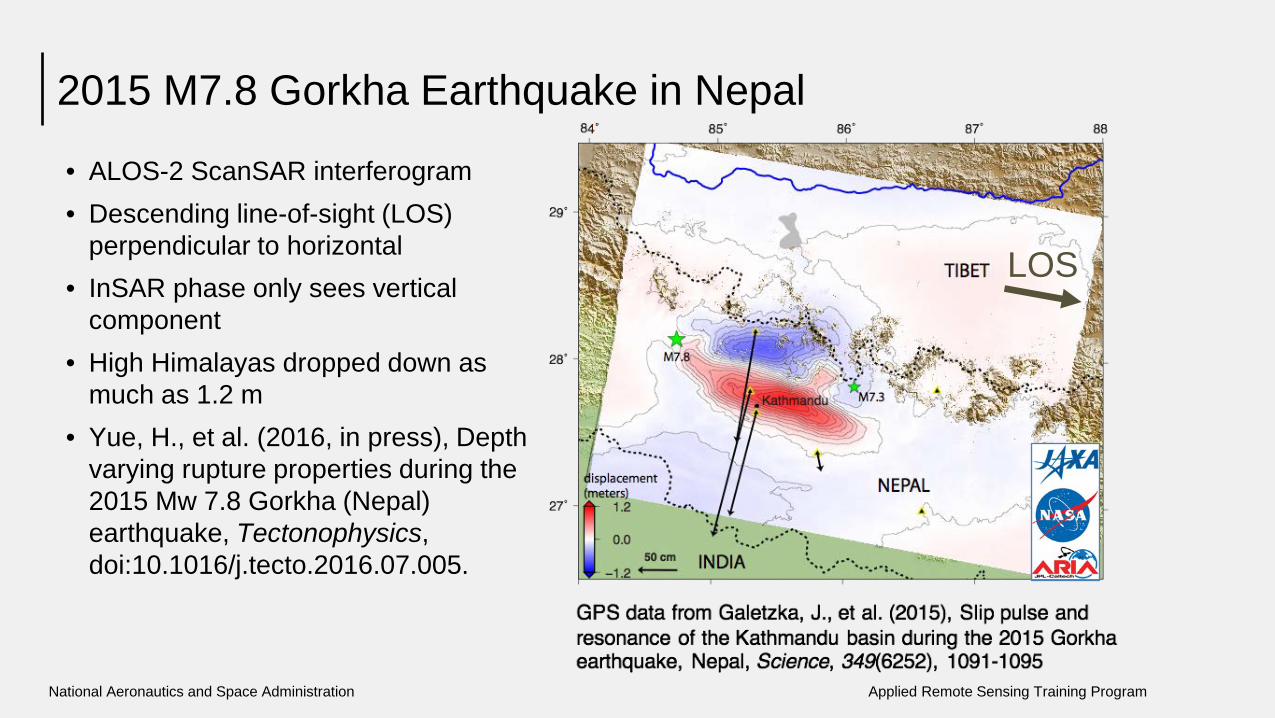
2015 M7.8 Gorkha Earthquake in Nepal
• ALOS-2 ScanSAR interferogram • Descending line-of-sight (LOS)
perpendicular to horizontal • InSAR phase only sees vertical
component • High Himalayas dropped down as
much as 1.2 m • Yue, H., et al. (2016, in press), Depth
varying rupture properties during the 2015 Mw 7.8 Gorkha (Nepal) earthquake, Tectonophysics, doi:10.1016/j.tecto.2016.07.005.
LOS
National Aeronautics and Space Administration Applied Remote Sensing Training Program
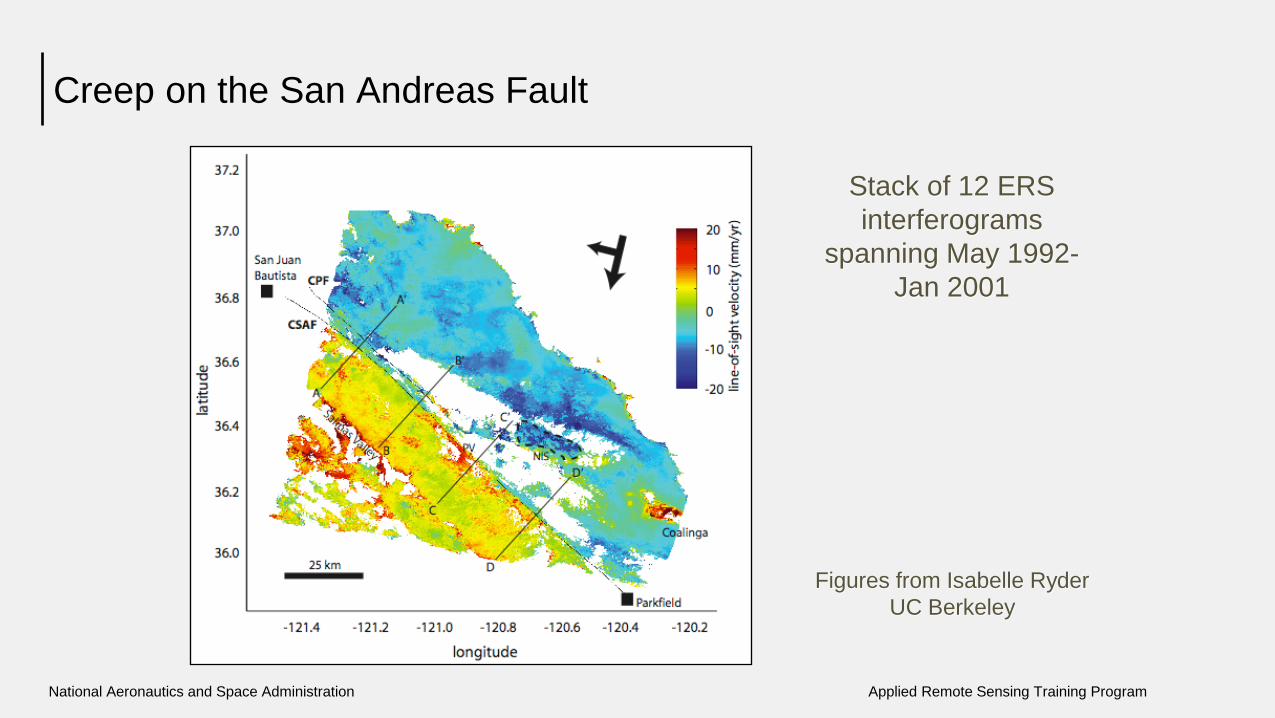
Creep on the San Andreas Fault
Figures from Isabelle Ryder UC Berkeley
Stack of 12 ERS interferograms
spanning May 1992-Jan 2001
National Aeronautics and Space Administration Applied Remote Sensing Training Program
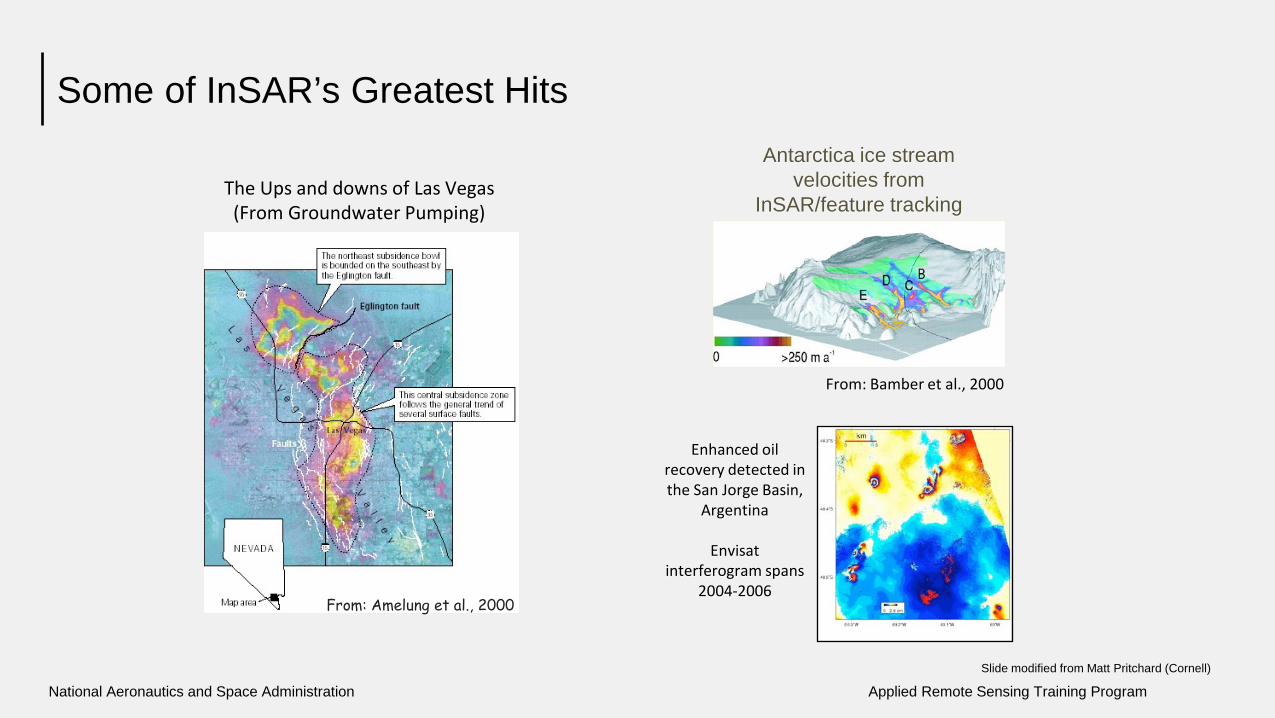
From: Amelung et al., 2000
The Ups and downs of Las Vegas (From Groundwater Pumping)
From: Bamber et al., 2000
Antarctica ice stream velocities from
InSAR/feature tracking
Enhanced oil recovery detected in the San Jorge Basin,
Argentina
Envisat interferogram spans
2004-2006
Some of InSAR’s Greatest Hits
Slide modified from Matt Pritchard (Cornell)
National Aeronautics and Space Administration Applied Remote Sensing Training Program
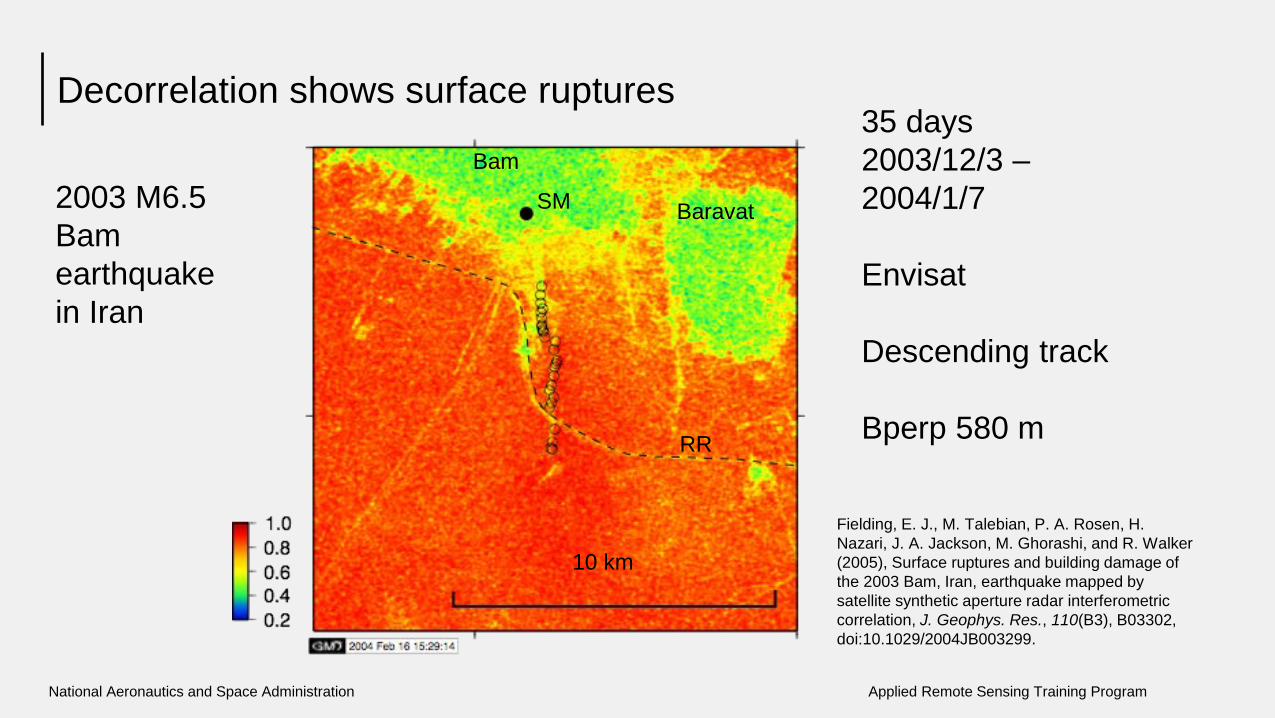
Decorrelation shows surface ruptures
Bam
Baravat
RR
10 km
SM
35 days 2003/12/3 – 2004/1/7 Envisat Descending track Bperp 580 m
Fielding, E. J., M. Talebian, P. A. Rosen, H. Nazari, J. A. Jackson, M. Ghorashi, and R. Walker (2005), Surface ruptures and building damage of the 2003 Bam, Iran, earthquake mapped by satellite synthetic aperture radar interferometric correlation, J. Geophys. Res., 110(B3), B03302, doi:10.1029/2004JB003299.
2003 M6.5 Bam earthquake in Iran

National Aeronautics and Space Administration Applied Remote Sensing Training Program
Correlation change
co-seismic correlation minus pre-seismic correlation
red is co-seismic decorrelation
Bam
Baravat
National Aeronautics and Space Administration Applied Remote Sensing Training Program
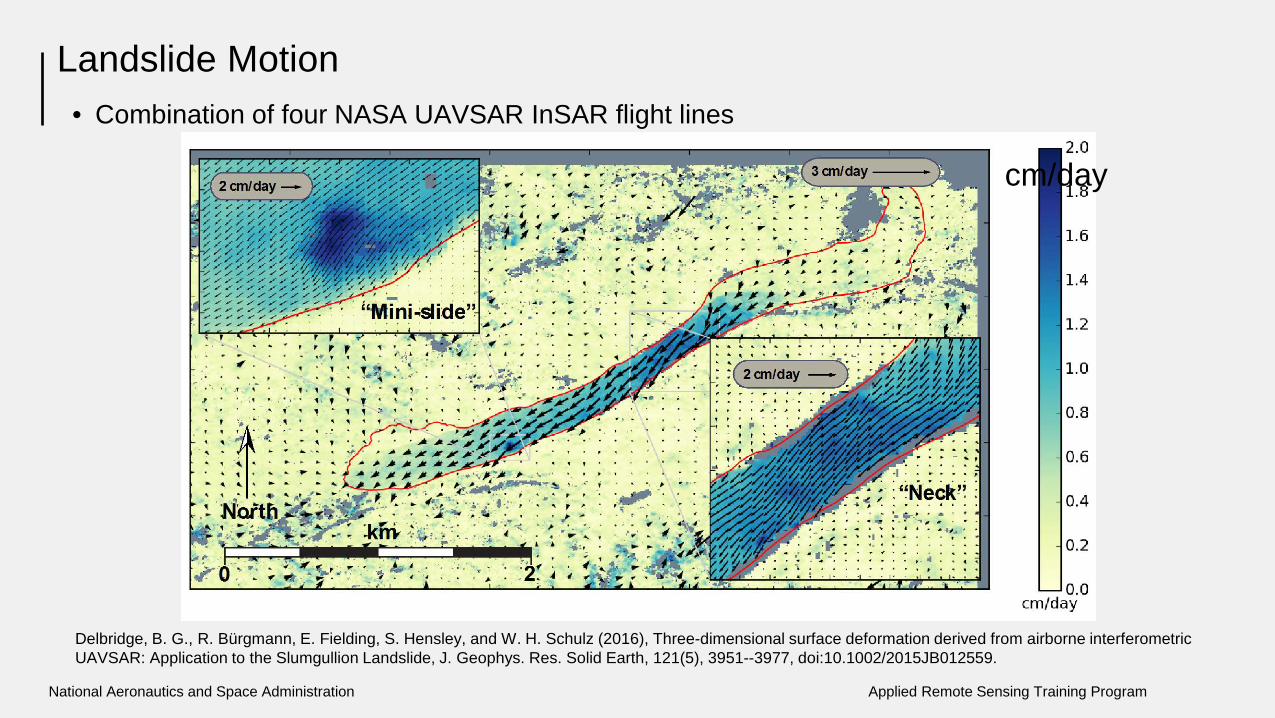
Landslide Motion
• Combination of four NASA UAVSAR InSAR flight lines
cm/day
Delbridge, B. G., R. Bürgmann, E. Fielding, S. Hensley, and W. H. Schulz (2016), Three-dimensional surface deformation derived from airborne interferometric UAVSAR: Application to the Slumgullion Landslide, J. Geophys. Res. Solid Earth, 121(5), 3951--3977, doi:10.1002/2015JB012559.
National Aeronautics and Space Administration Applied Remote Sensing Training Program
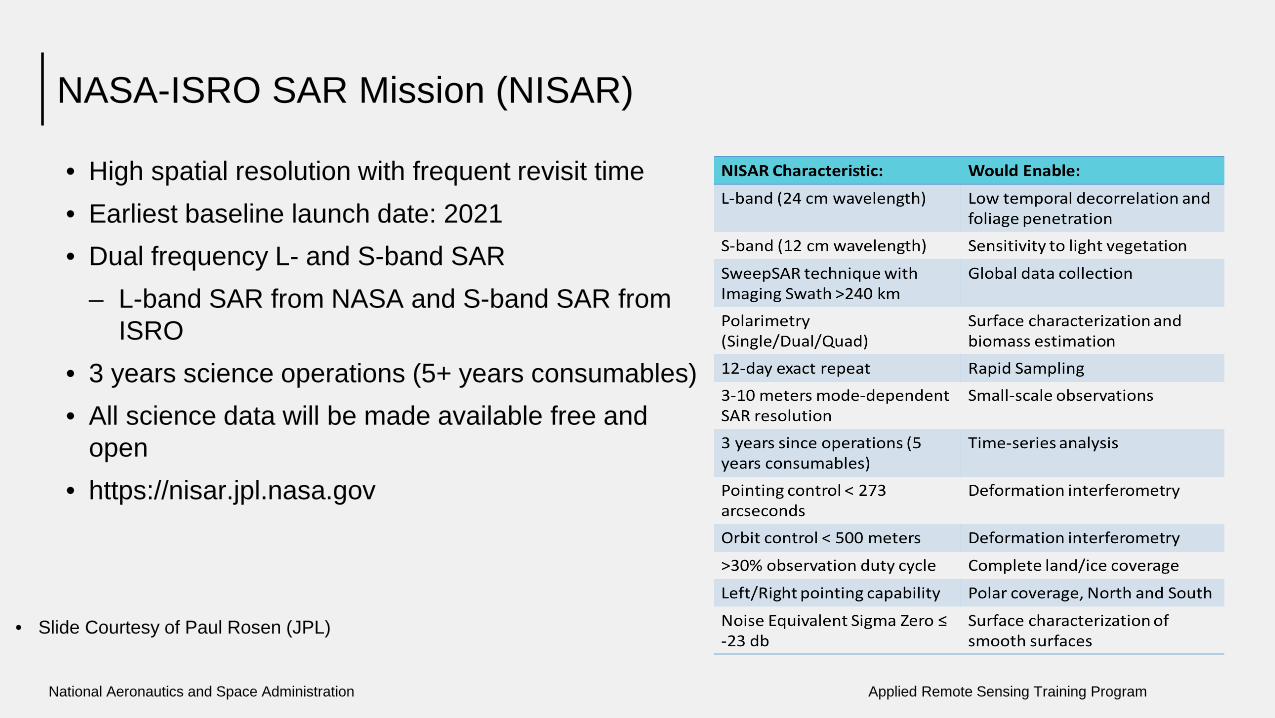
NASA-ISRO SAR Mission (NISAR)
• High spatial resolution with frequent revisit time • Earliest baseline launch date: 2021 • Dual frequency L- and S-band SAR
– L-band SAR from NASA and S-band SAR from ISRO
• 3 years science operations (5+ years consumables) • All science data will be made available free and
open • https://nisar.jpl.nasa.gov
• Slide Courtesy of Paul Rosen (JPL)
Accessing, Opening, and Displaying SAR Interferometry Data

Preprocessing