Embed Size (px)
Citation preview
Better decisions through modelingand
mapping our worldESRIESRI
INTRODUCTIONINTRODUCTION
TOTO
GG II SSGGEOGRAPHIC EOGRAPHIC IINFORMATION NFORMATION SSYSTEMSYSTEMS

What is GIS? A tool for managing What is GIS? A tool for managing, manipulating, analyzing, and displaying any kind of information according to where it i l t d it is located.
What is its purpose? Allows you to visualize i f iinformation
What is its benefit? GIS reveals relationships, patterns and trends not visible in other popular patterns, and trends not visible in other popular systems.
Popular Uses:Popular Uses:•Desktop•Mobile GPS•LBS•Real Time Data

Layers: A GIS map is made of layers, or a collections of geographic objects that are collections of geographic objects that are alike. To make a map, you can use as many layers as you want.
li k li i iAliso Creek Water Quality Monitoring Program County of Orange
Monitoring Population Land Use and Spill SewerMonitoring Subwatersheds
Population Data
Land Use and Spill Locations
SewerSystem
http://www.esri.com/mapmuseum/mapbook_gallery/volume18/water5.html
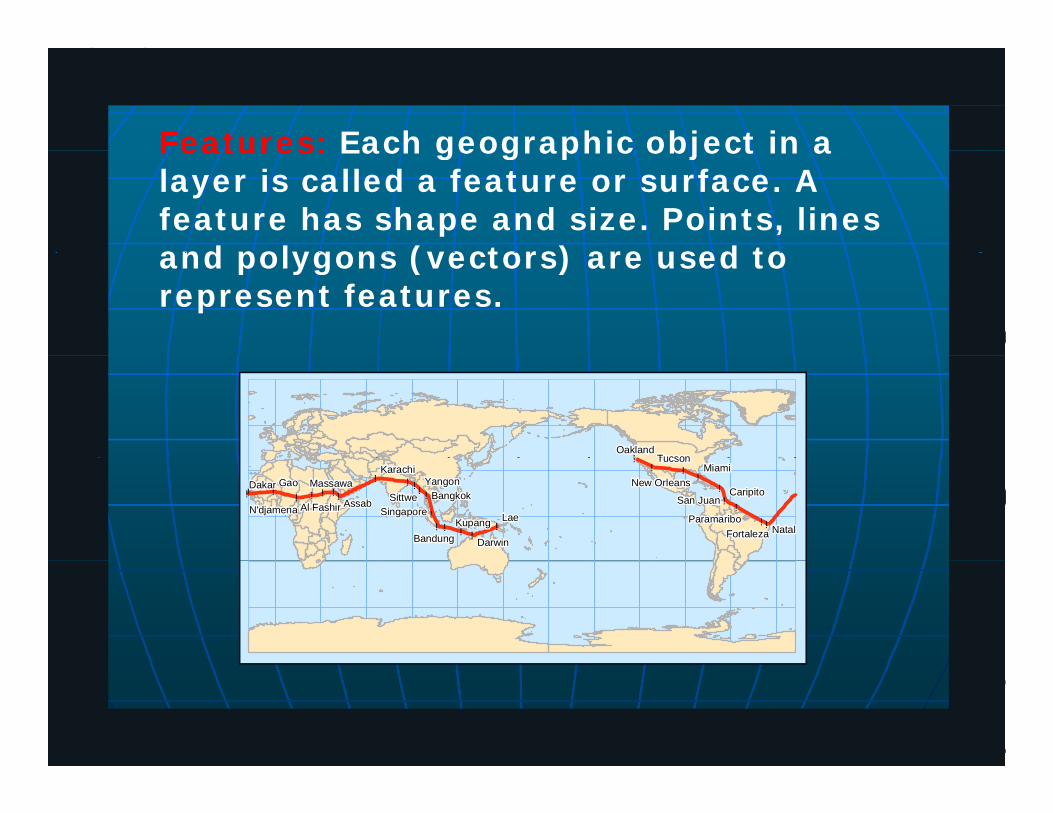
Features: Each geographic object in a Features: Each geographic object in a layer is called a feature or surface. A feature has shape and size. Points, lines and polygons (vectors) are used to and polygons (vectors) are used to represent features.
! TucsonOakland
! ! !!! !
! !
!! ! ! ! ! ! !
! ! ! ! !
!! ! ! !
!
!
Lae
Gao
Assab
Dakar
Natal
Miami
Darwin
Kupang
YangonSittwe
Tucson
Bandung
Bangkok
KarachiMassawa
CaripitoSan Juan
SingaporeAl FashirN'djamena
FortalezaParamaribo
New Orleans
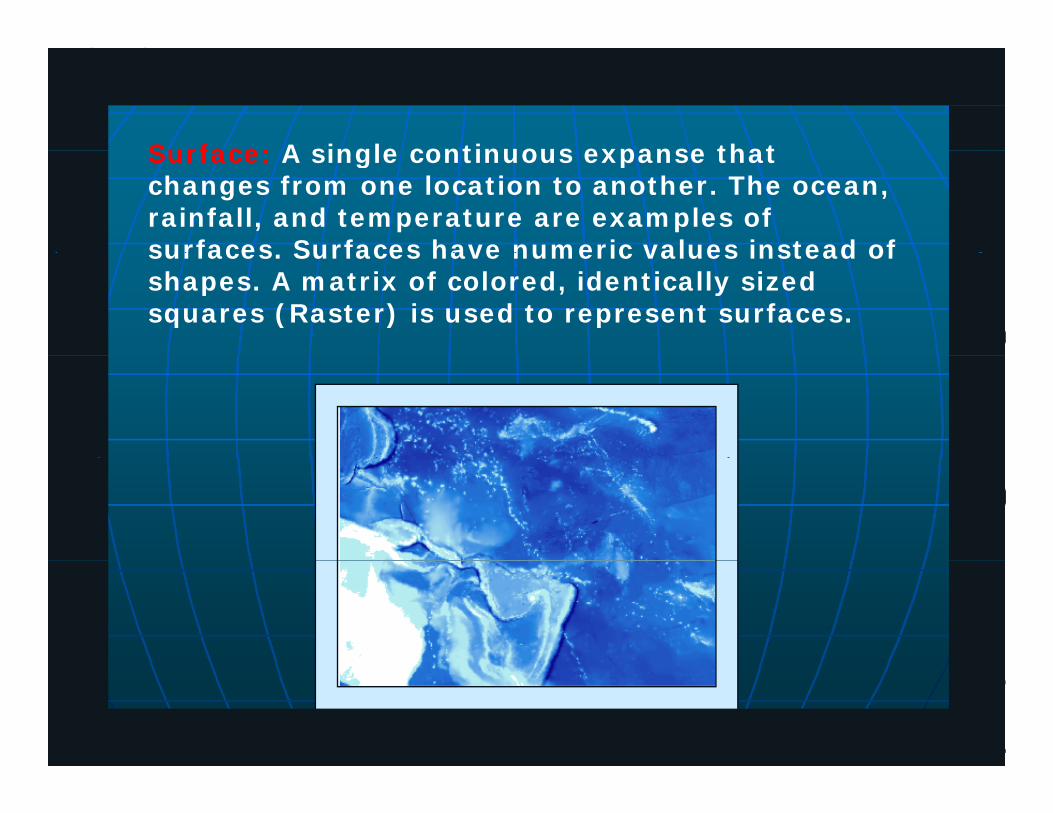
Surface: A single continuous expanse that Surface: A single continuous expanse that changes from one location to another. The ocean, rainfall, and temperature are examples of surfaces Surfaces have numeric values instead of surfaces. Surfaces have numeric values instead of shapes. A matrix of colored, identically sized squares (Raster) is used to represent surfaces.
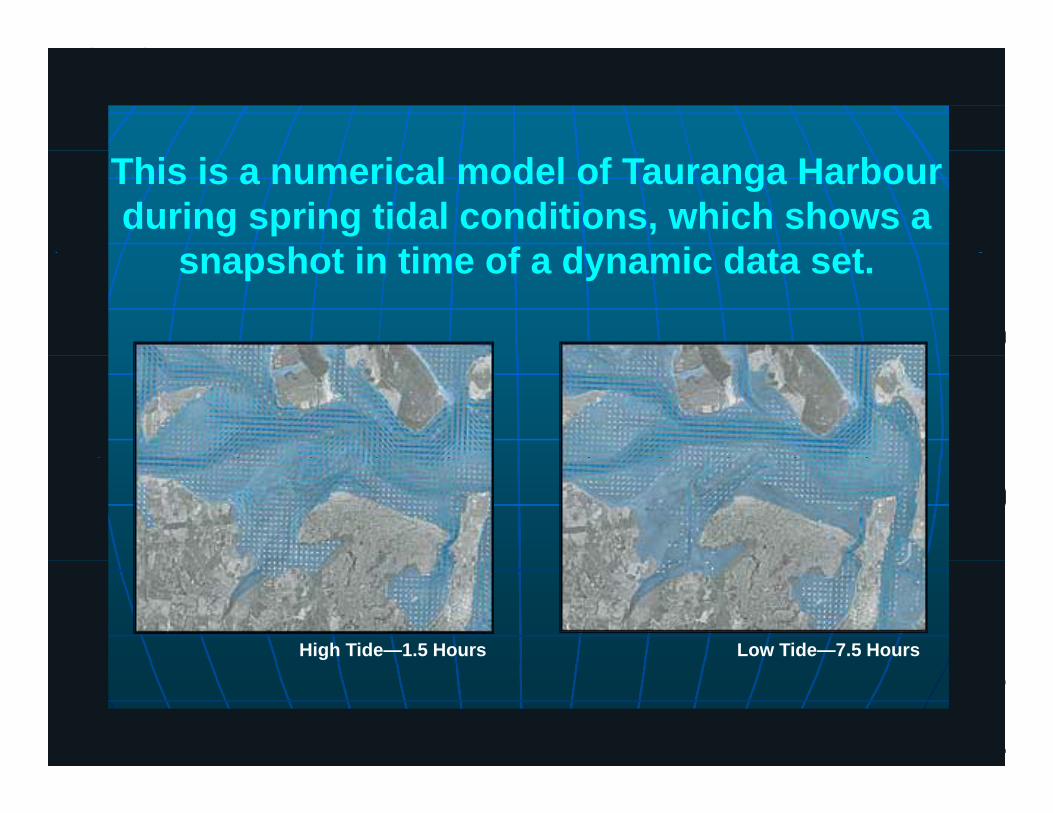
This is a numerical model of Tauranga Harbour during spring tidal conditions, which shows a
h t i ti f d i d t tsnapshot in time of a dynamic data set.
High Tide—1.5 Hours Low Tide—7.5 Hours
Tauranga Harbour Tidal MovementsEnvironment Bay of Plenty
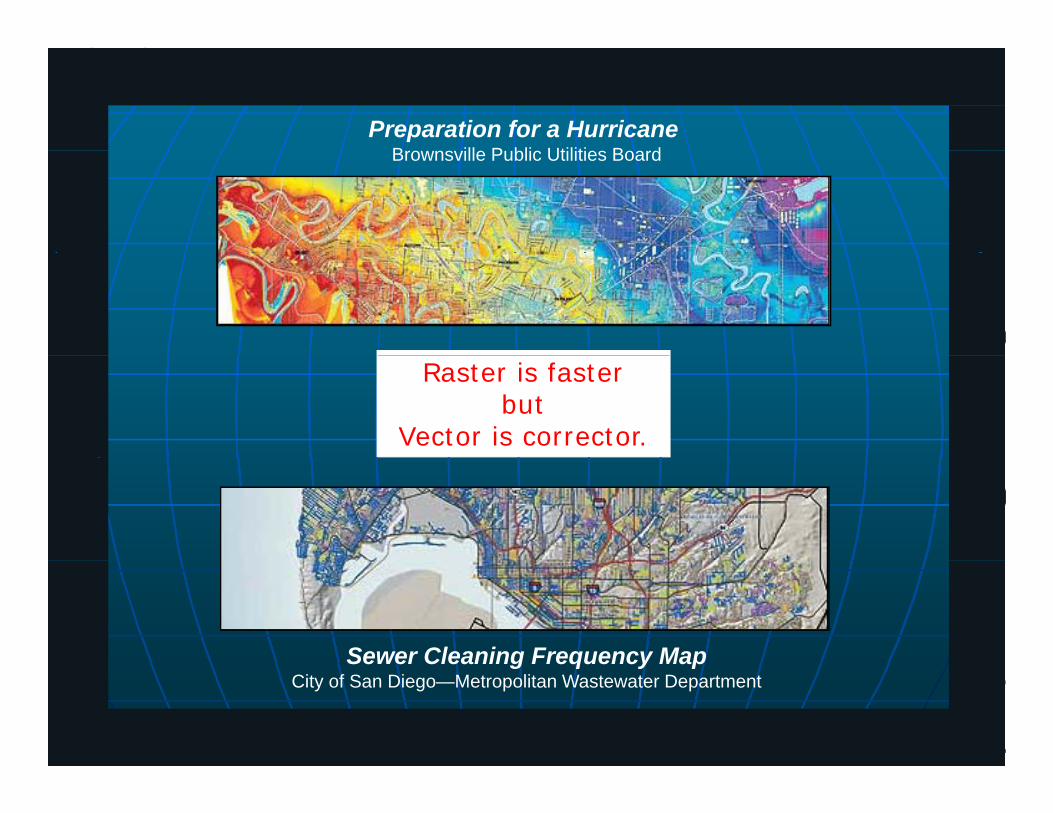
Preparation for a Hurricane B ill P bli Utiliti B dBrownsville Public Utilities Board
Raster is faster but
Vector is corrector.
Sewer Cleaning Frequency Map
http://www.esri.com/mapmuseum/mapbook_gallery/volume19/wastewater2.html
Sewer Cleaning Frequency MapCity of San Diego—Metropolitan Wastewater Department

Points lines and polygons can be used in Points, lines, and polygons can be used in modeling utility service and repairs.
Sewer Mains by Date Installed City of San Diego—MWD
Pipe Replacement Valve Isolation Analysis
Water Utility Modeling at the Truckee Donner Public Utility District
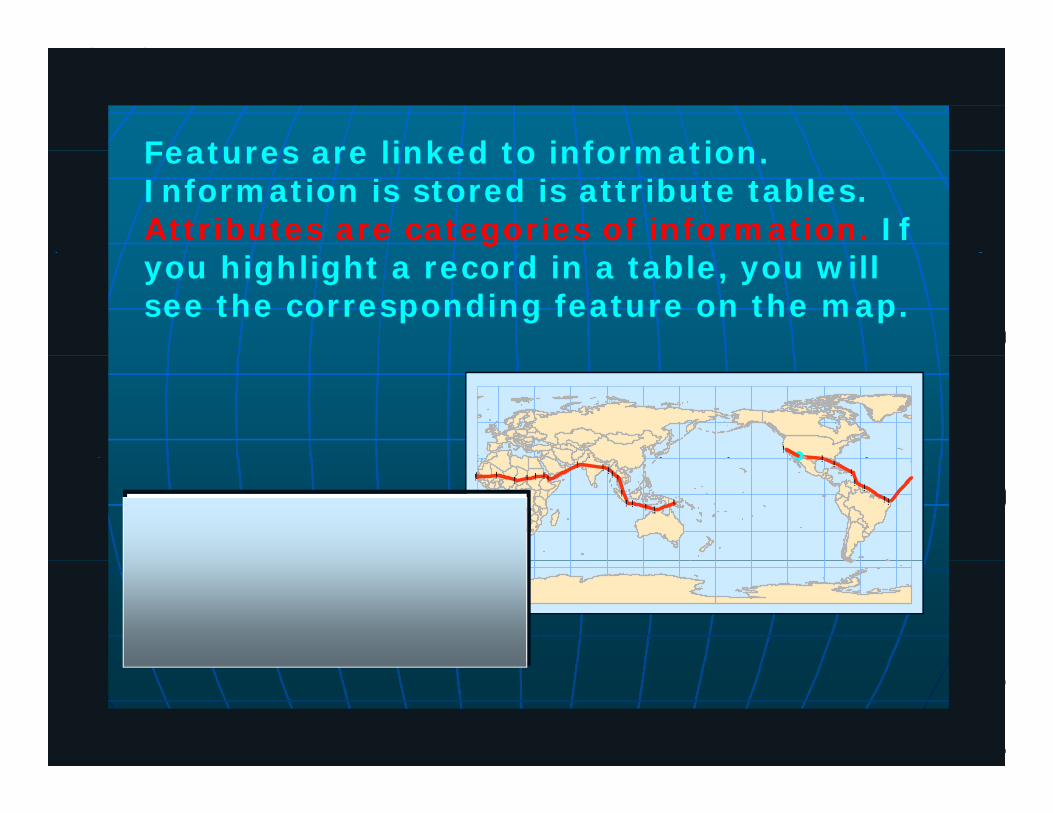
Features are linked to information Features are linked to information. Information is stored is attribute tables. Attributes are categories of information. If you highlight a record in a table, you will see the corresponding feature on the map.
! !!
! ! !!! !
! !
!! ! ! ! ! ! !! ! ! ! !
!! ! ! !
!Shape* COUNTRY NAME CA ELEVATION PRECIP ARRIVAL DEPARTURE
Point USA Tucson N 1045 300 5/21/1937 5/22/1937
Point USA New Orleans N 0 1700 5/22/1937 5/23/1937
Point USA Miami N 24 1700 5/23/1937 6/1/1937
Point U SA Tucson N 1045 300 5/21/1937 5/22/1937
Point Puerto Rico San Juan Y 36 1700 6/1/1937 6/2/1937
Point Venezuela Caripito N 126 1700 6/2/1937 6/3/1937
Point Suriname Paramaribo Y 11 2400 6/3/1937 6/4/1937
Point Brazil Fortaleza N 15 1200 6/4/1937 6/6/1937
Point Brazil Natal N 7 1200 6/6/1937 6/7/1937
Point Senegal SaintLouis N 21 500 6/8/1937 6/8/1937

Attributes are not the only kind of information that can belong to a feature. Pictures, text documents, and Web pages
S ER GE
Pictures, text documents, and Web pagescan also be related to features.
TEXA
S
WEB
ST
ORAN
G
WESTERN
UNION
ZONING ZIP_CODE OWNER_NAM E ADDRESS BD_RMS SALE_PRICE SQ_FT BTH_RM S POOLCOLTON
_ _ _ _ _ _R-1 92373 REDWOOD, CHAUNCEY 1004 OHIO ST 2 83600 1208 1.5 NR-1 92373 HARRISON, BLANCHE 940 COLUMBIA 2 109500 1180 1.5 N
R-1 92373 BARNES, HENRY 901 WA SHINGTON ST 3 166500 1902 2 YR-1 92373 HOUSEN, JA CK 903 WEBSTER ST 2 93500 1566 2 NR-1 92373 TING, HONG 835 WA SHINGTON ST 2 84900 1196 1.5 NR-1 92373 PLUNK, SANDY 822 COLUMBIA 2 112500 1567 2 NR-1 92373 GONZALEZ, BOB 1148 LAWTON ST 3 110500 1498 2 NR 1 92373 MCGUNIGLE HEATHER 505 W BROCKTONAV E 2 92700 858 1 NR-1 92373 MCGUNIGLE, HEATHER 505 W BROCKTON AV E 2 92700 858 1 N
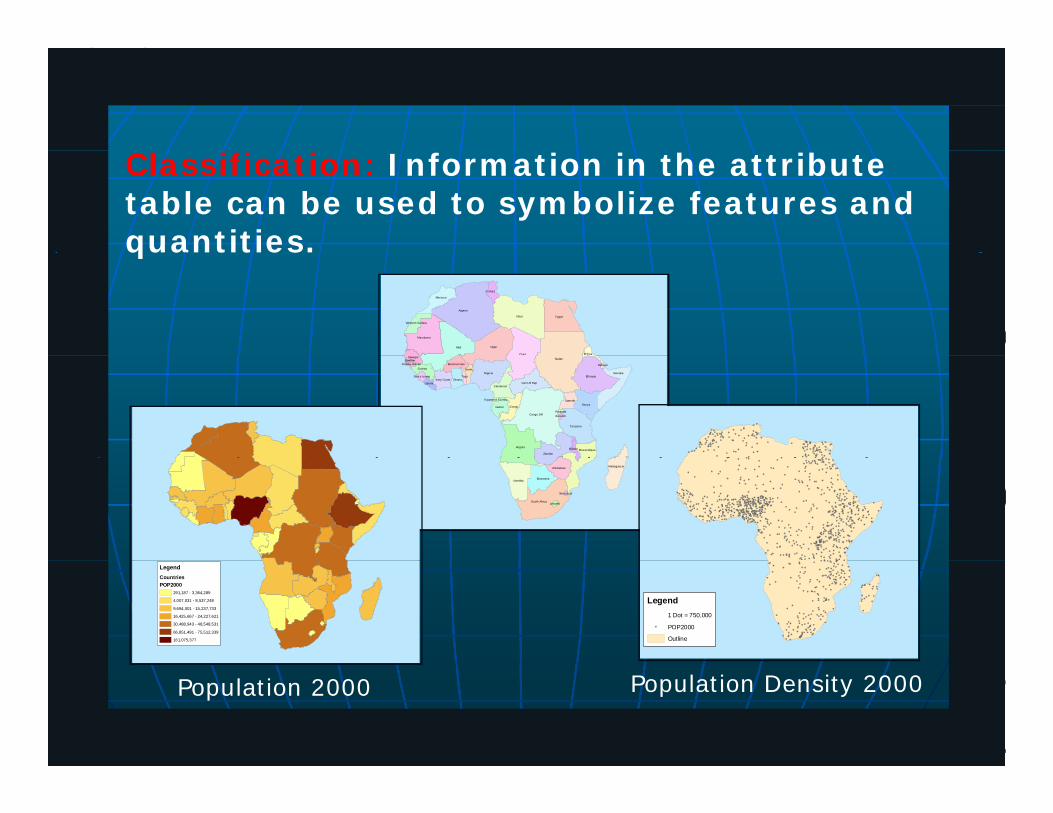
Classification: Information in the attribute table can be used to symbolize features and quantities. q
Alger ia
Libya
Mali
Chad
Niger
Egypt
Mauritania
Morocco
Tunisia
Eritrea
Western Sahara
Sudan
Congo DR
Angola
EthiopiaNigeria
Zambia
Tanzania
Kenya
Somalia
Mozambique
Congo
Cent Af RepCameroon
Gabon
Ghana
Guinea
Uganda
Ivory Coast
Senegal
Burkina Faso
Benin
Malawi
Liberia
TogoSierra Leone
BurundiRwanda
Djibout iGuinea-BissauGambia
Equatorial Guinea
South Afr ica
NamibiaBotswana
MadagascarZimbabwe
Lesotho
Sw aziland
LegendCountriesPOP2000
291,187 - 3,364,289
4,007,031 - 8,537,248
9,694,001 - 15,237,733
16,425,667 - 24,227,621
30,488,943 - 48,548,531
66,851,491 - 75,512,339
161,075,377
Legend1 Dot = 750,000
POP2000
Outline
Population 2000 Population Density 2000

Image
IMAGES
Image Processing
SystemSTATISTICAL
REPORTSMAPS
Statistical AnalysisSystem
MapDigitizingSystem
SpatialDataBase
Attribute DataBase
Database Management
System
Geographic AnalysisSystem
CartographicDisplay System
STATISTICS &TABULAR DATA
ANALYSISy
MAPS

Data Acquisition
PreprocessingNAME CA ELEVATION PRECIP ARRIVAL DEPARTURE
Tucson N 1045 3005/21/1937 5/22/1937
New Orleans N 0 17005/22/1937 5/23/1937
Miami N 24 17005/23/1937 6/1/1937
San Juan Y 36 17006/1/1937 6/2/1937
Caripito N 126 17006/2/1937 6/3/1937
Paramaribo Y 11 24006/3/1937 6/4/1937
Fortaleza N 15 12006/4/1937 6/6/1937
Natal N 7 12006/6/1937 6/7/1937
SaintLouis N 21 5006/8/1937 6/8/1937
Data Management
Manipulating & Analysis
Product Generation
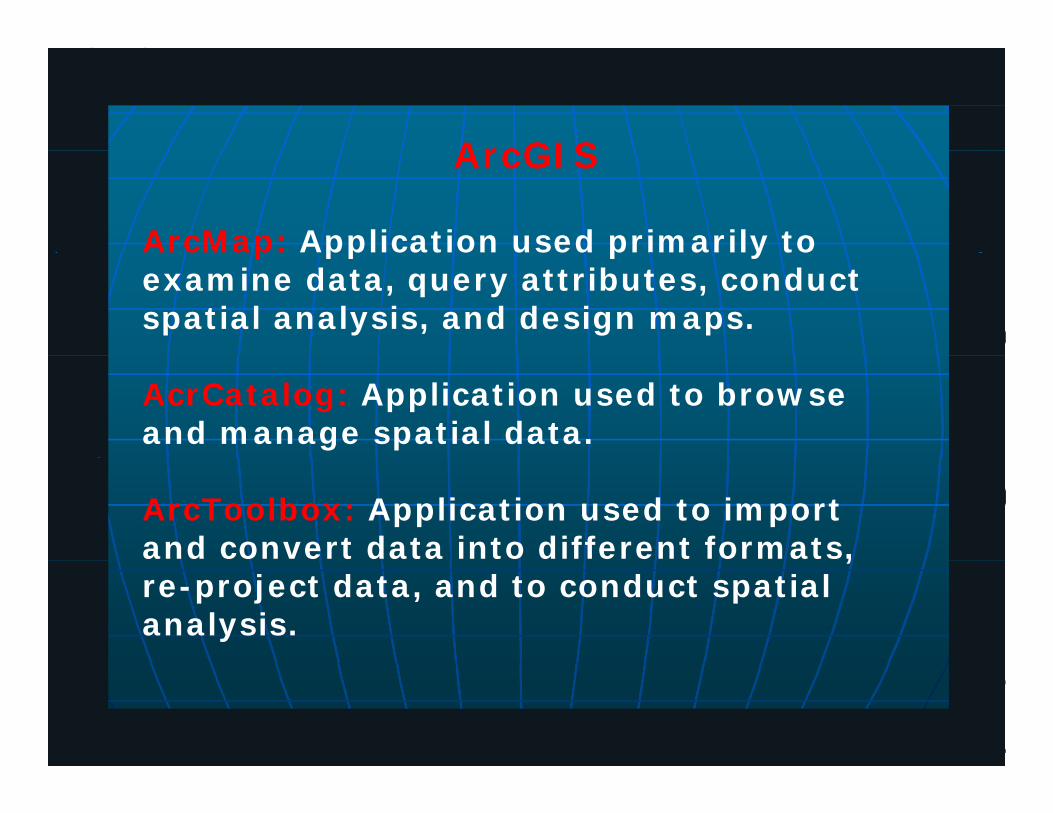
ArcGISArcGIS
ArcMap: Application used primarily to p pp p yexamine data, query attributes, conduct spatial analysis, and design maps.
AcrCatalog: Application used to browse and manage spatial data.
ArcToolbox: Application used to import and convert data into different formats, ,re-project data, and to conduct spatial analysis.

Spatial AnalysisSpatial Analysis
Analyze the relationship between and among hi f tgeographic features
TopologicallyDirectionallyProximally
Conduct advanced spatial analysis
C ti itConnectivityContainment
ContiguityContiguity

Dual Map Analysis and Modeling
Selection: Selected features from one layer Selection: Selected features from one layer are used to select features of another layer.
Overlay: A new layer is generated by performing an overlay operation on two input layers.
Models: Constructed from two or more map Models: Constructed from two or more map inputs.

What is it’s benefit? Used to understand spatial relationships in your data (both raster and vector).
How does it work? By imposing a grid on multiple map layers and describing the attributes of each grid locationlocation.
Used for surface analysis: Contours, Hillshade, Slope, Viewshed, Aspect, and Cut/Fill.Viewshed, Aspect, and Cut/Fill.
Used to answer the question: “What is the best location?”

Data Visualization —Three-dimensional visualization of your GIS data for data
l ti d th i exploration and synthesis
California Water—21st Century Gold U.S. Bureau of Reclamation

Interactive Navigation Interactive navigation Interactive Navigation —Interactive navigation tools to explore, display, and query your three-dimensional data
Surface Creation and Analysis —Creation and analysis of surface data for sophisticated modeling, viewing, and analysis g, g, y
3D Symbols —Support for hundreds of three-3D Symbols —Support for hundreds of three-dimensional symbols to enhance the display and realism of your data
Fly-Through Paths and Animations —Creation of advanced fly-through and animations

ArcPad provides field-based personnel with the ability to capture, analyze, and display the ability to capture, analyze, and display geographic information.
Can integrate input from GPSreceivers, rangefinders, and digital cameras.

Geocoding (Address Matching) Geocoding (Address Matching)
Geocoding helps users pinpoint addresses on maps and calculate a route to them maps and calculate a route to them.
With ArcPad StreetMap users have access to With ArcPad StreetMap, users have access to street-level geocoding and scale-dependent reverse geocoding in their ArcPad applications.
Find your location by:•Tapping on the map display •Tapping on the map display •Typing an address or city name •Using input from a GPS unit •Entering x,y coordinates g ,y

ArcPad Templates
Infrastructure and UtilitySeptic System Inspection TemplateSample data is included for parcels waterlines
ArcPad Templates
Sample data is included for parcels, waterlines, sewer lines, streets, septic, and soils.
Storm Water Inlet Inventory TemplateIncluded is a data entry form that collects information for inlet type, grate style, ownership, physical condition, road name, and more.
Storm Water Management ToolThis tool includes a data collection form for recording storm water data in compliance with the National Pollution Discharge Elimination System guidelines.
Storm Water Outfall TemplateInformation, such as pipe diameter, system type, material Information, such as pipe diameter, system type, material type, and receiving water, can be collected.
Water/Wastewater/ESRI® Geographic Information System Solutions

ArcGISArcGIS
Three levels of functionality, ranging from y, g gbasic to advanced.
ArcViewArcViewArcEditorA I fArcInfo
Each requires a licenseEach requires a license.

Arc Hydro: GIS for Water ResourcesArc Hydro: GIS for Water Resources
• Arc HydroArc Hydro– An ArcGIS data model
for water resources– Arc Hydro toolset for
implementationF k f li ki– Framework for linking hydrologic simulationmodels
The Arc Hydro data model andapplication tools are in the publicdomain

San Antonio Regional Watershed Modeling SystemGeospatial Data:City, County
g g y
“Bring the models together” SARA, othertogether
Modeling System
Rainfall Data:Rain gagesNexrad
Calibration Data:FlowsWater QualityQ y
Floodplain Capital Water qualityManagement
IntegratedRegional Water
ImprovementPlanning Flood
Forecasting
q yplanning
Resources planningg

GIS ft GIS software can:
reduce operating costsreduce operating costs
eliminate data redundancy
increase data integration and efficiency
automate analysis processes
access the information in your facilities access the information in your facilities management system.

Planning support systemsPlanning support systems
Planning support systems can measure and compare performances of indicators for land use, employment, performances of indicators for land use, employment, transportation, and natural resources to name a few.
Growth Strategies Growth Strategies
What if? Scenarios
Civil engineers use GIS for work in sitedevelopment, hydraulics, hydrology, p , y , y gy,surveying, transportation, planning, and public works.

GIS for PlanningGIS for Planningand
Engineering
•Water distribution system planning y p g•Population and demand projections •Groundwater management/modeling•Watershed modeling •Water quality monitoring •Hazardous materials tracking•Underground tank management

GIS for PlanningGIS for Planningand
Engineering
•NPDES compliance•Well log and data management •Well log and data management •Site analysis •Development review and approval •Development review and approval •Right-of-way engineering •Water flow analysis y•Automated mapping •Underground service alert
GIS for Infrastructure ManagementGIS for Infrastructure Managementand
Construction
GIS aids in tracking information related to j t it t ti k d projects, permits, construction work order
management, inspections, as-builts, and so forth.
Store and display images in conjunction with pipe Store and display images in conjunction with pipe footage reading and a description of the pipe conditions and defects.
Maps, drawings, and pictures can also be associated with valves, manholes, drop inlets, and other features.

GIS for Finance GIS for Finance and
Administration
GIS can be used for tasks such as:
•Capital improvement project tracking•Customer information service•Budget forecasting•Facility inventory analysis•Customer billing•Customer billing•Rate justification •Complaint tracking R l •Real property

GIS for Operations GIS for Operations and
Maintenance
Allow users to visualize scheduled work, ongoing activities, recurring maintenance problems, and historical information.
Can be used to analyze specific properties or services h b i d b h that may be impacted by such events as stoppages,
main breaks, drainage defects, and so forth
GIS can perform many other O&MGIS can perform many other O&Mtasks, including work order and warehouse inventory management

Case Study S F i ' Case Study - San Francisco's Peninsula and Alameda WatershedsManagement With GIS
The San Francisco Bay Area water supply system delivers 200,000 gallons of water per day to Bay Area users via the Hetch-Hetchy system--from a source 167 miles distant Hetch Hetchy system from a source 167 miles distant. Officials hired consultants to `design a GIS database which was capable of complete watershed management.
The basic data types included:rare or endangered plants and animalsarchaeological and historic featuresgeology and soils elevationhydrology vegetationhabitats fisheriesland status roads & trailsland status roads & trailsutilities recreation
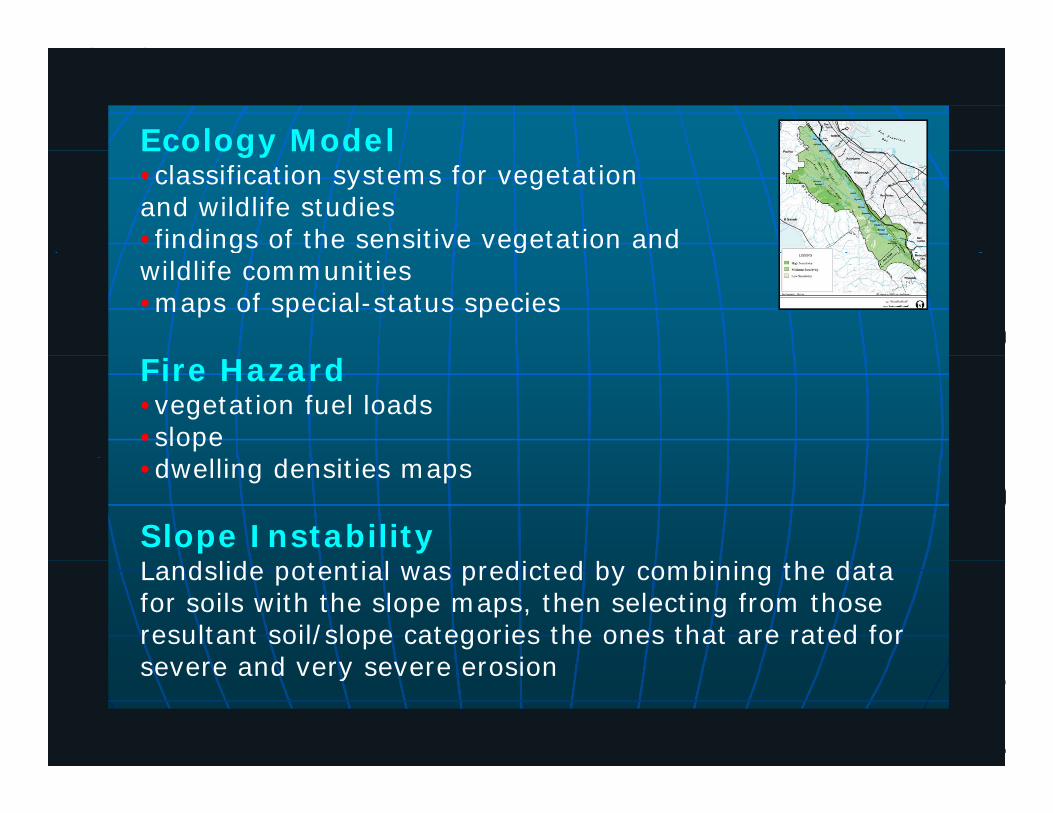
Ecology ModelEcology Model•classification systems for vegetationand wildlife studies •findings of the sensitive vegetation and g gwildlife communities •maps of special-status species
Fire Hazard•vegetation fuel loads•sloped ll d•dwelling densities maps
Slope Instabilityd l d l d d b b h dLandslide potential was predicted by combining the data
for soils with the slope maps, then selecting from those resultant soil/slope categories the ones that are rated for severe and very severe erosion severe and very severe erosion

Cultural Sensitivity Cultural Sensitivity •historic structures•prehistoric archaeological sites
Water Quality Modelsize of the watershed rainfall intensitydrainage buffer zones slopes & soil characteristics vegetative cover wildlife concentrations
Soil attributes were analyzed for determining water quality vulnerability to potential contaminations f om bacte ia n t ient t bidit contaminations from bacteria, nutrient, turbidity, and various volatile organic compounds.

RESULT:RESULT:Watershed Plan
•10 percent of the watershed has •10 percent of the watershed has no conditions that receive a high sensitivity rating
•35 percent have two or more conditions with high gsensitivity ratings.
•high sensitivity ratings their relationship •high sensitivity ratings, their relationship to one another, and to roads and reservoirs directed management policies
http://www.esri.com/news/arcnews/spring03articles/gold-in-the-water.html

Better decisions through modelingand
mapping our worldESRI
M I f ti A Vi GIS b f d tMore Information on ArcView GIS can be found at:
http://www.esri.com/index.html
http://www.trimble.com/