Embed Size (px)
Citation preview

Introduction to R MarkdownIntroduction to R MarkdownStatistics, Visualization and More Using ”R”Statistics, Visualization and More Using ”R”
Natalie Badstuber, Julian Fick, Julia ReicherNatalie Badstuber, Julian Fick, Julia Reicher
29.04.201929.04.2019
1 / 561 / 56

2 / 56
Outline of today’s presentation
1. What is Rmd and why/when is it useful?
2. Introduction to using Rmd
3. Further applications of Rmd
3 / 56

Part 1: Part 1: What is Rmd and why/when is it useful?What is Rmd and why/when is it useful?
4 / 564 / 56
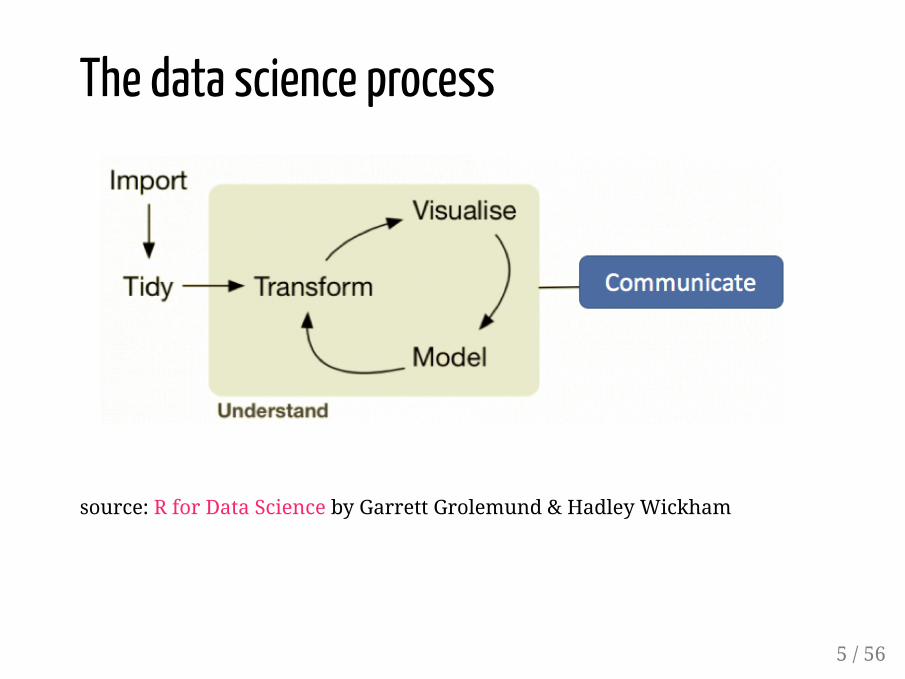
The data science process
source: R for Data Science by Garrett Grolemund & Hadley Wickham
5 / 56
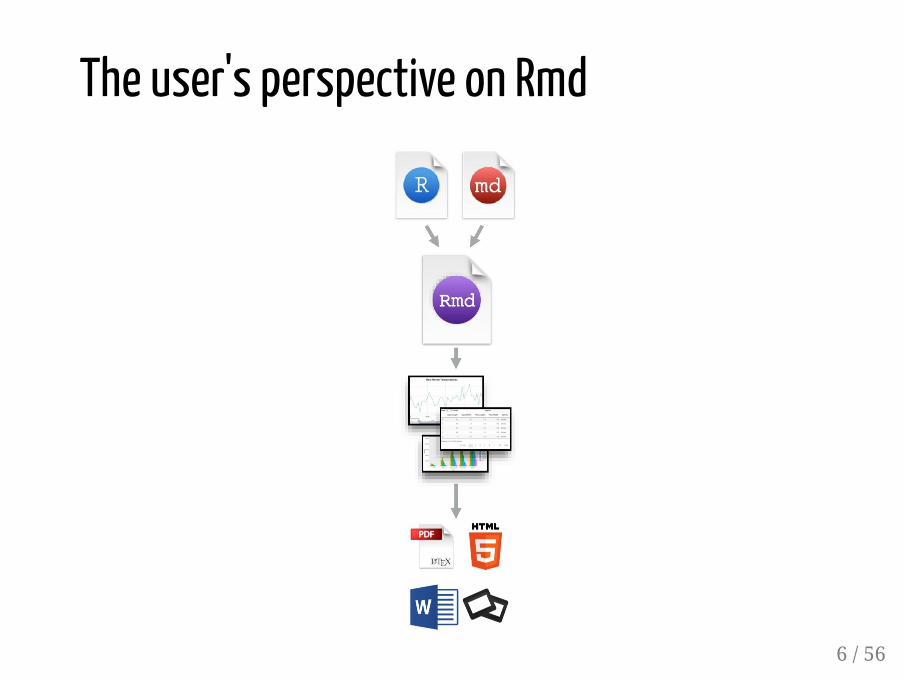
The user's perspective on Rmd
6 / 56

Work�ow: What's behind Rmd?
7 / 56
Starting from behind: What's the outcome?Let's have a look at the default Rmd-example in RStudio.
See some examples of Rmd-applications and possible outputformats at the R-Studio Gallery.
8 / 56
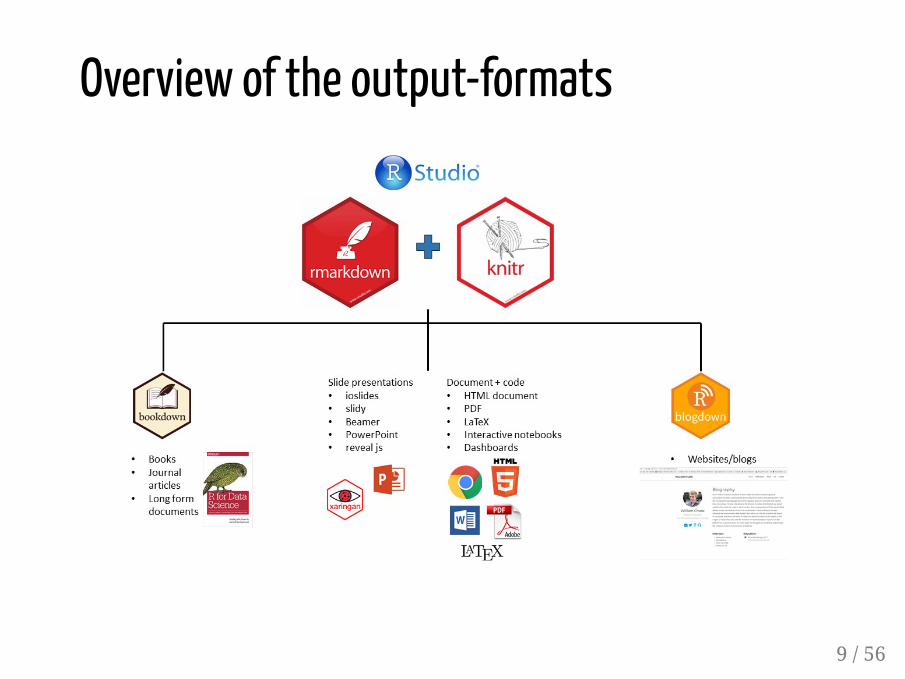
Overview of the output-formats
9 / 56

What purposes is Rmd for?(according to Hadley Wickham)
Communication with decision makers
Collaboration with other data scientists
Modern notepad
reproducibility
10 / 56

Advantages: Why using Rmd?Better comprehensibility
Ease of usage
"on the way"-usage (documentation)
easy to learn
Power of usage
multiple occassions
multiple output-formats (+ possibility to switch)
compatibility with other "languages"
11 / 56

When is Rmd not recommended?In general: The less need for communication the less is Rmdrecommended
12 / 56
Part 2: Part 2: Introduction to using RmdIntroduction to using Rmd
13 / 5613 / 56
Let's start using Rmd!Creating a new Rmd-�le
Comparison: ".R" vs. ".Rmd"
Three main elements: header, code chunks, markdown-text
Try rendering/knitting your �rst Rmd!
14 / 56
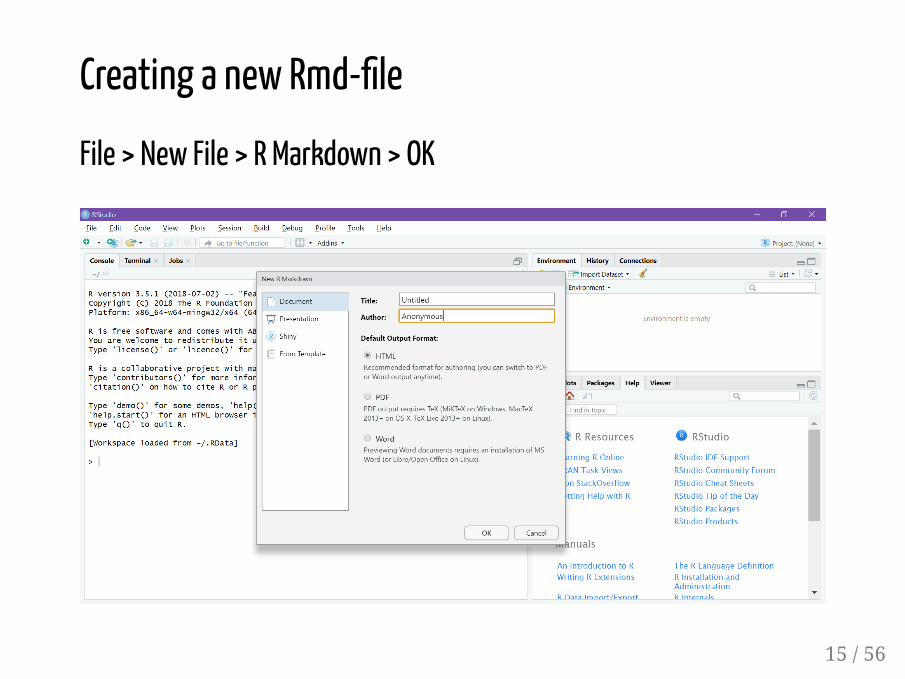
Creating a new Rmd-�le
File > New File > R Markdown > OK
15 / 56

Options in the scripts pane
Knit
Settings ⚙
'✔ Preview in Viewer Pane' shows knitted document next to help pane
'Output options' enables easy changes in YAML header concerning theoutput document type (e.g. inserting table of contents)
Insert a new code chunk
Several programming languages are possible
⇧ ⇩: Previous/next section or code chunk
Run Code chunks or lines
16 / 56

The so-called "YAML" headerconsists of:
---title: "Untitled"author: "Anonymous"date: "26 4 2019"output: html_document---
Multiple options are possible. Forexample you can specify the outputdocument:
---title: "Untitled"author: "Anonymous"date: "26 4 2019"output: html_document: fig_height: 4 fig_width: 6 keep_md: yes number_sections: yes theme: cosmo toc: yes---
Header
17 / 56
Exercise 1:Edit the YAML header of the default html_document
1. Change the document title to "My First Markdown Document" and theauthor to your own name.
2. Change the date to a format with dots between the numbers.
3. Include a table of contents and number the section headings.
4. Apply the theme "lumen".
18 / 56
Text formatting basics
19 / 56
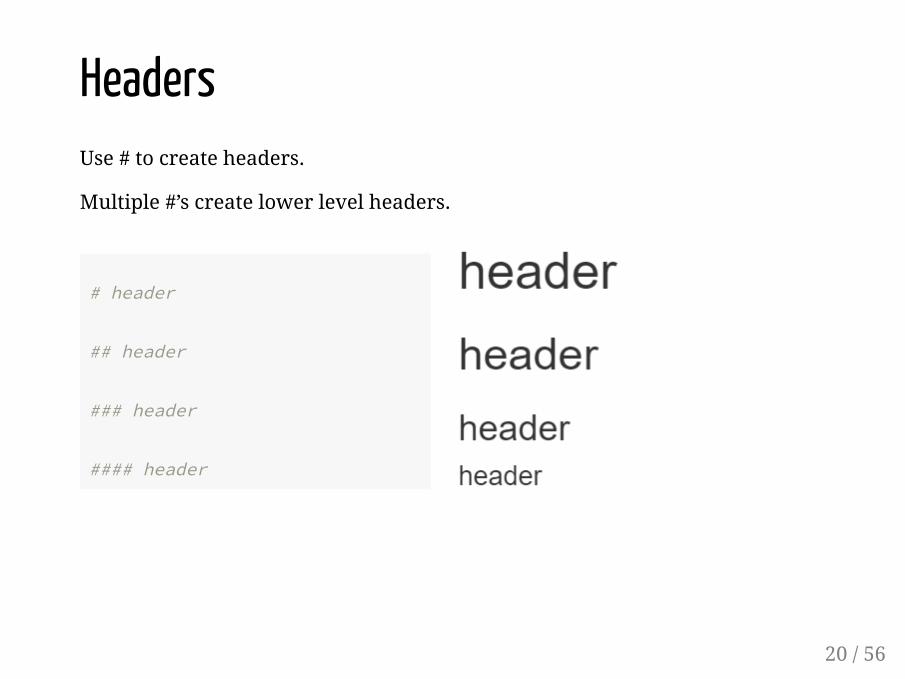
# header
## header
### header
#### header
HeadersUse # to create headers.
Multiple #’s create lower level headers.
20 / 56
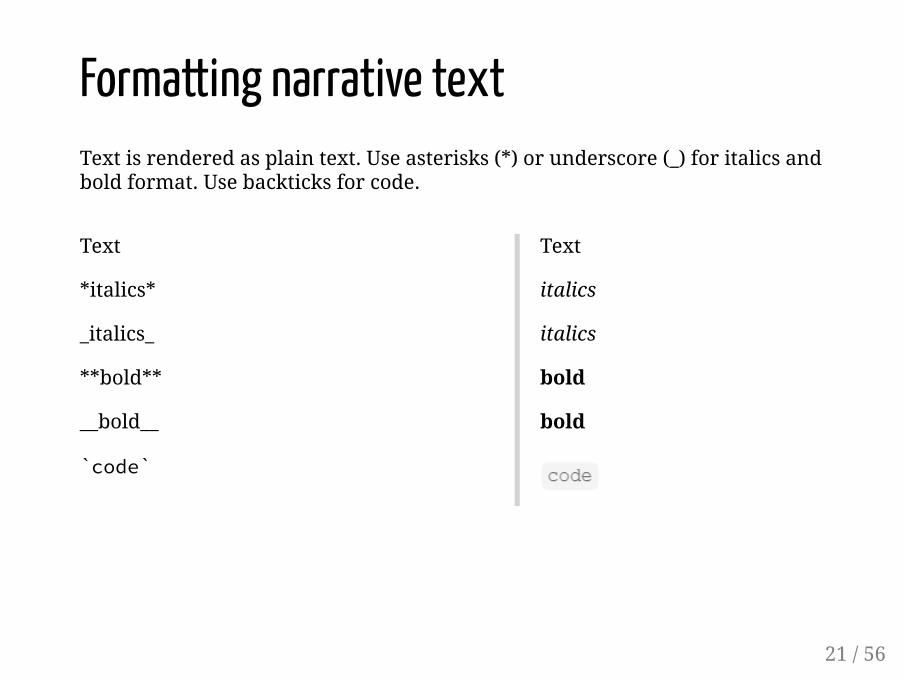
Text
*italics*
_italics_
**bold**
__bold__
`code`
Text
italics
italics
bold
bold
Formatting narrative textText is rendered as plain text. Use asterisks (*) or underscore (_) for italics andbold format. Use backticks for code.
21 / 56
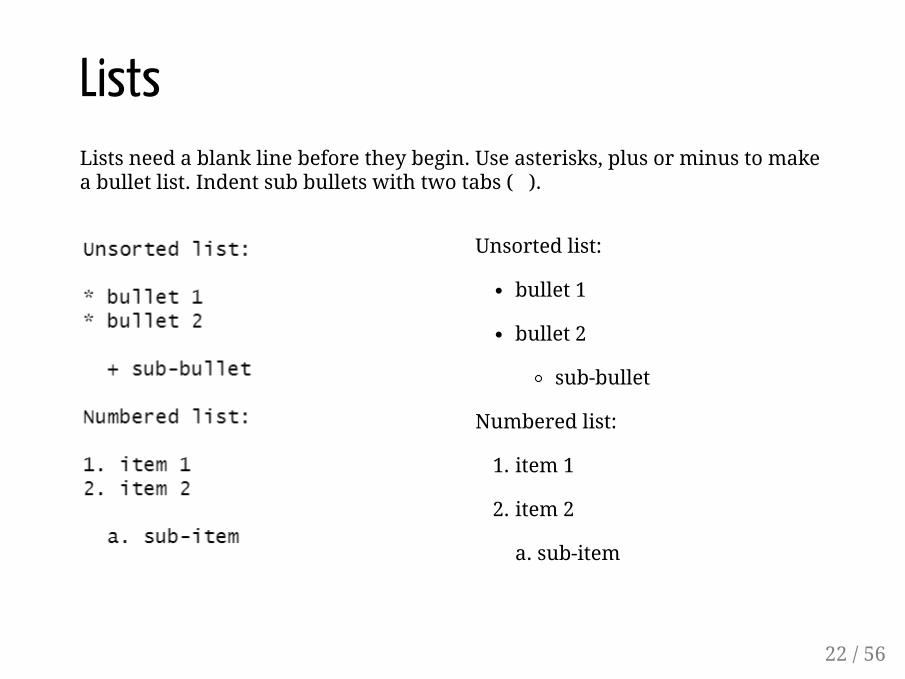
Unsorted list:
bullet 1
bullet 2
sub-bullet
Numbered list:
1. item 1
2. item 2
a. sub-item
ListsLists need a blank line before they begin. Use asterisks, plus or minus to makea bullet list. Indent sub bullets with two tabs ( ).
22 / 56
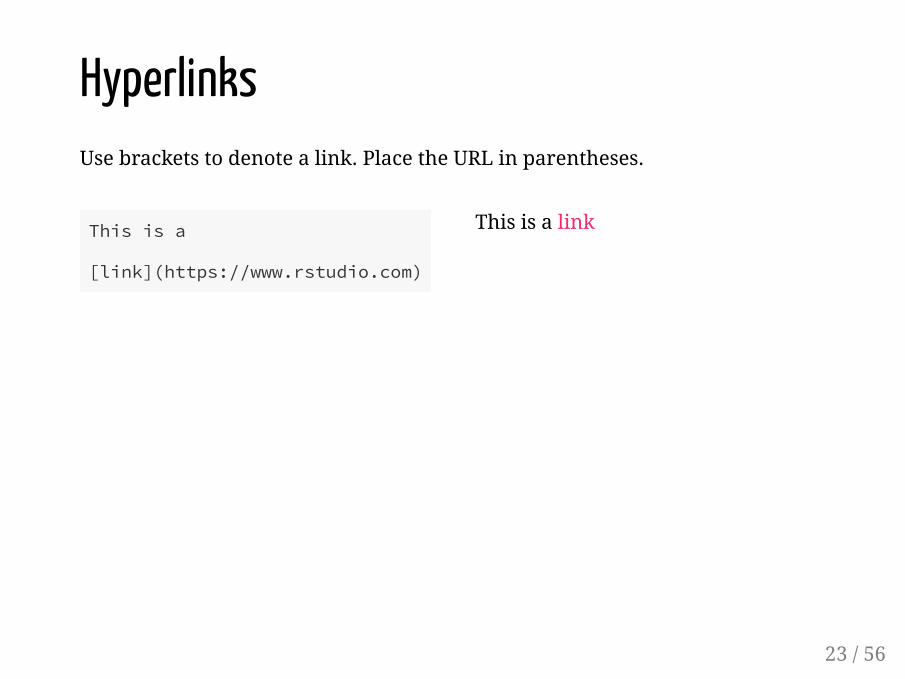
This is a
[link](https://www.rstudio.com)
This is a link
HyperlinksUse brackets to denote a link. Place the URL in parentheses.
23 / 56
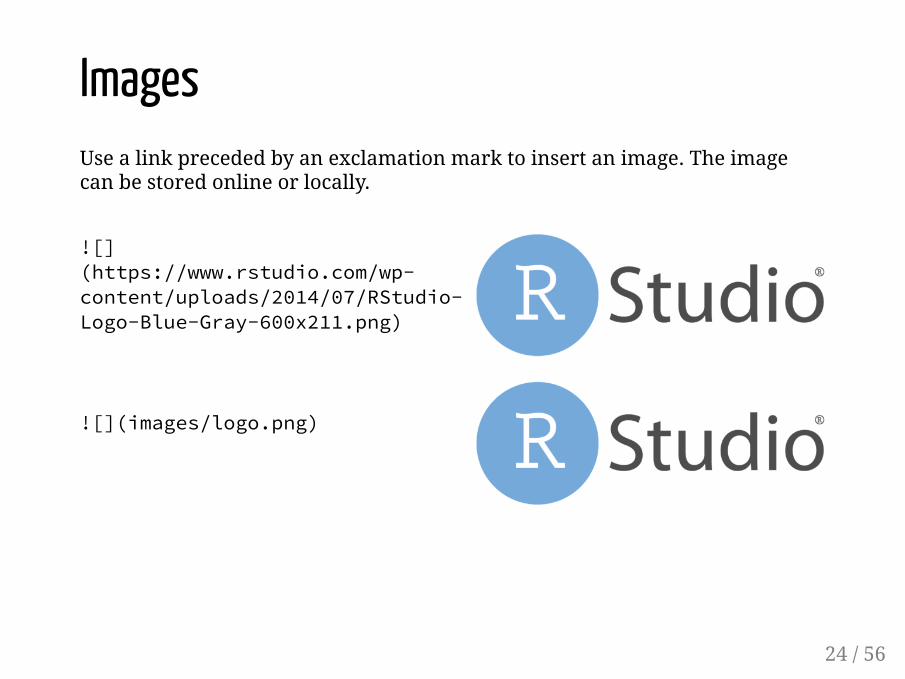


ImagesUse a link preceded by an exclamation mark to insert an image. The imagecan be stored online or locally.
24 / 56

According to Einstein, $E=mc^{2}$.
According to Einstein,$$E=mc^{2}$$
According to Einstein, .
According to Einstein,
EquationsWrite equations with latex math commands and surround them with dollarsigns. You can make inline and block equations.
E = mc2
E = mc2
25 / 56
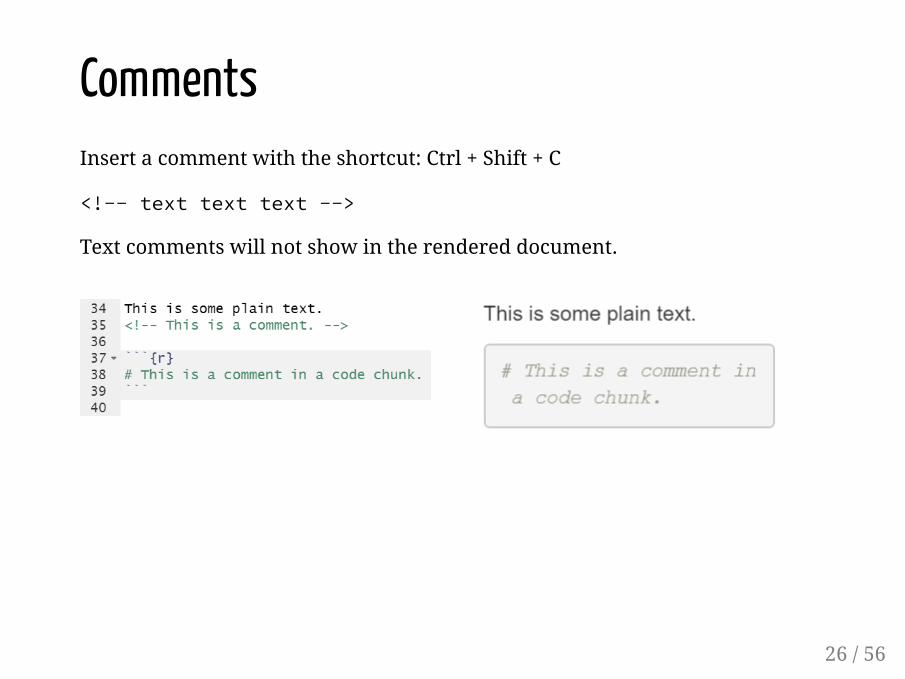
CommentsInsert a comment with the shortcut: Ctrl + Shift + C
<!-- text text text -->
Text comments will not show in the rendered document.
26 / 56
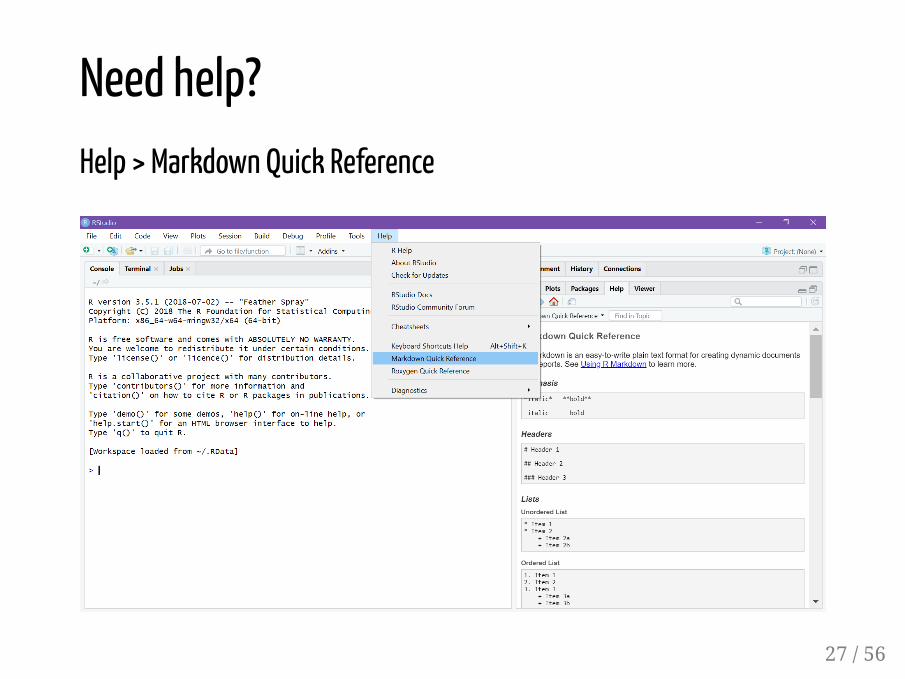
Need help?Help > Markdown Quick Reference
27 / 56
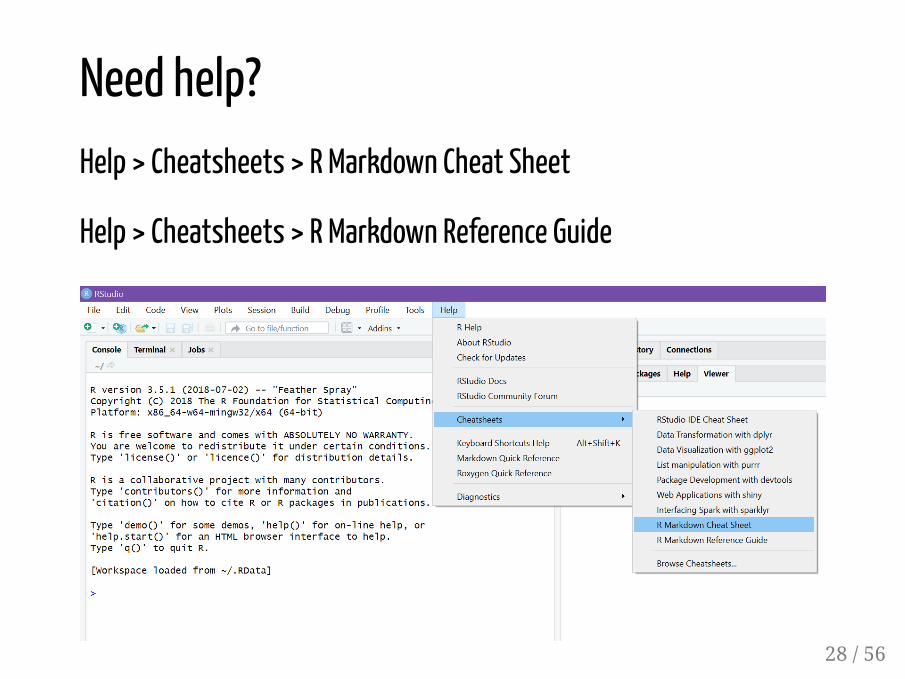
Need help?Help > Cheatsheets > R Markdown Cheat Sheet
Help > Cheatsheets > R Markdown Reference Guide
28 / 56
Exercise 2:Simple formatting changes in template
1. Change the word “simple” in the first paragraph from plain text to italics.
2. Insert a third level header called “Knit” before the paragraph “When youclick the…”.
3. In the second paragraph, the word “Knit” is bold. Also change the word“button” to bold.
4. Change the first paragraph. “HTML”, “PDF” and “MS Word documents”should be the bullets of an unordered list.
29 / 56
Exercise 3:Simple changes in the template
1. Create a hyperlink with the clickable text "this website" instead of the URL< http://rmarkdown.rstudio.com > in the first paragraph.
2. Make a new second order header “Distance” at the end of your document.Insert the following text below the header.
Driving is the controlled operation and movement of amotor vehicle. Road speed limits are used to set themaximum (or minimum, in some cases) speed at which roadvehicles may legally travel on particular stretches ofroad.
3. Add the following sentence with the equation displayed inline at the endof the text.
The equation for driven distance is distance=v*t.
30 / 56
R CodeInline Code
Code Chunks
Code Chunk Options
31 / 56
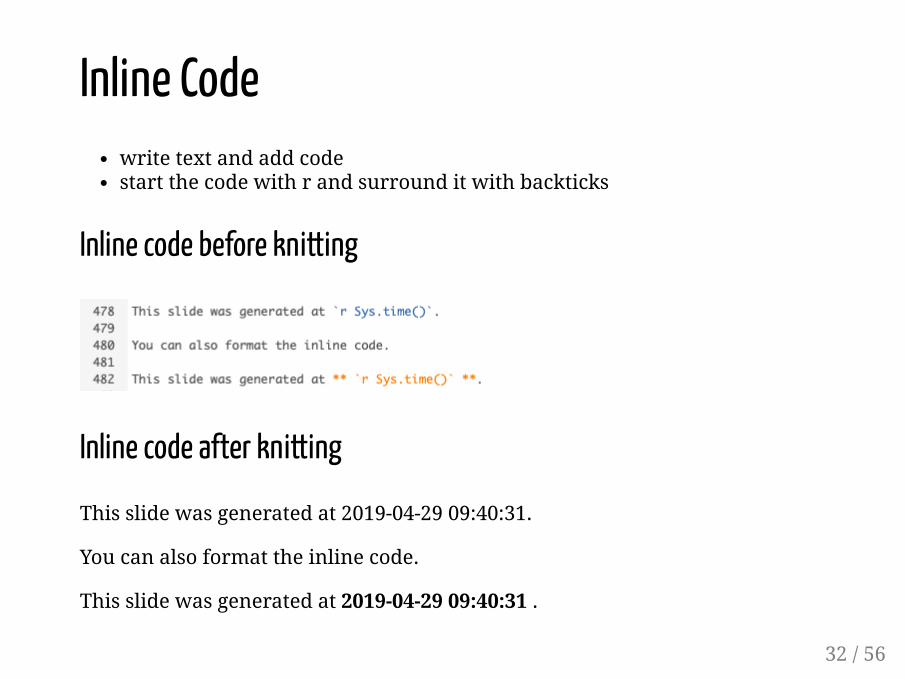
Inline Codewrite text and add codestart the code with r and surround it with backticks
Inline code before knitting
Inline code after knitting
This slide was generated at 2019-04-29 09:40:31.
You can also format the inline code.
This slide was generated at 2019-04-29 09:40:31 .
32 / 56
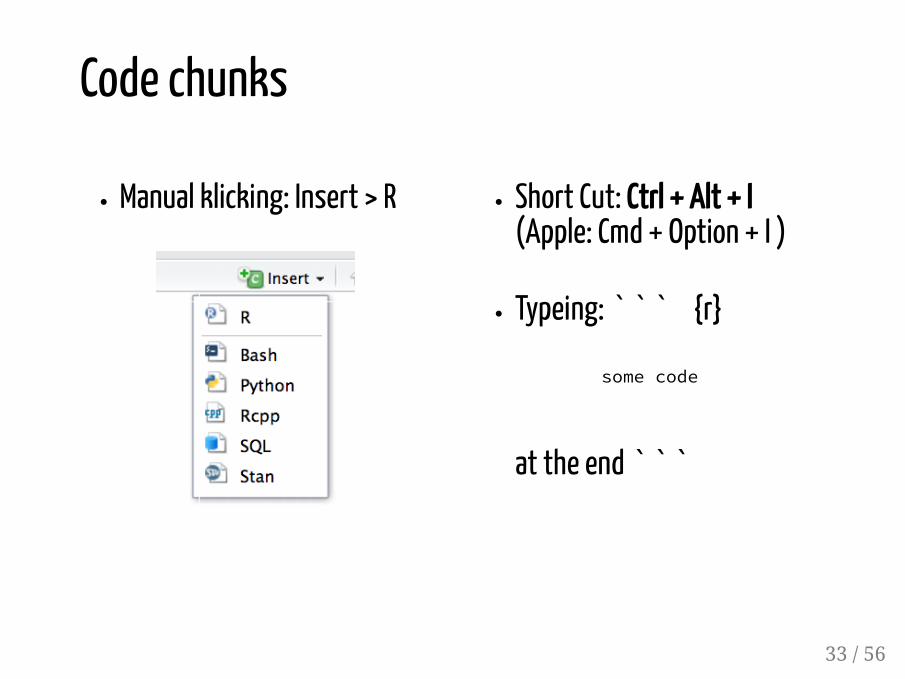
Manual klicking: Insert > R Short Cut: Ctrl + Alt + I(Apple: Cmd + Option + I )
Typeing: ``` {r}
some code
at the end ```
Code chunks
33 / 56
Code chunk optionslabel code chunks
echo
results
include
�gure height/width
comment
34 / 56
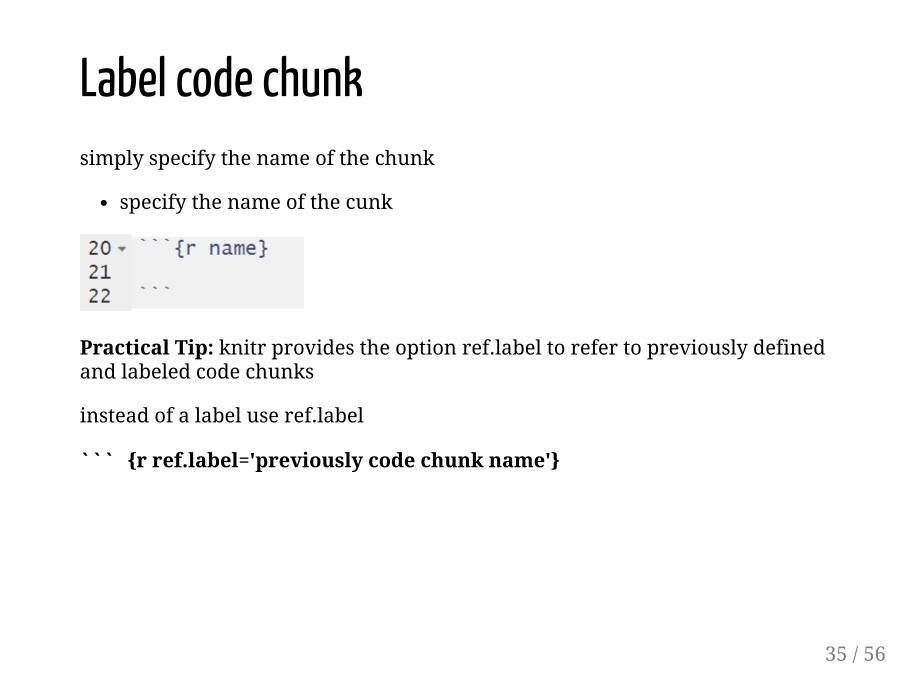
Label code chunksimply specify the name of the chunk
specify the name of the cunk
Practical Tip: knitr provides the option ref.label to refer to previously definedand labeled code chunks
instead of a label use ref.label
``` {r ref.label='previously code chunk name'}
35 / 56
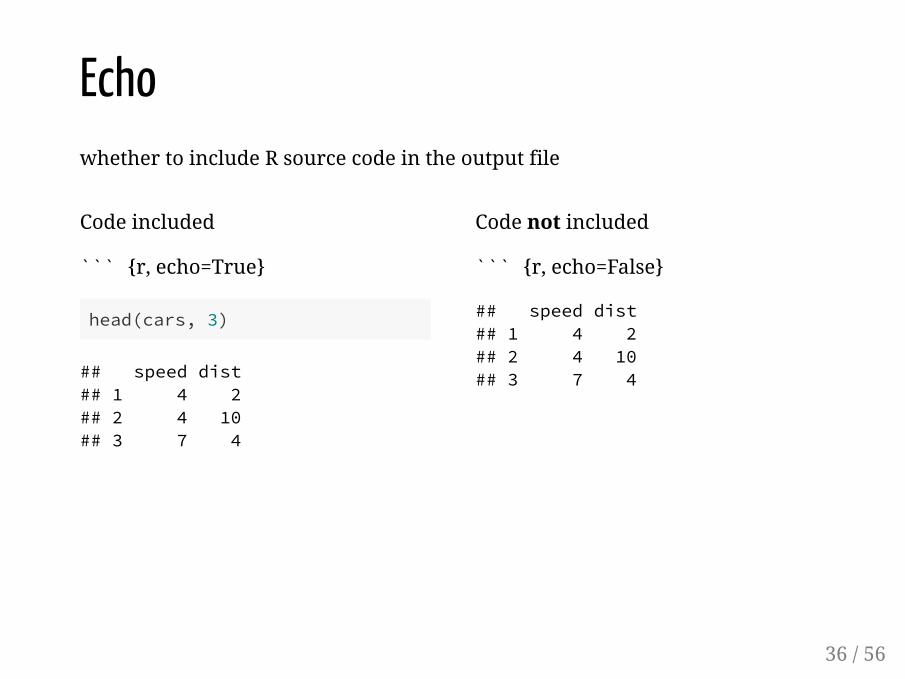
Code included
``` {r, echo=True}
head(cars, 3)
## speed dist## 1 4 2## 2 4 10## 3 7 4
Code not included
``` {r, echo=False}
## speed dist## 1 4 2## 2 4 10## 3 7 4
Echowhether to include R source code in the output file
36 / 56
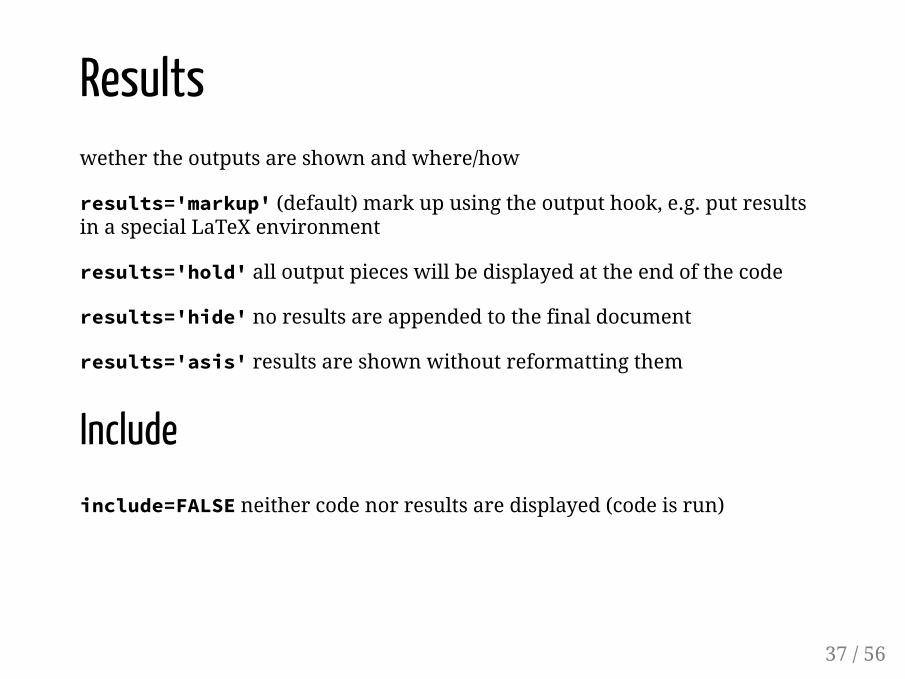
Resultswether the outputs are shown and where/how
results='markup' (default) mark up using the output hook, e.g. put resultsin a special LaTeX environment
results='hold' all output pieces will be displayed at the end of the code
results='hide' no results are appended to the final document
results='asis' results are shown without reformatting them
Includeinclude=FALSE neither code nor results are displayed (code is run)
37 / 56

�gure height/widthwidth and height of the plot in inches default: 7x4 You can change the defaultby specifing the figure hight/width, for example: fig.width = 4,fig.height = 3
plot(pressure)
38 / 56
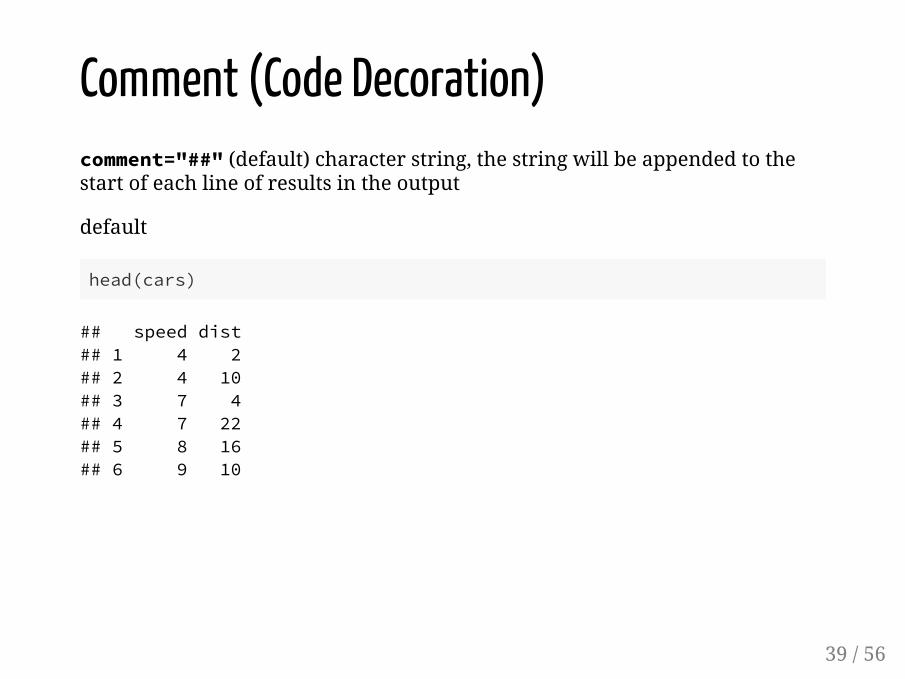
Comment (Code Decoration)comment="##" (default) character string, the string will be appended to thestart of each line of results in the output
default
head(cars)
## speed dist## 1 4 2## 2 4 10## 3 7 4## 4 7 22## 5 8 16## 6 9 10
39 / 56
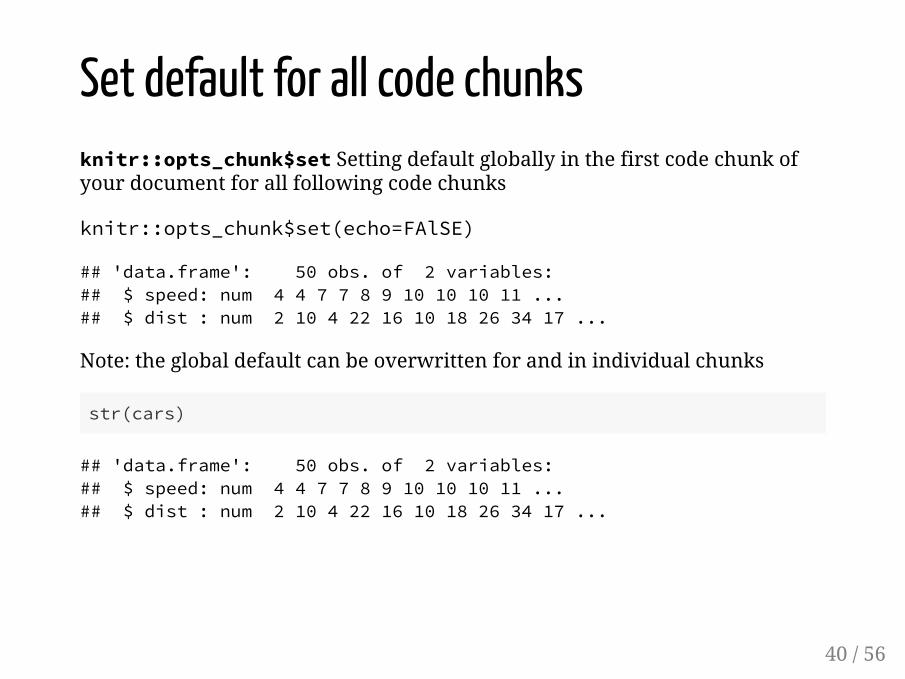
Set default for all code chunksknitr::opts_chunk$set Setting default globally in the first code chunk ofyour document for all following code chunks
knitr::opts_chunk$set(echo=FAlSE)
## 'data.frame': 50 obs. of 2 variables:## $ speed: num 4 4 7 7 8 9 10 10 10 11 ...## $ dist : num 2 10 4 22 16 10 18 26 34 17 ...
Note: the global default can be overwritten for and in individual chunks
str(cars)
## 'data.frame': 50 obs. of 2 variables:## $ speed: num 4 4 7 7 8 9 10 10 10 11 ...## $ dist : num 2 10 4 22 16 10 18 26 34 17 ...
40 / 56
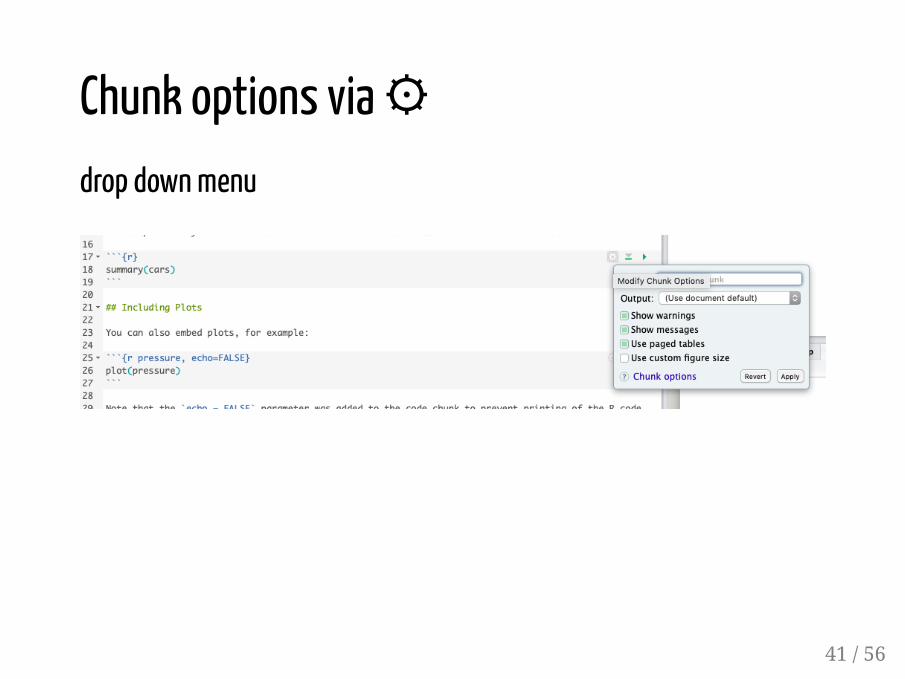
Chunk options via ⚙drop down menu
41 / 56
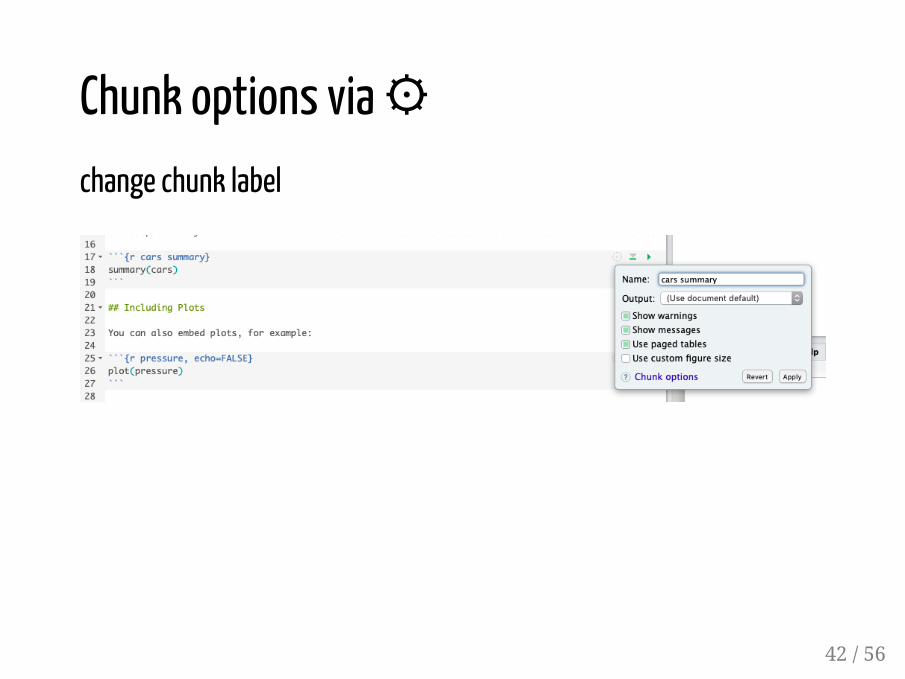
Chunk options via ⚙change chunk label
42 / 56
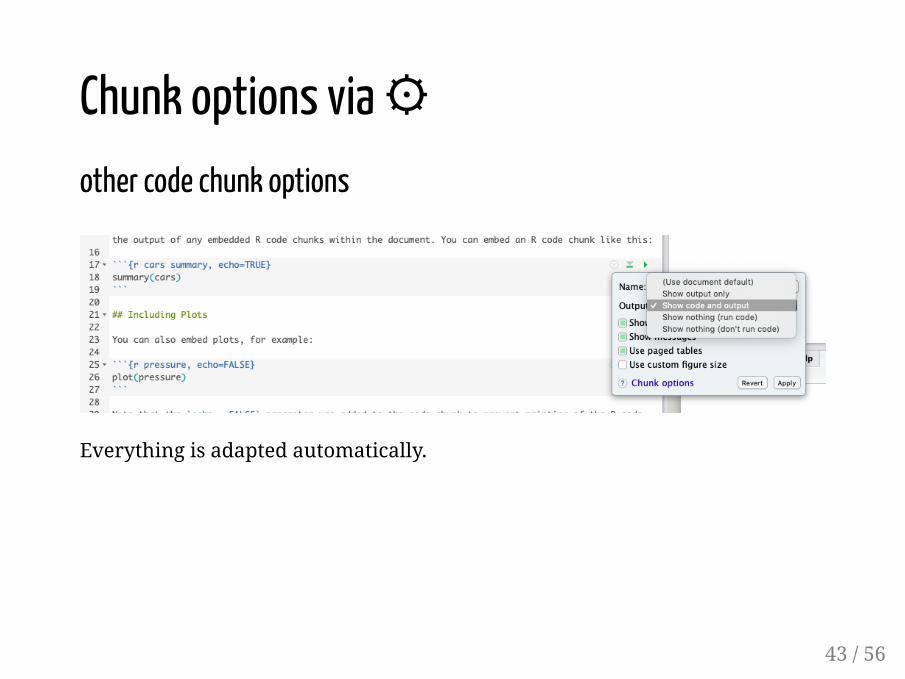
Chunk options via ⚙other code chunk options
Everything is adapted automatically.
43 / 56

Exercise 4:Edit code chunks
1. Edit the setup code chunk so that no code is displayed above results ofany chunk in the document.
2. Look at the code chunk labelled pressure. Consider the changes youmade in the 1st task: What code chunk option is now unnecessary andwhy? Delete it.
3. Change the size of the pressure plot. Set the code chunk options forheight (=4) and width (=6).
4. Edit the cars code chunk, which contains the summary of cars. Insert achunk option so that ## is not shown in the output table of the finaldocument.
44 / 56

Exercise 5:1. Insert a new code chunk labelled distance that plots a histogram of cars
distance variable. Use this code inside the chunk:
hist(cars$dist, main=NULL, xlab="Distance")
2. Alter the code chunk options (only of this chunk) so the code of the chunkis shown above the histogram.
3. What happens if you include the code chunk option eval=FALSE ? Try itout with the distance chunk and read cheatsheet or reference guide. Setit back to the default option.
4. Inline Code: Write the following sentence beneath the histogram andsubstitute xx and yy with two inline r codes:
The figure contains xx distance measurements with amean of yy ft.xx: use length()yy: use mean()
45 / 56
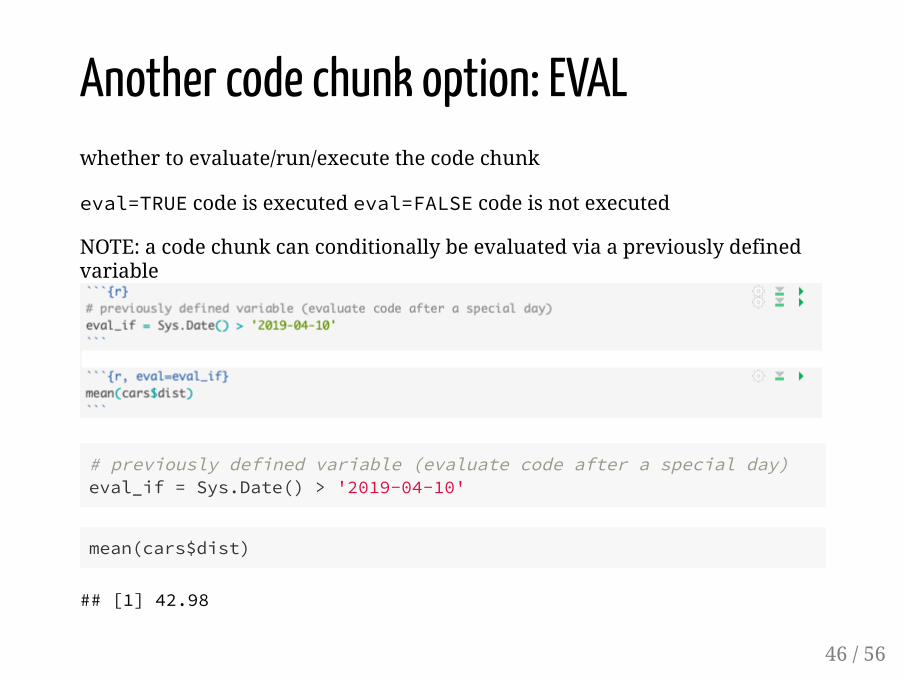
Another code chunk option: EVALwhether to evaluate/run/execute the code chunk
eval=TRUE code is executed eval=FALSE code is not executed
NOTE: a code chunk can conditionally be evaluated via a previously definedvariable
# previously defined variable (evaluate code after a special day)eval_if = Sys.Date() > '2019-04-10'
mean(cars$dist)
## [1] 42.98
46 / 56

Part 3: Part 3: Further applications of RmdFurther applications of Rmd
47 / 5647 / 56

Document Output Formatshtml_document
pdf_document
word_document
md_document
48 / 56

Presentation Output Formatsioslides_presentation
slidy_presentation
beamer_presentation
49 / 56
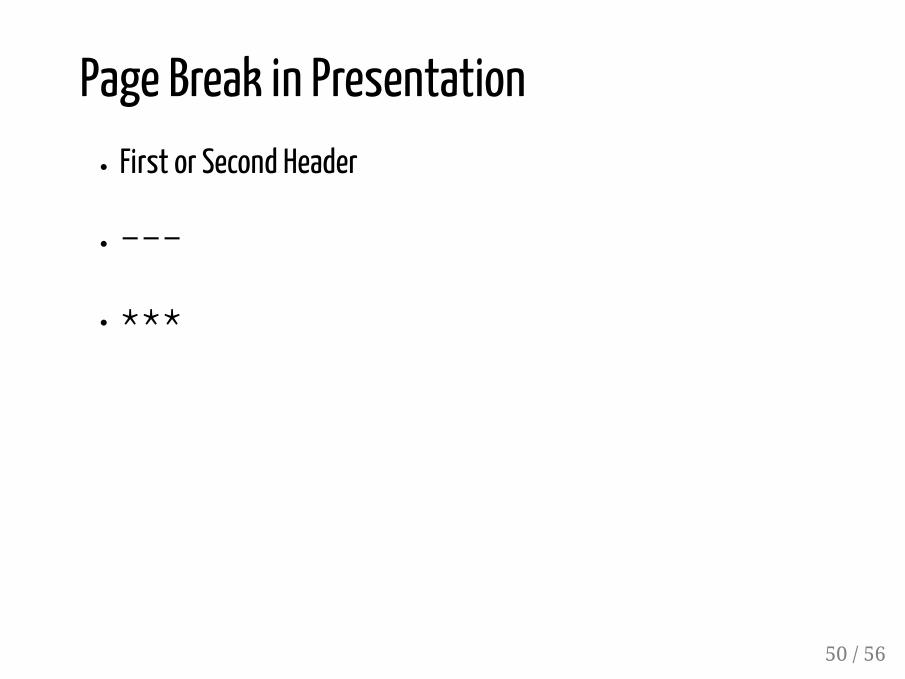
Page Break in PresentationFirst or Second Header
---
***
50 / 56
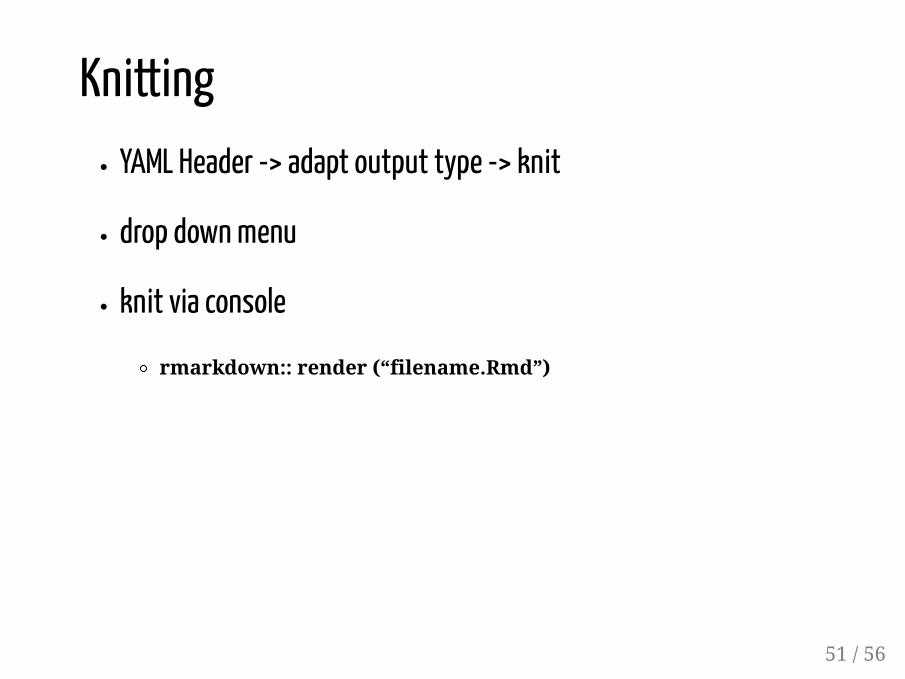
KnittingYAML Header -> adapt output type -> knit
drop down menu
knit via console
rmarkdown:: render (“filename.Rmd”)
51 / 56
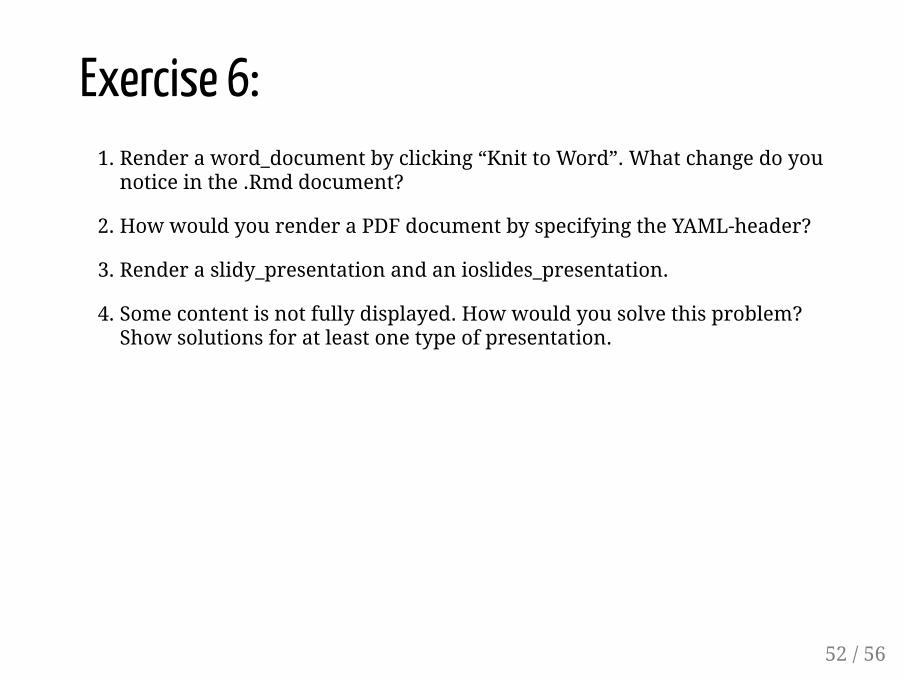
Exercise 6:1. Render a word_document by clicking “Knit to Word”. What change do you
notice in the .Rmd document?
2. How would you render a PDF document by specifying the YAML-header?
3. Render a slidy_presentation and an ioslides_presentation.
4. Some content is not fully displayed. How would you solve this problem?Show solutions for at least one type of presentation.
52 / 56
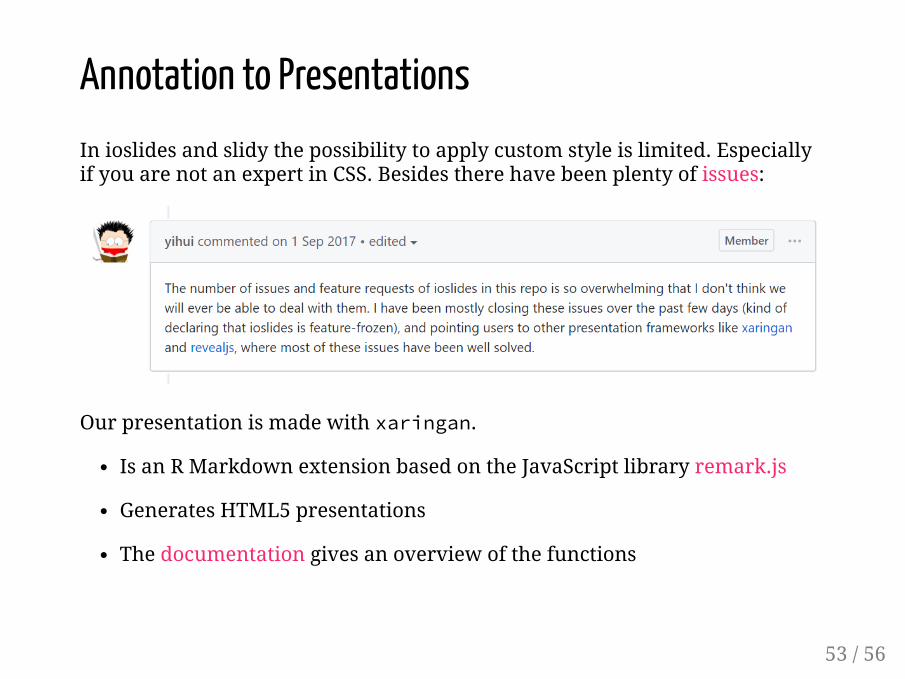
Annotation to PresentationsIn ioslides and slidy the possibility to apply custom style is limited. Especiallyif you are not an expert in CSS. Besides there have been plenty of issues:
Our presentation is made with xaringan.
Is an R Markdown extension based on the JavaScript library remark.js
Generates HTML5 presentations
The documentation gives an overview of the functions
53 / 56
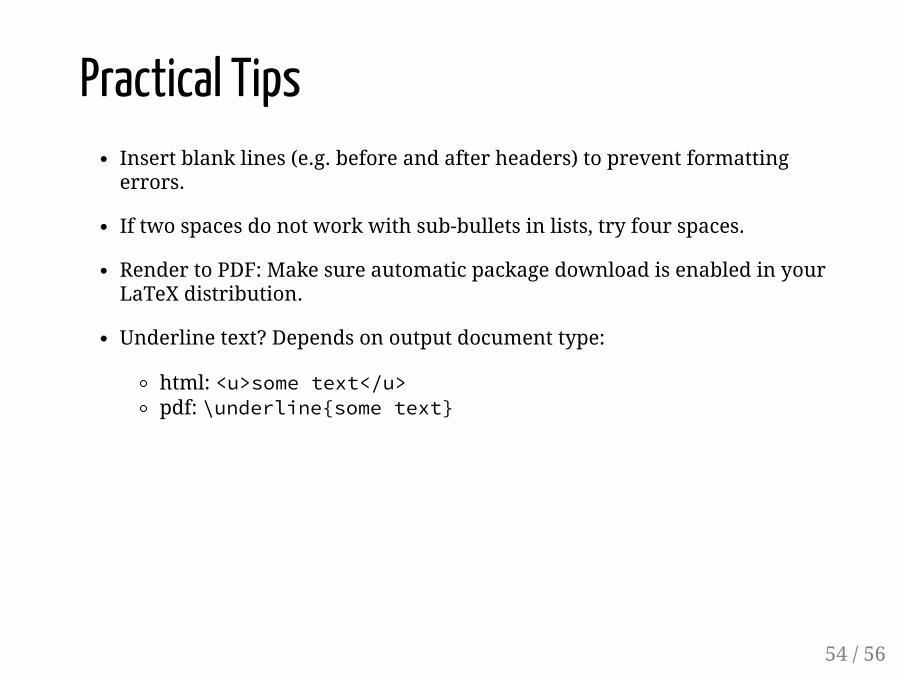
Practical TipsInsert blank lines (e.g. before and after headers) to prevent formattingerrors.
If two spaces do not work with sub-bullets in lists, try four spaces.
Render to PDF: Make sure automatic package download is enabled in yourLaTeX distribution.
Underline text? Depends on output document type:
html: <u>some text</u>pdf: \underline{some text}
54 / 56
Exercise 7Rebuild an html_document
55 / 56

Thank you for your attention.Thank you for your attention.Have a nice evening.Have a nice evening.
56 / 5656 / 56


![A Markdown Interpreter for TeX - TeXdoc Onlinetexdoc.net/texmf-dist/doc/generic/markdown/markdown.pdf10if not modules then modules = { } end 11modules['markdown'] = metadata 1.1 Feedback](https://img.pdfslide.us/doc/110x75/5f98527ba4d31247186114b5/a-markdown-interpreter-for-tex-texdoc-10if-not-modules-then-modules-end.jpg)