Embed Size (px)
Citation preview

2
Outlines
• Intro to R & RStudio• Intro to basics• Vectors• Matrices• Factors• Data frames• Lists

3
INTRO TO R & RSTUDIO
4
R programming language
• R is a free software programming language and software environment for statistical computing and graphics.
• The R language is widely used among statisticians and data miners for developing statistical software and data analysis.
• With over 2 million users worldwide R is rapidly becoming the leading programming language in statistics and data science.
• http://www.r-project.org/

5
Rexer Analytics 2013 Data Miner Survey Highlights
http://www.kdnuggets.com/2013/10/rexer-analytics-2013-data-miner-survey-highlights.html

6
R programming language
• R is a GNU project. • R is freely available under the GNU General
Public License, and pre-compiled binary versions are provided for various operating systems.
• R uses a command line interface; however, several graphical user interfaces are available for use with R.

7
R programming language
• R is an interpreted language; users typically access it through a command-line interpreter.
• R's data structures include vectors, matrices, arrays, data frames (similar to tables in a relational database) and lists.

8
RStudio
• RStudio is a free and open source integrated development environment (IDE) for R.
• Two editions: – RStudio Desktop, where the program is run locally
as a regular desktop application;– RStudio Server, which allows accessing RStudio
using a web browser while it is running on a remote Linux server.
• http://www.rstudio.com/
9
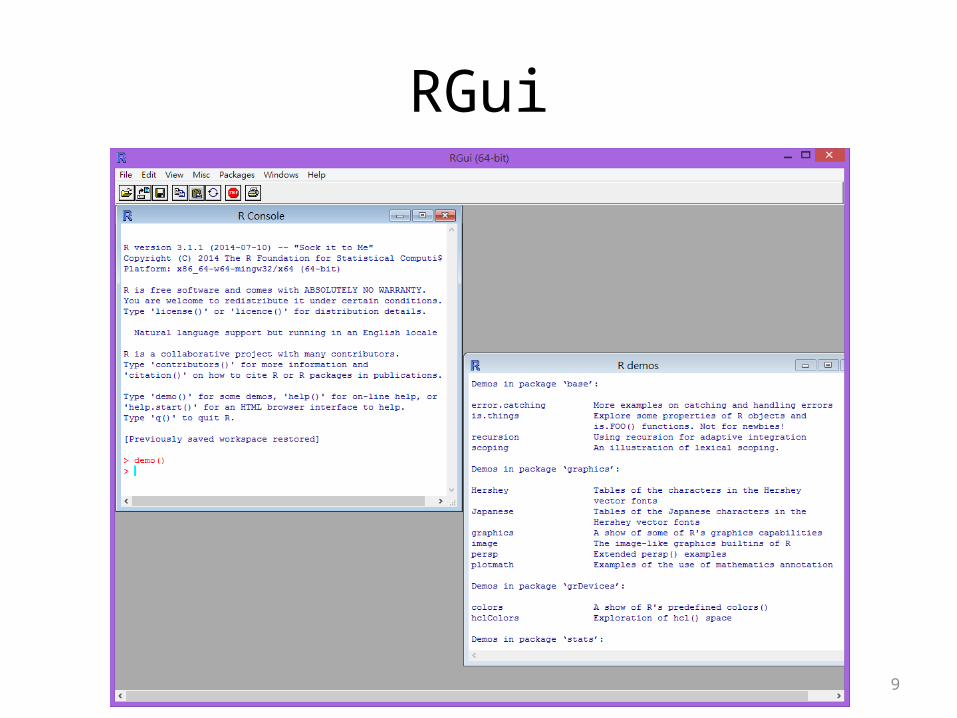
RGui

10
RStudio
11
INTRO TO BASICS
12
How it works
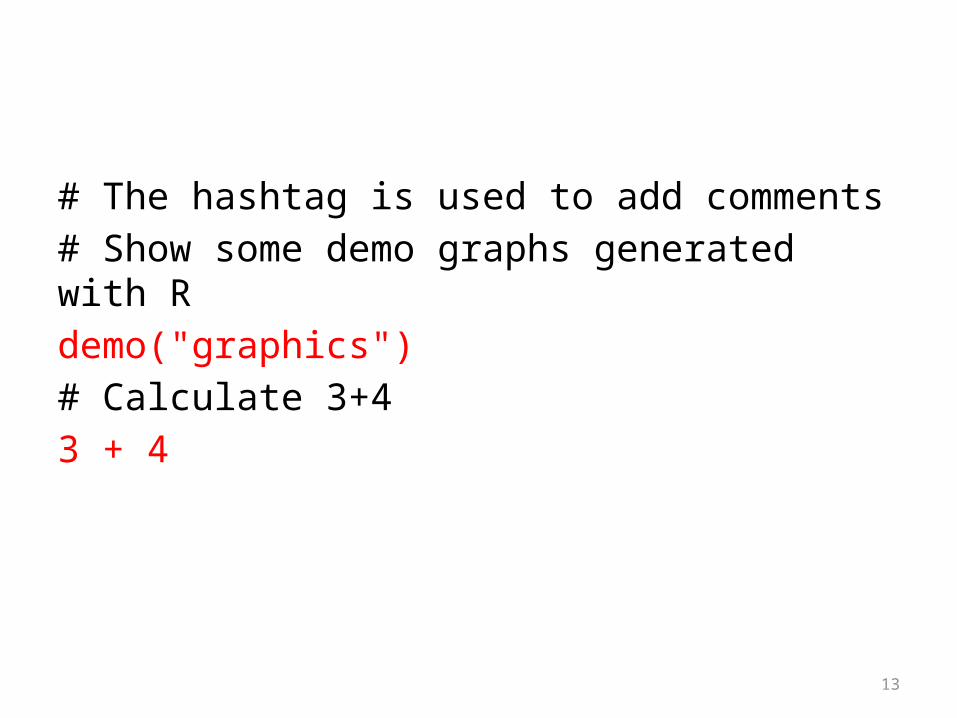
• R makes use of the # sign to add comments, such that you and others can understand what the R code is about.
• Comments are not run as R-code, so they will not influence your result.
• The output of your R code is shown in the console, while graphs are shown in the upper right corner.
13
# The hashtag is used to add comments# Show some demo graphs generated with Rdemo("graphics")# Calculate 3+43 + 4

14
Little arithmetics with R
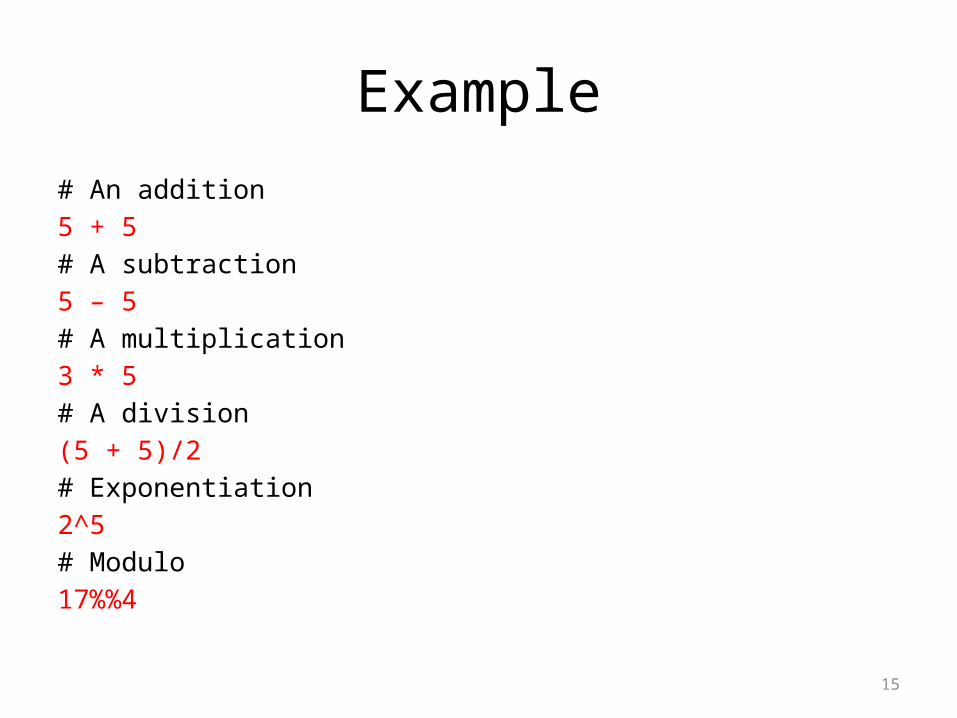
• Arithmetic operators:– Addition: +– Subtraction: -– Multiplication: *– Division: /– Exponentiation: ^– Modulo: %%
• The last two might need some explaining:– The ^ operator takes the number left to it to the power of the number
on its right-hand side: for example 3^2 is 9.– The modulo returns the remainder of the division of the number left
to it by the number on its right-hand side, for example 5 modulo 3 or 5%%3 is 2.
15
Example# An addition5 + 5# A subtraction5 – 5# A multiplication3 * 5# A division(5 + 5)/2# Exponentiation2^5# Modulo17%%4
16
Variable assignment
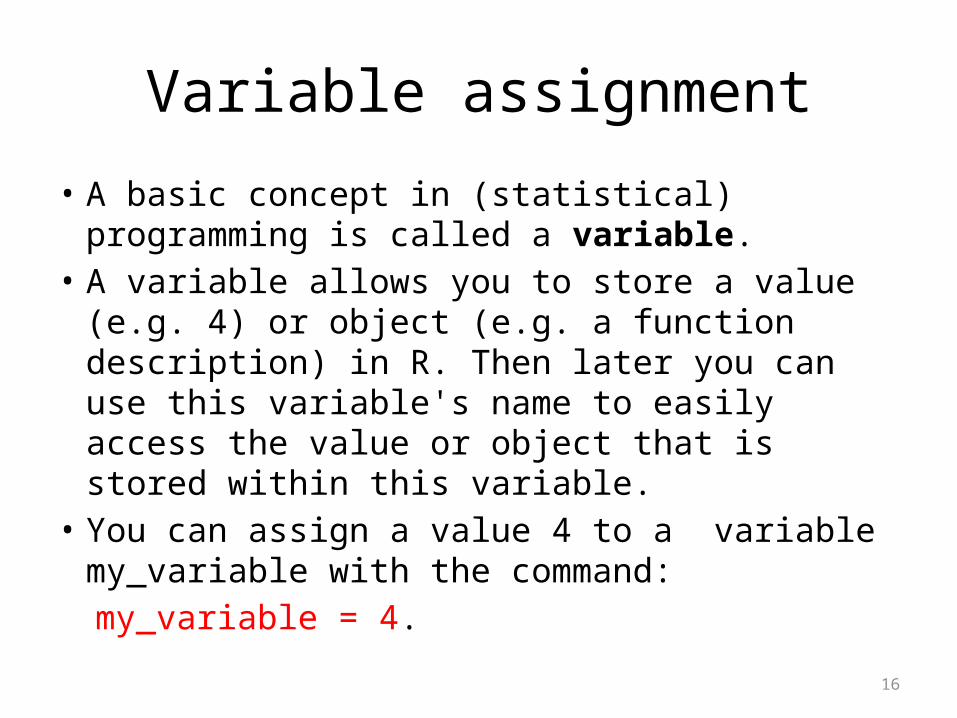
• A basic concept in (statistical) programming is called a variable.
• A variable allows you to store a value (e.g. 4) or object (e.g. a function description) in R. Then later you can use this variable's name to easily access the value or object that is stored within this variable.
• You can assign a value 4 to a variable my_variable with the command:
my_variable = 4.

17
Example
# Assign the value 42 to xx = 42y <- 20# Print out the value of the variable xXy

18
Basic data types in R
• R works with numerous data types. Some of the most basic types to get started are:– Decimals values like 4.5 are called numerics.– Natural numbers like 4 are called integers.– Boolean values (TRUE or FALSE) are called
logical (TRUE can be abbreviated to T and FALSE to F).
– Text (or string) values are called characters.• Note that R is case sensitive!

19
Example
my_numeric = 42# The quotation marks indicate that the variable is of type charactermy_character = "forty-two"my_logical = FALSE
20
What's that data type?
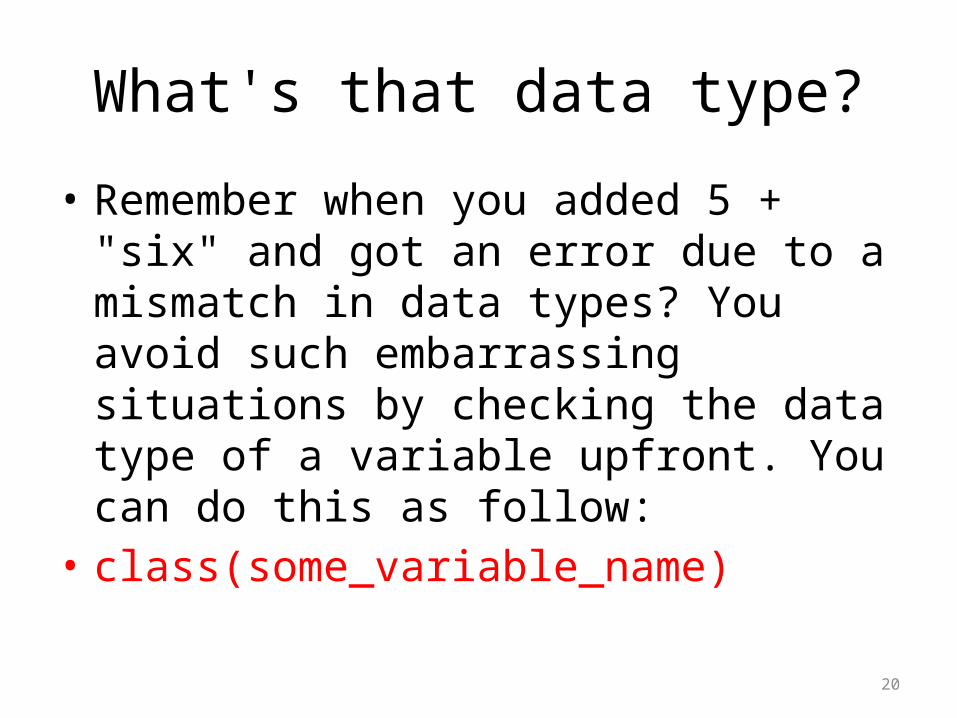
• Remember when you added 5 + "six" and got an error due to a mismatch in data types? You avoid such embarrassing situations by checking the data type of a variable upfront. You can do this as follow:
• class(some_variable_name)

21
Example
# Declare variables of different typesmy_numeric = 42my_character = "forty-two"my_logical = FALSE# Check which type these variables have:class(my_numeric)class(my_character)class(my_logical)

22
VECTORS

23
Create a vector
• In R, you create a vector with the combine function c(). Between the brackets you place the vector elements separated by a comma. For example:
numeric_vector = c(1,2,3)character_vector = c("a","b","c")boolean_vector = c(TRUE,FALSE)• Once you have created these vectors in R, you
can use them to do calculations.

24
Example• After one week in Las Vegas and still zero Ferrari's in your garage, you decide it is
time to start using your data analytical superpowers.• Before doing a first analysis, you decide to first collect the winnings and losses for
the last week:• For poker_vector:
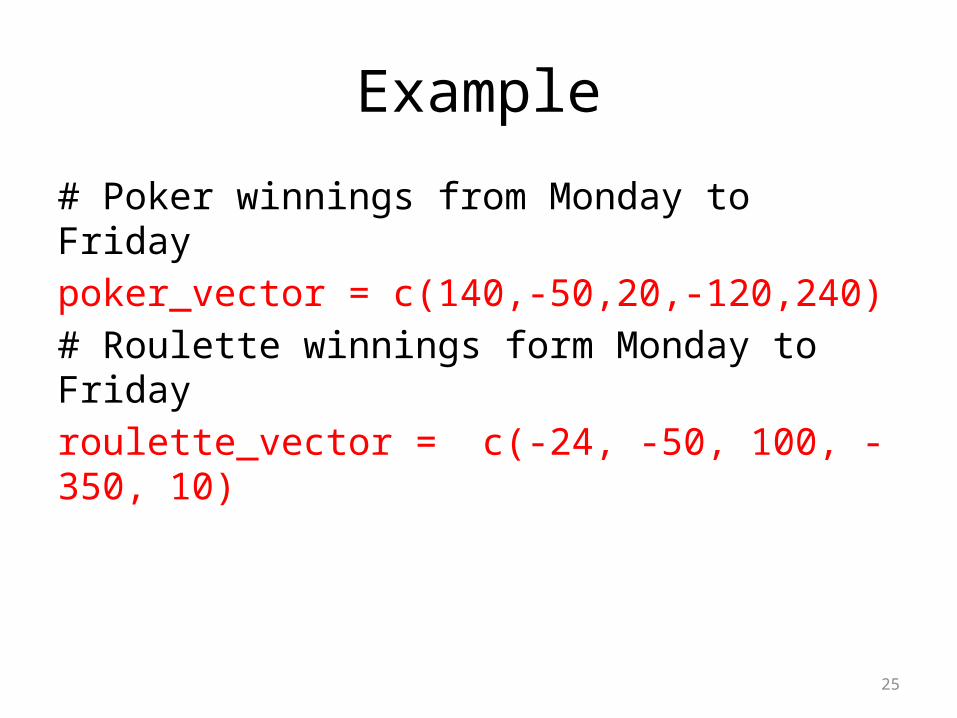
– On Monday you won 140$– Tuesday you lost 50$– Wednesday you won 20$– Thursday you lost 120$– Friday you won 240$
• For roulette_vector:– On Monday you lost 24$– Tuesday you lost 50$– Wednesday you won 100$– Thursday you lost 350$– Friday you won 10$
25
Example
# Poker winnings from Monday to Fridaypoker_vector = c(140,-50,20,-120,240)# Roulette winnings form Monday to Fridayroulette_vector = c(-24, -50, 100, -350, 10)

26
Naming a vector
# Poker winnings from Monday to Fridaypoker_vector = c(140, -50, 20, -120, 240)# Roulette winnings form Monday to Fridayroulette_vector = c(-24, -50, 100, -350, 10)# give a name to poker_vectornames(poker_vector) = c('Monday', 'Tuesday', 'Wednesday', 'Thursday', 'Friday')names(roulette_vector) = c('Monday', 'Tuesday', 'Wednesday', 'Thursday', 'Friday')

27
Naming a vector (2)
• There is a more efficient way to do this: assign the days of the week vector to a variable!
• Just like you did with your poker and roulette returns, you can also create a variable that contains the days of the week. This way you can use and re-use it.

28
Example
# Poker winnings from Monday to Fridaypoker_vector = c(140,-50,20,-120,240)# Roulette winnings form Monday to Fridayroulette_vector = c(-24,-50,100,-350,10)# Create the variable days_vector containing "Monday","Tuesday","Wednesday","Thursday","Friday“days_vector = c( "Monday","Tuesday","Wednesday","Thursday","Friday")#Assign the names of the day to the roulette and poker_vectorsnames(poker_vector) = days_vector names(roulette_vector) =days_vector

29
Calculating total winnings
• Now, you want to find out the following type of information:• How much has been your overall profit or loss per day of the
week?• Have you lost money over the week in total?• Are you winning/losing money on poker or on roulette?• To get the answers, you have to do arithmetic calculations on
vectors.• Important to know is that if you sum two vectors in R, it takes
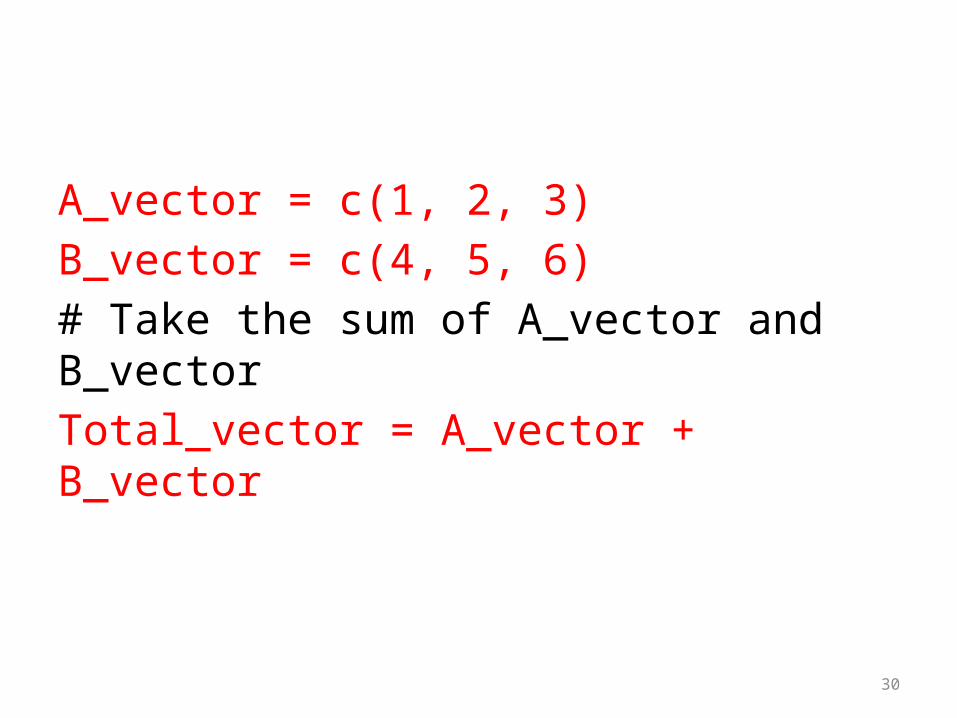
the element-wise sum. For example: c(1,2,3)+c(4,5,6) is equal to c(1+4,2+5,3+6) or c(5,7,9). Let's try this first!
30
A_vector = c(1, 2, 3)B_vector = c(4, 5, 6)# Take the sum of A_vector and B_vectorTotal_vector = A_vector + B_vector

31
# daily totaltotal_daily = poker_vector +roulette_vector# calculates the sum of all elements of a vectortotal_poker = sum(poker_vector)total_roulette = sum(roulette_vector)total_week = total_poker+total_roulette
32
Vector selection
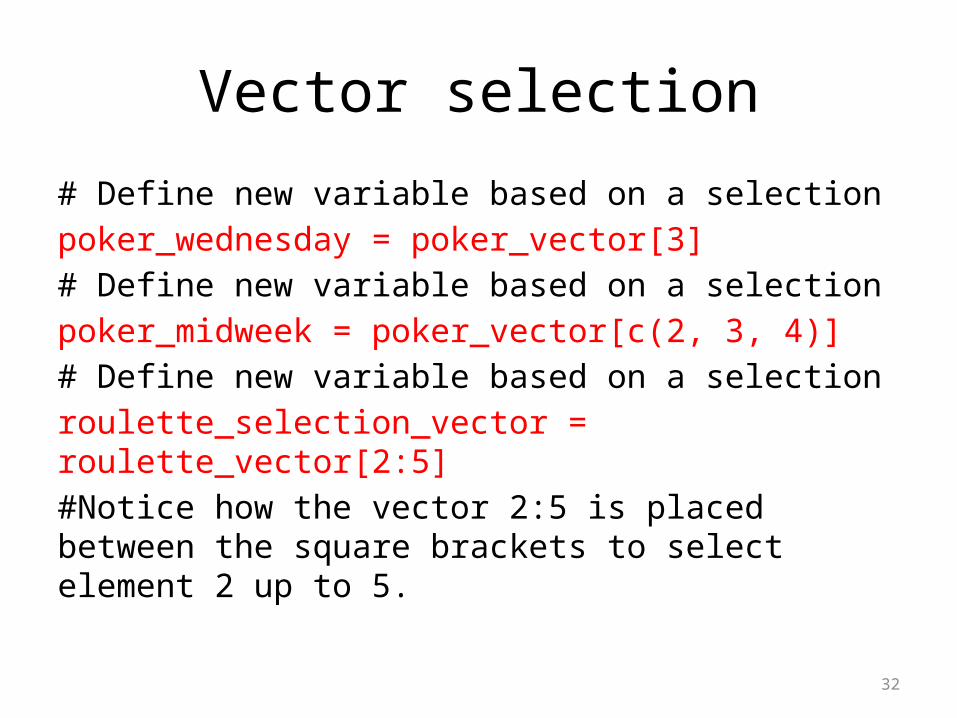
# Define new variable based on a selectionpoker_wednesday = poker_vector[3]# Define new variable based on a selectionpoker_midweek = poker_vector[c(2, 3, 4)]# Define new variable based on a selectionroulette_selection_vector = roulette_vector[2:5]#Notice how the vector 2:5 is placed between the square brackets to select element 2 up to 5.

33
Selection by comparison - Step 1• The (logical) comparison operators known to R are:
– < for less than– > for greater than– >= for greater than or equal to– == for equal to each other– != not equal to each other
• The nice thing about R is that you can use these comparison operators also on vectors.
• For example, the statement c(4,5,6) > 5• returns: FALSE FALSE TRUE. • In other words, you test for every element of the vector if the
condition stated by the comparison operator is TRUE or FALSE.

34
Example
# What days of the week did you make money on pokerselection_vector = poker_vector > 0selection_vector

35
Selection by comparison - Step 2
• You can select the desired elements, by putting selection_vector between square brackets when selecting from poker_vector. This works, because by default R only selects those elements where selection_vector is TRUE. For selection_vector this means where poker_vector > 0.

36
Example
# What days of the week did you make money on pokerselection_vector = poker_vector > 0# Select from poker_vector these dayspoker_winning_days = poker_vector[selection_vector]poker_winning_days

37
MATRICES
38
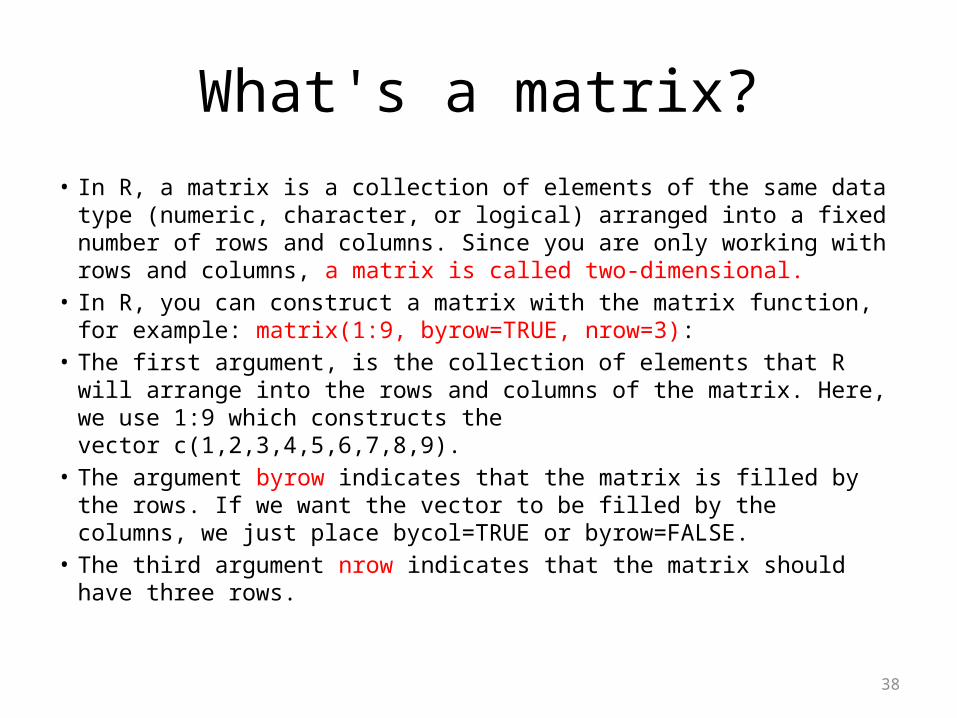
What's a matrix?• In R, a matrix is a collection of elements of the same data type (numeric,
character, or logical) arranged into a fixed number of rows and columns. Since you are only working with rows and columns, a matrix is called two-dimensional.
• In R, you can construct a matrix with the matrix function, for example: matrix(1:9, byrow=TRUE, nrow=3):
• The first argument, is the collection of elements that R will arrange into the rows and columns of the matrix. Here, we use 1:9 which constructs the vector c(1,2,3,4,5,6,7,8,9).
• The argument byrow indicates that the matrix is filled by the rows. If we want the vector to be filled by the columns, we just place bycol=TRUE or byrow=FALSE.
• The third argument nrow indicates that the matrix should have three rows.
39
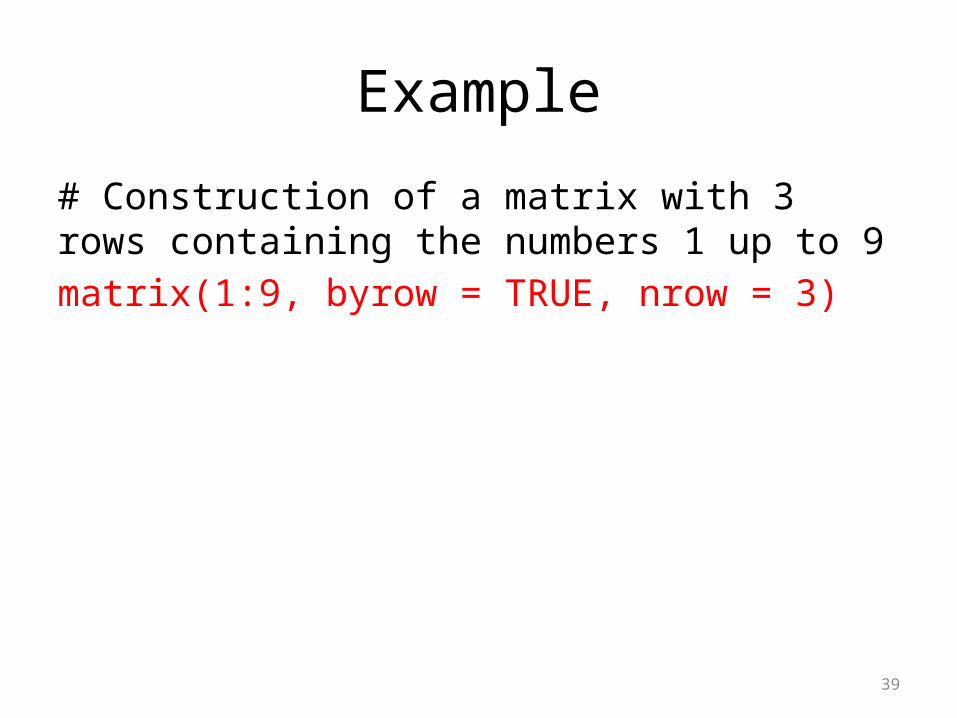
Example
# Construction of a matrix with 3 rows containing the numbers 1 up to 9matrix(1:9, byrow = TRUE, nrow = 3)
40
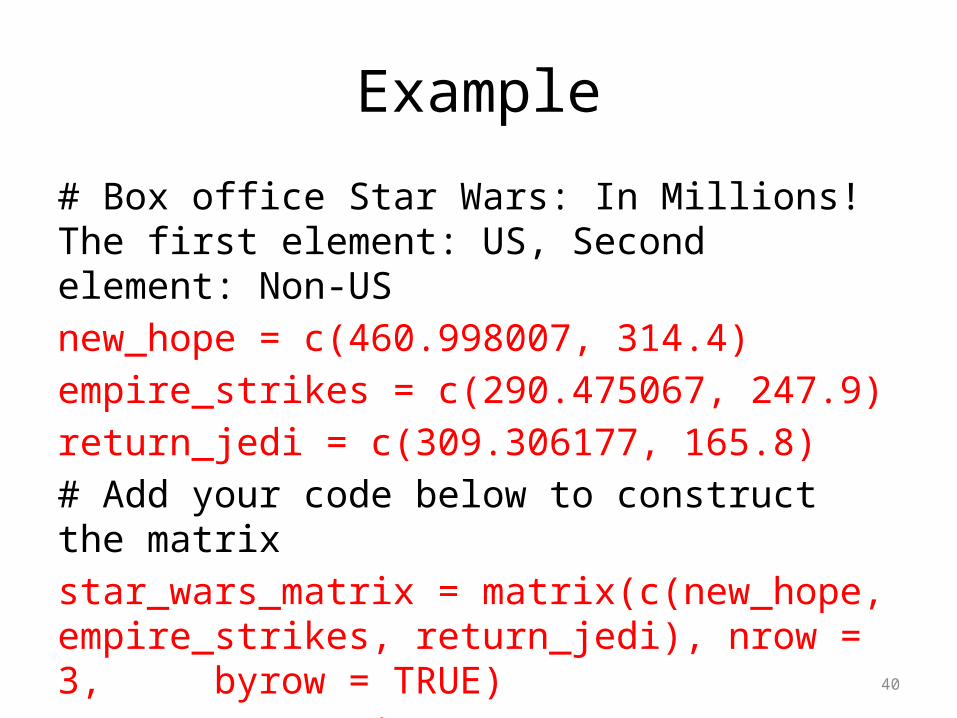
Example
# Box office Star Wars: In Millions! The first element: US, Second element: Non-USnew_hope = c(460.998007, 314.4)empire_strikes = c(290.475067, 247.9)return_jedi = c(309.306177, 165.8)# Add your code below to construct the matrixstar_wars_matrix = matrix(c(new_hope, empire_strikes, return_jedi), nrow = 3, byrow = TRUE)star_wars_matrix
41
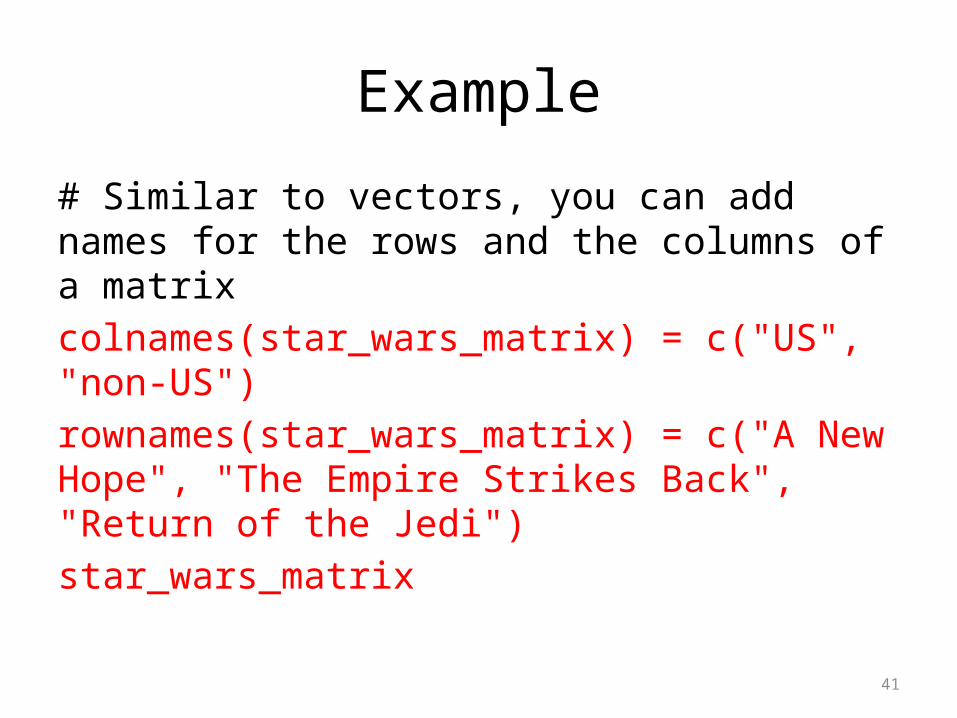
Example
# Similar to vectors, you can add names for the rows and the columns of a matrixcolnames(star_wars_matrix) = c("US", "non-US")rownames(star_wars_matrix) = c("A New Hope", "The Empire Strikes Back", "Return of the Jedi")star_wars_matrix
42
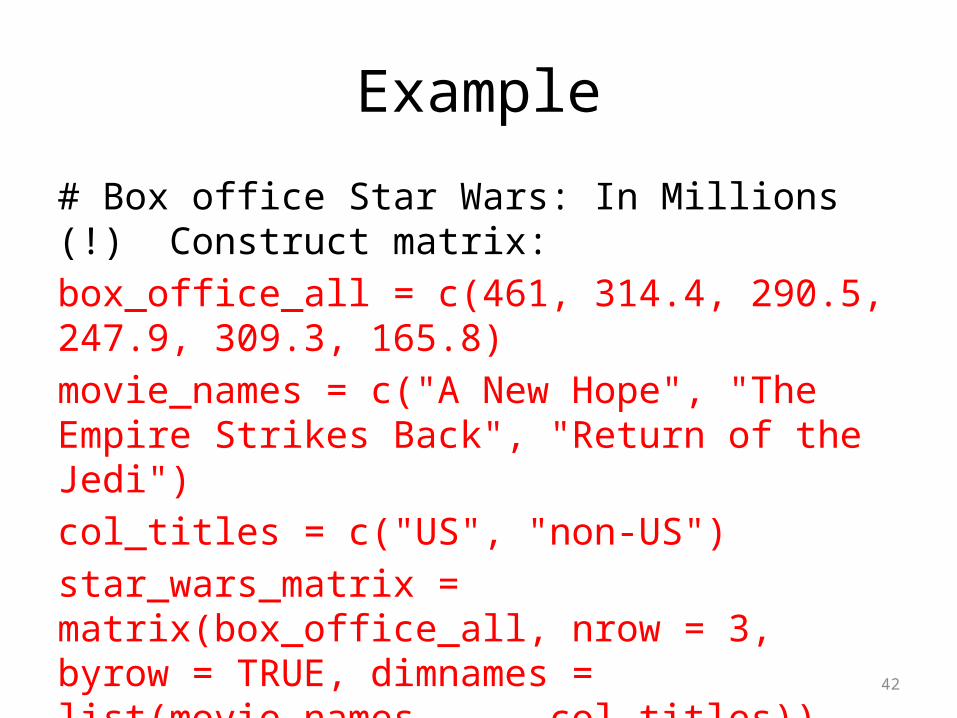
Example
# Box office Star Wars: In Millions (!) Construct matrix:box_office_all = c(461, 314.4, 290.5, 247.9, 309.3, 165.8)movie_names = c("A New Hope", "The Empire Strikes Back", "Return of the Jedi")col_titles = c("US", "non-US")star_wars_matrix = matrix(box_office_all, nrow = 3, byrow = TRUE, dimnames = list(movie_names, col_titles))

43
Adding a column for the Worldwide box office
# rowSums() conveniently calculates the totals for each row of a matrix. worldwide_vector = rowSums(star_wars_matrix)# Bind the new variable worldwide_vector as a column to star_wars_matrixall_wars_matrix = cbind(star_wars_matrix, worldwide_vector)

44
# Box office Star Wars: In Millions (!)> > # Matrix containing first trilogy box office> star_wars_matrix US non-US A New Hope 461.0 314.4 The Empire Strikes Back 290.5 247.9 Return of the Jedi 309.3 165.8
> # Matrix containing second trilogy box office> star_wars_matrix2 US non-US The Phantom Menace 474.5 552.5 Attack of the Clones 310.7 338.7 Revenge of the Sith 380.3 468.5
> # Combine both Star Wars trilogies in one matrix> all_wars_matrix = rbind(star_wars_matrix, star_wars_matrix2)> all_wars_matrix

45
Example
# Print box office Star Wars: In Millions (!) for 2 trilogies all_wars_matrixtotal_revenue_vector = colSums(all_wars_matrix)total_revenue_vector
movie_revenue_vector = rowSums(all_wars_matrix)movie_revenue_vector

46
Selection of matrix elements
• my_matrix[1,2] selects from the first row the second element.
• my_matrix[1:3,2:4] selects rows 1,2,3 and columns 2,3,4.
• If you want to select all elements of a row or column, no number is needed before or after the comma:
• my_matrix[,1] selects all elements of the first column.
• my_matrix[1,] selects all elements of the first row.
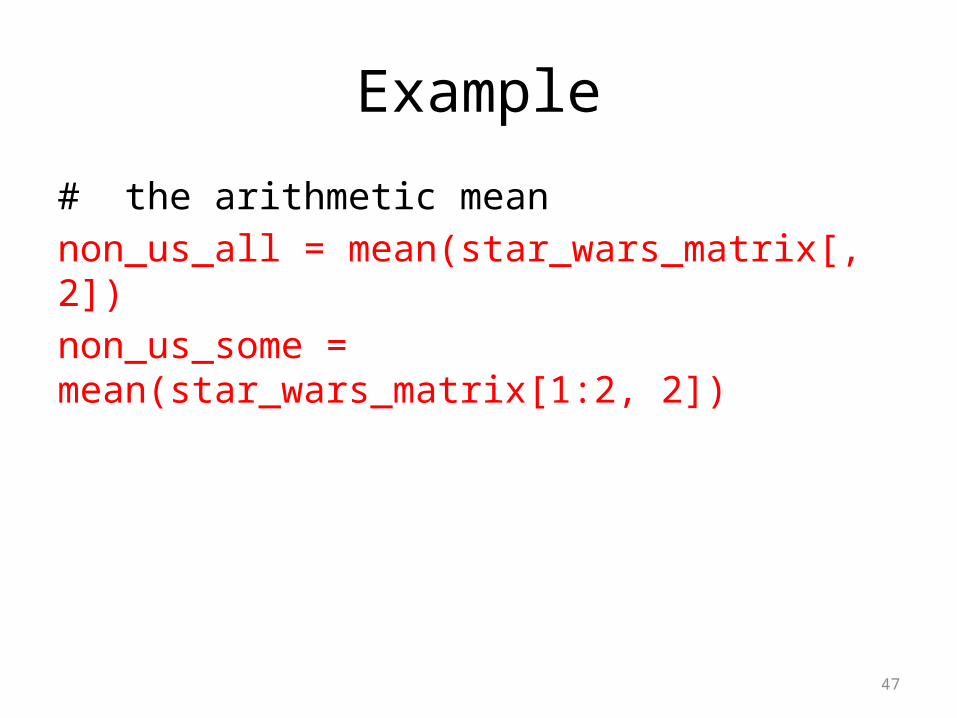
47
Example
# the arithmetic meannon_us_all = mean(star_wars_matrix[, 2])non_us_some = mean(star_wars_matrix[1:2, 2])

48
# Box office Star Wars: In Millions (!) box_office_all = c(461, 314.4, 290.5, 247.9, 309.3, 165.8)movie_names = c("A New Hope", "The Empire Strikes Back", "Return of the Jedi")col_titles = c("US", "non-US")star_wars_matrix = matrix(box_office_all, nrow = 3, byrow = TRUE, dimnames = list(movie_names, col_titles))ticket_prices_matrix = matrix(c(5, 5, 6, 6, 7, 7), nrow = 3, byrow = TRUE, dimnames = list(movie_names, col_titles))# visitors = star_wars_matrix/ticket_prices_matrix# average_us_visitor = mean(visitors[, 1])average_non_us_visitor = mean(visitors[, 2])

49
FACTORS

50
What's a factor
• The term factor refers to a statistical data type used to store categorical variables. – A categorical variable can belong to a limited number of
categories. – A continuous variable can correspond to an infinite
number of values.• The statistical models you will develop in the future treat both
types in a different way. • Example of a categorical variable
– 'Gender'. As you hopefully know by now, a human individual can either be "Male" or "Female". So "Male" and "Female" are here the (only two) values of the categorical variable "Gender", and every observation can be assigned to either the value "Male" of "Female".

51
Example
#The function factor() will encode the vector as a factorgender_vector = c("Male", "Female", "Female", "Male", "Male")factor_gender_vector = factor(gender_vector)factor_gender_vector
52
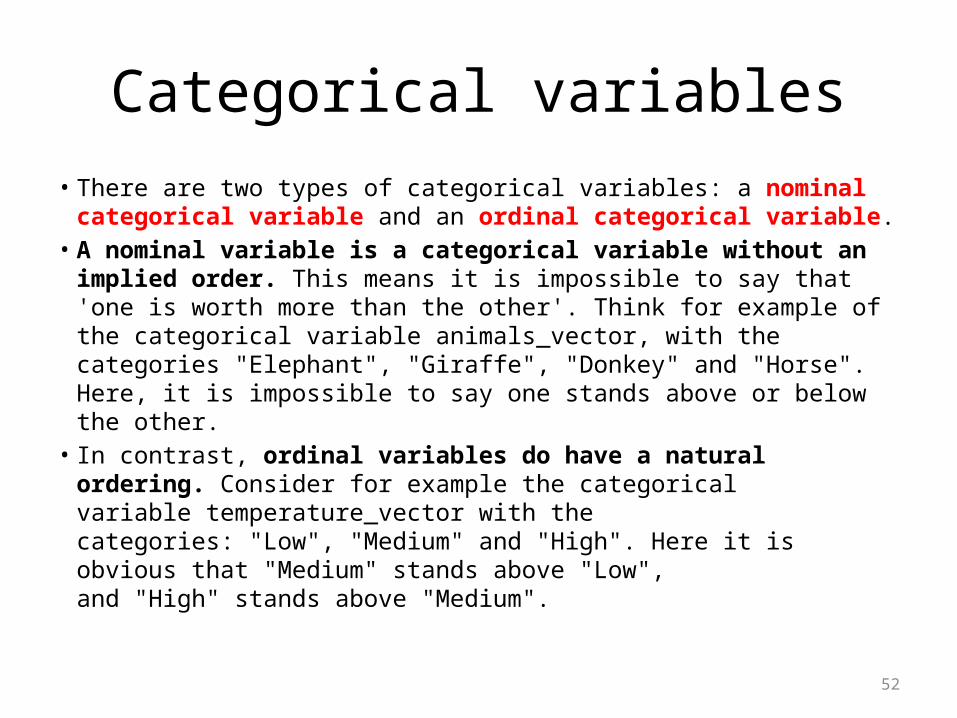
Categorical variables• There are two types of categorical variables: a nominal categorical
variable and an ordinal categorical variable.• A nominal variable is a categorical variable without an implied
order. This means it is impossible to say that 'one is worth more than the other'. Think for example of the categorical variable animals_vector, with the categories "Elephant", "Giraffe", "Donkey" and "Horse". Here, it is impossible to say one stands above or below the other.
• In contrast, ordinal variables do have a natural ordering. Consider for example the categorical variable temperature_vector with the categories: "Low", "Medium" and "High". Here it is obvious that "Medium" stands above "Low", and "High" stands above "Medium".

53
animals_vector = c("Elephant", "Giraffe", "Donkey", "Horse")temperature_vector = c("High", "Low", "High", "Low", "Medium")factor_animals_vector = factor(animals_vector)factor_temperature_vector = factor(temperature_vector, order = TRUE, levels = c("Low", "Medium", "High"))factor_animals_vectorfactor_temperature_vector
54
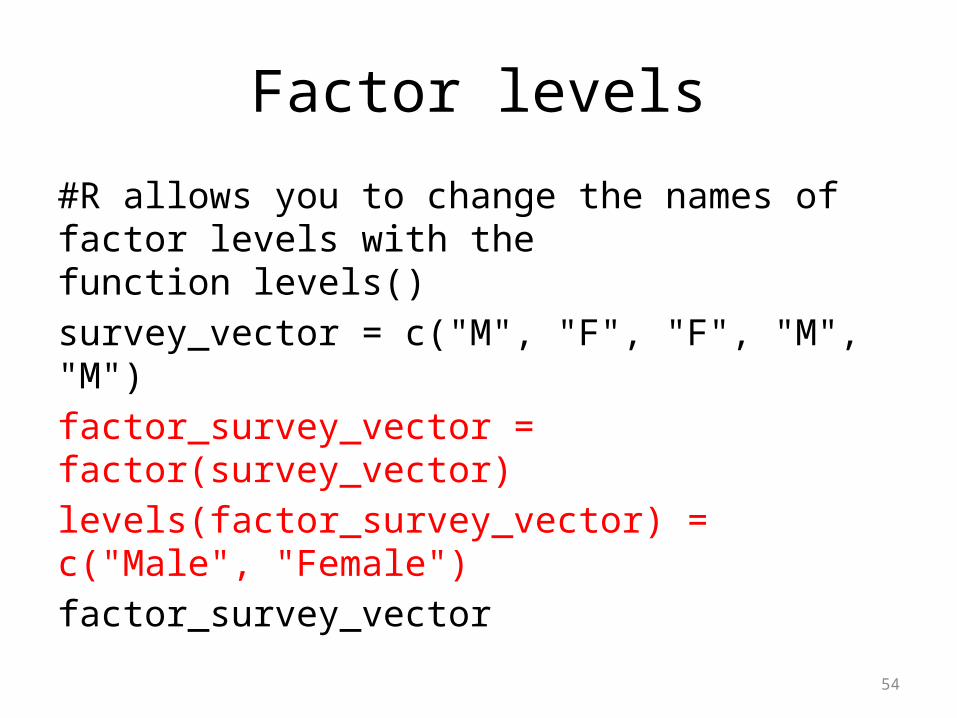
Factor levels
#R allows you to change the names of factor levels with the function levels()survey_vector = c("M", "F", "F", "M", "M")factor_survey_vector = factor(survey_vector)levels(factor_survey_vector) = c("Male", "Female")factor_survey_vector

55
Summarizing a factor
survey_vector = c("M", "F", "F", "M", "M")factor_survey_vector = factor(survey_vector)levels(factor_survey_vector) = c("Female", "Male")factor_survey_vectorsummary(survey_vector)summary(factor_survey_vector)
56
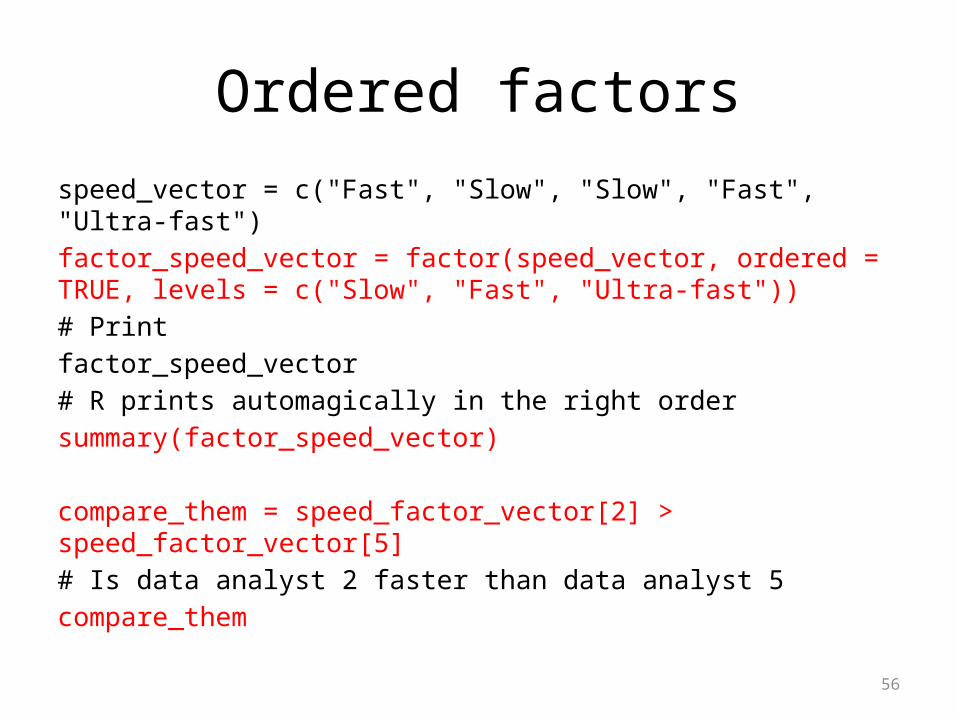
Ordered factors
speed_vector = c("Fast", "Slow", "Slow", "Fast", "Ultra-fast")factor_speed_vector = factor(speed_vector, ordered = TRUE, levels = c("Slow", "Fast", "Ultra-fast"))# Printfactor_speed_vector# R prints automagically in the right ordersummary(factor_speed_vector)
compare_them = speed_factor_vector[2] > speed_factor_vector[5]# Is data analyst 2 faster than data analyst 5compare_them

57
DATA FRAMES
58
What's a data frame?
• A data frame is a dataset of different data types.
• A data frame has the variables of a dataset as columns and the observations as rows.
• Example:# Built-in R dataset stored in a data framemtcars
59
Example
# Have a quick look at your datahead(mtcars)tail(mtcars)# Investigate the structure of the mtcars datasetstr(mtcars)

60
Creating a data frame
• Example: construct a data frame that describes the main characteristics of 8 planets in our solar system.
planets = c("Mercury", "Venus", "Earth", "Mars", "Jupiter", "Saturn", "Uranus", "Neptune");type = c("Terrestrial planet", "Terrestrial planet", "Terrestrial planet", "Terrestrial planet", "Gas giant", "Gas giant", "Gas giant", "Gas giant")diameter = c(0.382,0.949,1,0.532,11.209,9.449,4.007,3.883);rotation = c(58.64,-243.02,1,1.03,0.41,0.43,-0.72,0.67);rings= c(FALSE,FALSE,FALSE,FALSE,TRUE,TRUE,TRUE,TRUE);# Create the data frame:planets_df =data.frame(planets, type, diameter, rotation, rings)

61
Selection of data frame elements
# Check the structure of planets_dfstr(planets_df)planets_df# with the help of square brackets [ ]closest_planets_df = planets_df[1:3,]furthest_planets_df = planets_df[6:8,]# Have a look:closest_planets_dffurthest_planets_df

62
Selection of data frame elements
# use of the variable namefurthest_planets_diameter = planets_df[3:8,"diameter"]# use the $-sign to look up all the elements of the variable behind the sign# Create the rings_vectorrings_vector = planets_df$rings# Select the information on planets with rings:planets_with_rings_df = planets_df[rings_vector, ]

63
# Planets smaller than earth:small_planets_df = subset(planets_df, planets_df$diameter <1)

64
Sorting
# order() is applied on a variable, gives you in return the position of each elementa = c(100,9,101)order(a)# a[order(a)] gives you the ordered vectora[order(a)]
65
Example
# What is the correct ordering based on the planets_df$diameter variable?positions = order(planets_df$diameter, decreasing = TRUE)# Create new 'ordered' data frame:largest_first_df = planets_df[positions, ]
66
LISTS
67
What is a list in R?
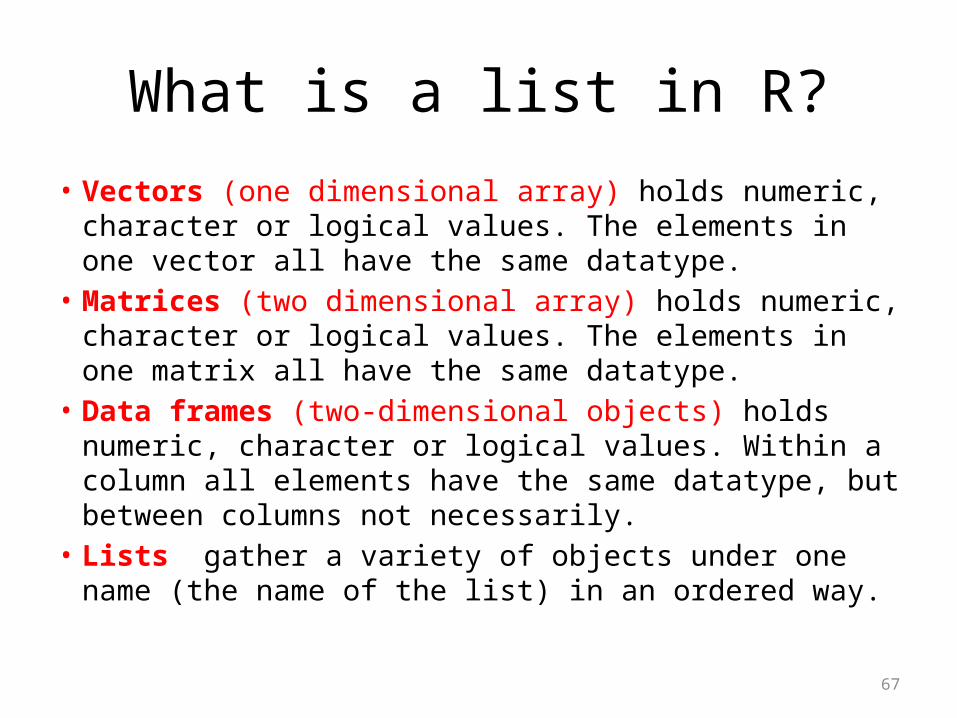
• Vectors (one dimensional array) holds numeric, character or logical values. The elements in one vector all have the same datatype.
• Matrices (two dimensional array) holds numeric, character or logical values. The elements in one matrix all have the same datatype.
• Data frames (two-dimensional objects) holds numeric, character or logical values. Within a column all elements have the same datatype, but between columns not necessarily.
• Lists gather a variety of objects under one name (the name of the list) in an ordered way.

68
Example
# Vector with numerics from 1 up to 10my_vector = 1:10 # Matrix with numerics from 1 up to 9my_matrix = matrix(1:9, ncol=3)# First 10 elements of the built-in data frame mtcarsmy_df = mtcars[1:10,] # Construct list with these different elements:my_list = list(my_vector, my_matrix, my_df)# Construct list with these different elements:my_List=list(VECTOR=my_vector, MATRIX=my_matrix, DATAFRAME=my_df)

69
Example
actors = c("Jack Nicholson", "Shelley Duvall", "Danny Lloyd", "Scatman Crothers", "Barry Nelson")sources = c("IMDb1", "IMDb2", "IMDB3")comments = c("Best Horror Film I have Ever Seen", "A truly brilliant and scary film from Stanley Kubrick", "A masterpiece of psychological horror")scores = c(4.5, 4, 5)reviews = data.frame(scores, sources, comments)
70
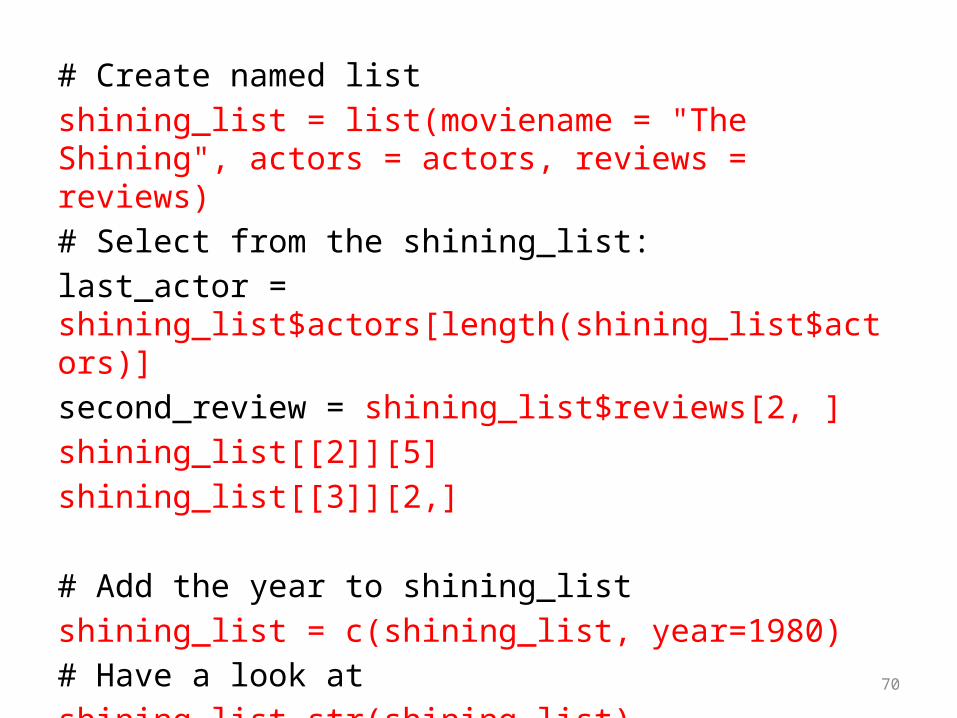
# Create named listshining_list = list(moviename = "The Shining", actors = actors, reviews = reviews)# Select from the shining_list:last_actor = shining_list$actors[length(shining_list$actors)]second_review = shining_list$reviews[2, ]shining_list[[2]][5]shining_list[[3]][2,]
# Add the year to shining_list shining_list = c(shining_list, year=1980)# Have a look at shining_list.str(shining_list)

71
Useful R Function
> example # Run the example from the help page for an object
> data # List the available data sets or import a data set> library # List available packages or attach a package> objects # List the objects in the workspace

72
Change Working Directory
# Create a folder in C:\temp\Rdata first> setwd("C://temp//Rdata")# set new working directory

73
Others
# clear console screenCtrl+L#Getting help with functions and featureshelp(solve)?solve#The examples on a help topicexample(solve)
74
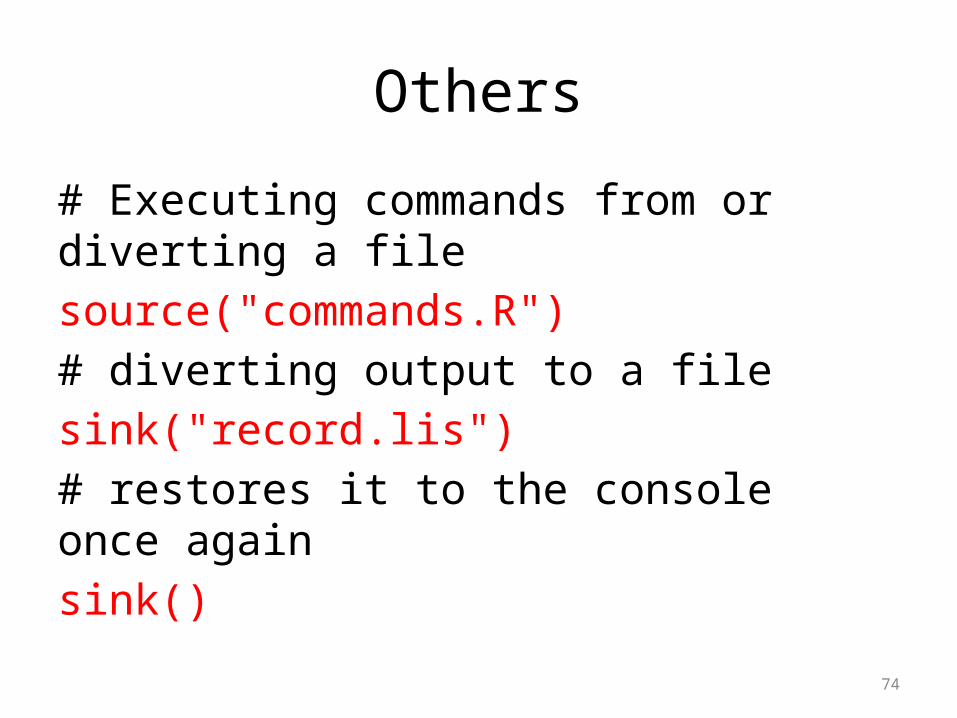
Others
# Executing commands from or diverting a filesource("commands.R")# diverting output to a filesink("record.lis")# restores it to the console once againsink()

75
# display the names of the objects which are currently stored within Robjects()ls()# To remove objectsrm(x, y, z, ink, junk, temp, foo, bar)# remove everything in the working environment.rm(list = ls())

![Balanced Constraint Measure Algorithm to Preserve …...privacy preserving and different methods in used privacy preserving for data publishing. Jieh-Shan Yeh and PoHsu -Chiang [29]](https://img.pdfslide.us/doc/110x75/5f4a3881174c5552884dc97b/balanced-constraint-measure-algorithm-to-preserve-privacy-preserving-and-different.jpg)