Embed Size (px)
Citation preview

• Recipient of the Market Technicians Association's “Best of the Best” Award in Point and Figure Chart Analysis.
Member NASD/SIPC
Introduction to Point & Figure and Candle Charting
MTA EDUCATION SEMINAR 2005
May 20, 2005By Kenneth G. Tower, CMT
Chief Market Strategist, CyberTrader, Inc.

April 26 – May 6, 2005
Intro to Point & Figure

Point and Figure Charts: What Are They?
First written about by Charles Dow
Named "Point and Figure" by Victor deVilliers
Based on Trading ActivityNot Time Based
Very Different from Bar Charts
Oldest form of charting in the US

End Result:
Very Clear Display of Support and Resistance
Fewer Moving Average Whipsaws
Point and Figure Charts: How Can I Profit From Them?

Chart Construction Example$1 box size, 1 box reversal
40 X
ABCD trends up to 43:XXX
40 X
ABCD then trends down to 39:XXOXO
40 XOO
P&F FAQWhen do you update the chart?
When do you change columns?
Where does the volume show up
P & F Chart Intro

Chart Construction Example$1 box size, 1 box reversal
40 X
ABCD trends up to 43:XXX
40 X
ABCD then trades like this:X XXO X X XXOX XOXOX X X
40 XOXOXO OXOXOXO O O O O
P&F FAQWhat’s the Advantage?
Some time periods are more important than others.
Stock patterns linked directly to trading activity –better reflection of the forces of supply and demand.
P & F Chart Intro

A big tech stockApril 26 – May 6, 2005
P & F Chart Intro

A big tech stockApril 26 – May 6, 2005
P & F Chart Intro

10:42am May 4 – 9:57 May 6, 2005
P & F Chart Intro

7/23/02 – 5/12/2005
Base: $32 - $36Aug ‘02 – June ‘03
P & F Chart Intro
Introduction to Point & Figure
Chart Conclusion

Intro to Candlestick Charts
A well known tech stockMarch 15 – May 12, 2005
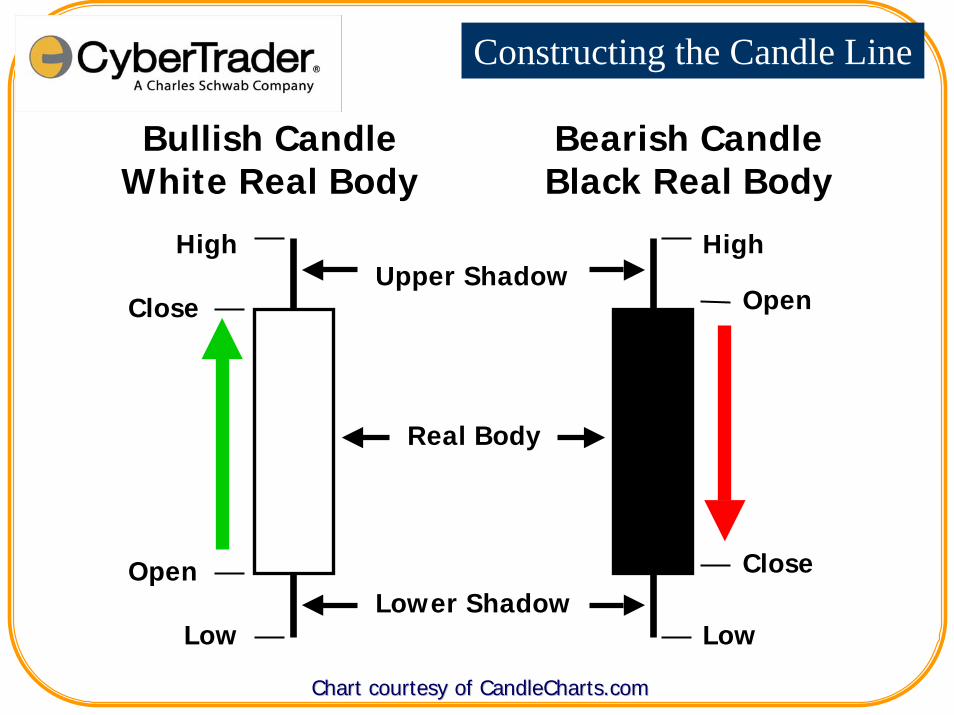
Constructing the Candle Line
Bullish Candle White Real Body
High
Close
Open
Low
Bearish CandleBlack Real Body
Low
Close
Open
High
Real Body
Upper Shadow
Lower Shadow
Chart courtesy of Chart courtesy of CandleChartsCandleCharts.com.com

Drawing Candle Lines
Session Open High Low Close
1 23 26 21 25
2 26 28 23 27
3 23 27 22 22
4 25 28 22 25
5 27 27 25 25
28
25
24
23
22
21
26
27
1 2 3 54
Chart Construction Example
Chart courtesy of Chart courtesy of CandleChartsCandleCharts.com.com

Bulls vs. Bears
The Real Body is the essenceof the price movement
Who’s in control?
Chart courtesy of Chart courtesy of CandleChartsCandleCharts.com.com

Small Real Bodies:Spinning Tops
Criteria:
With small real bodies, known as “Spinning Tops,” color is not important.
Implication:
Signals that a prior trend may be losing force.
Chart courtesy of Chart courtesy of CandleChartsCandleCharts.com.com

Criteria:
With a doji, the open and close prices are the same.
Implication:
A signal that the market is “tired”.
Chart courtesy of Chart courtesy of CandleChartsCandleCharts.com.com
Small Real Bodies:Doji
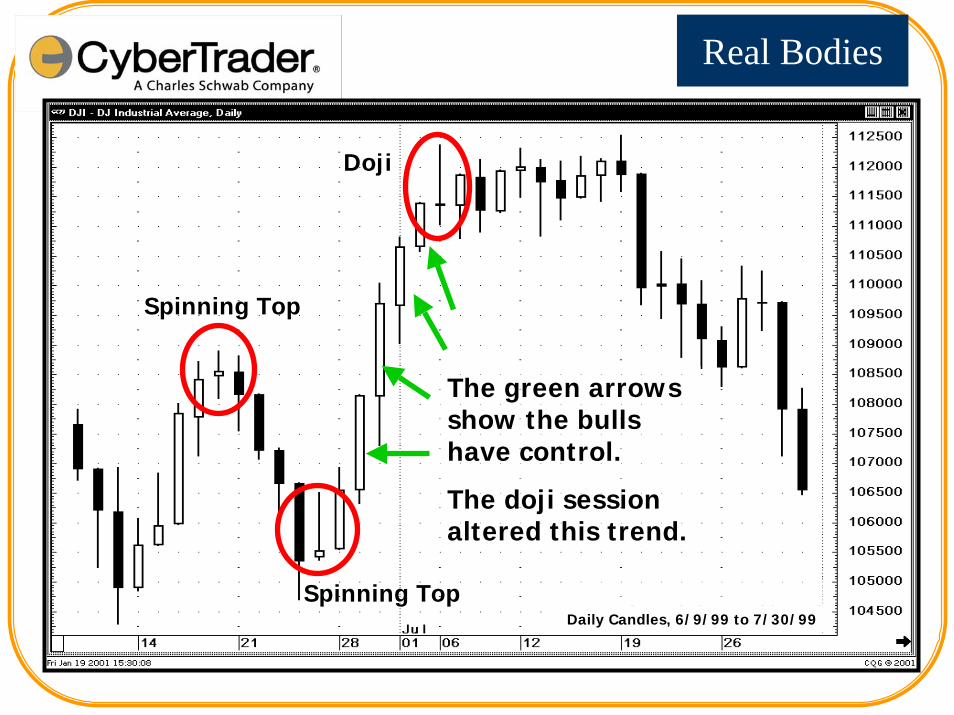
Spinning Top
Spinning Top
Doji
The green arrows show the bulls have control.
The doji session altered this trend.
DJ Industrial Avg ($DJI)Daily Candles, 6/9/99 to 7/30/99
Real Bodies

Info• More info from same data as bar charts• Use in concert with other technicals• Be careful about using intraday candles• ETFs more accurate than market averages• Many other patterns
Intro to Candlestick Charts
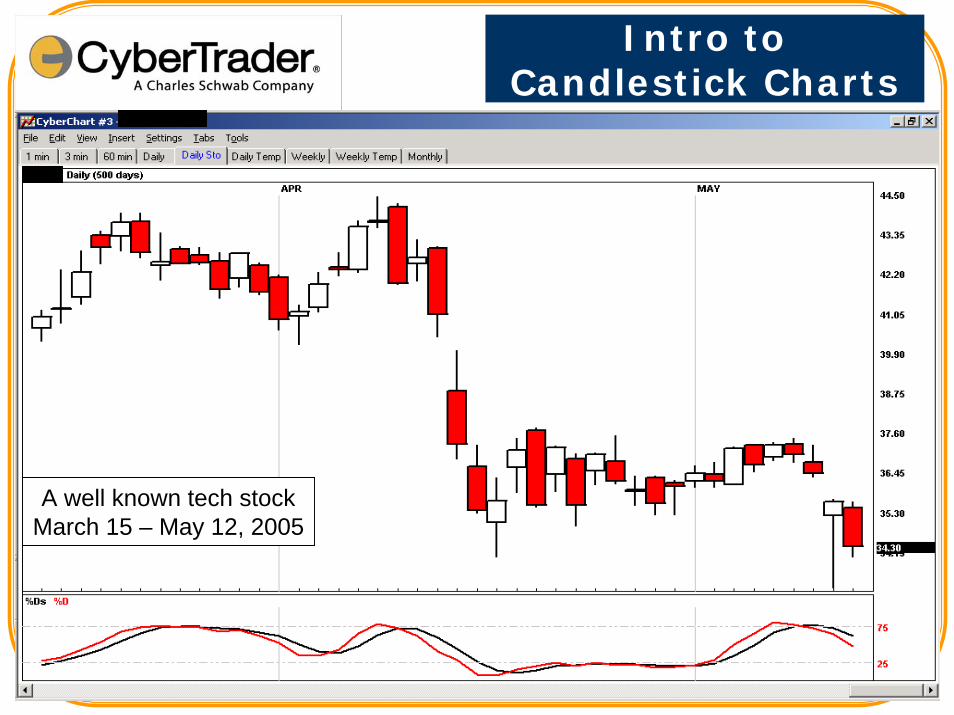
Intro to Candlestick Charts
A well known tech stockMarch 15 – May 12, 2005

Introduction to Candlestick
Chart Conclusion

• Recipient of the Market Technicians Association's “Best of the Best” Award in Point and Figure Chart Analysis.
Member NASD/SIPC
Introduction to Point & Figure and Candle Charting
MTA EDUCATION SEMINAR 2005
May 20, 2005By Kenneth G. Tower, CMT
Chief Market Strategist, CyberTrader, Inc.