Embed Size (px)
Citation preview
Introduction to Monitoring Dynamic Environmental Phenomena of the World Using Satellite Data Collection Systems, 1978

Introduction to Monitoring Dynamic Environmental Phenomena of the World Using Satellite Data Collection Systems, 1978
By William D. Carter and Richard W. Pau1son
G EO LOG I CAL SURVEY Cl RCU LAR 803
1979
United States Department of the Interior CECIL D. ANDRUS, Secretary
Geological Survey H. William Menard, Director
First Printing 1979 Second Printing 1979
Library of Congress Cataloging in Publication Data
Carter, William Douglas, 1926-
Introduction to monitoring dynamic environmental phenomena of the world using satellite data collection systems, 1978.
(Geological Survey circular; 803)
Bibliography: p.
1. Astronautics in earth sciences. 2. Earth sciences-Remote sensing. I. Paulson, Richard W. II. Series: United States. Geological Survey. Cir-cular 803.
QE75.C5 no. 803 [QE33.2.R4] 557.3'08s [550' .28] 79-4220
Free on application to Branch of Distribution, U.S. Geological Survey 1200 South Eads Street, Arlington, VA 22202
CONTENTS
Page
Abstract ----------------------------------------------------------------- 1 Introduction ------------------------------------------------------------- 1 Data collection systems _ _ __ _ __ _ __ _ __ _ _ _ _ _ _ _ __ _ _ _ __ _ _ _ __ __ __ _ __ _ __ __ _ __ _ _ _ _ 1 Data collection platforms _ __ _ __ _ __ _ _ _ ___ _ __ _ _ _ __ _ _ _ __ ___ _ _ _ _ __ _ __ ___ _ _ _ _ _ _ 8 Data collection sensors _ __ _ _ _ _ __ _ _ __ _ __ _ __ __ _ _ ____ __ __ ___ __ __ __ _ _ __ _ __ _ ___ _ 10
Sensor data -------------------------------------------------------------- 13 General ------------------------------------------------------------------ 15 Selected references ------------------------------------------------------- 17 Appendix A _ __ _ ___ _ _ __ _ _ _ __ __ _ _ _ __ _ __ _ __ _ _ ___ _ __ _ _ _ __ _ _ _ _____ _ __ __ _ _ __ _ _ 20
Appendix B -------------------------------------------------------------- 21
ILLUSTRATIONS
Page
FIGURE 1. Diagram of Landsat Data Collection System __ --------------------------------------- 4 2. Sketch of geometric relationships of platform and receiving station in relation to polar or-
biting satellite ___________ ---------------- ___ ------------------------------------ 4 3. Sketch of Landsat and its components ------------------------------------------------- 5 4. Landsat data collection platform _ _____ _ _ _ _ __ _ _ __ _ __ _ __ _ __ _ _ _ _ __ ___ _ _ __ __ _ _ __ _ _ __ _ __ __ 5
5. Landsat ground stations--coverage areas --------------------------------------------- 6 6. Sketch of synchronous meteorological satellite-GOES ---------------------------------- 7 7. Planned global synchronous satellite operating positions ------------------------------- 7 8. COM SAT /General data collection platform antenna ------------------------------------ 8 9. Convertible Landsat/GOES data collection platform radio and t,est set ------------------- 9
10. Landsat snow monitoring installation in Arizona -------------------------------------- 10 11. Volcanologist carrying portable Landsat data collection platform to site in Cascade
Mountains _ ____ __ __ __ __ __ ___ _ _ _ _ _ __ __ __ __ __ _ __ _ __ _ __ _ _ __ __ _ __ _ _ __ __ _ _ __ _ _ _ _ _ __ __ 11
12. Volcanologist holding bore-hole tiltmeter prior to installation ---------------------------- 11 13. ERTS/Landsat volcano monitoring network showing seismic e,vents of Volcan Fuego
eruption, Guatemala ___ ------------------- _________________ ---------------------- 12 14. Seismic event counter recorder, sensor, and Landsat DCP ------------------------------ 13 15. Landsat water level monitoring platform, Everglades National Park, Florida ____________ :._ 13 16. Surface water management model, Shark River Slough, Everglades National Park, Florida 14 17. Landsat DCP on stream gaging station in Verde River area of Arizona------------------ 15 18. Landsat reception station at Waltham, Massachusetts ---------------------------------- 15 19. GOES data collection platform monitoring water level in Florida ----------------------- 16
III

Any use of trade names and trademarks in this publication is for descriptive purposes only and does not constitute endorsement by the U.S. Geological Survey.
INTRODUCTION TO MONITORING DYNAMIC ENVIRONMENTAL PHENOMENA OF THE WORLD
USING SATELLITE DATA COLLECTION SYSTEMS, 1978
By William D·. Carte·r and Richard W. Paulson
ABSTRACT
The rapid development of satellite technology, especially in the area of radio transmission and imaging systems, makes it possible to monitor dynamic surface phenomena of the Earth in considerable detail. The monitoring systems that have been developed are compatible with standard monitoring systems such as snow, stream, and rain gages; wind, temperature and humidity measuring instruments; tiltmeters and seismic event counters. Supported by appropriate power, radios and antennae, remote stations can be left unattended for at least 1 year and consistently relay local information via polar orbiting or geostationary satellites. These data, in conjunction with timely Landsat images, can provide a basis for more accurate estimates on snowfall, water runoff, reservoir level changes, flooding, drought effects, and vegetation trends and may be of help in forecasting volcanic eruptions. These types of information are critical for resource inventory and development, especially in developing countries where remote regions are commonly difficult to access.
This paper introduces the reader to the systems available, describes their features and limitations, and provides suggestions on how to employ them. An extensive bibliography is provided for those who wish more information.
INTRODUCTION
The growing world population and concomitant demands being placed on renewable and nonrenewable resources have required resource specialists to acquire and analyze current information about environmental systems on a regional, continental, or even global basis. Recent advances in electronics and space technology have demonstrated that much of the needed information can be acquired repetitively and cost effectively. This circular describes, as simply as possible, satellite telemetry systems
1
that can collect and transmit environmental data from remote regions of the world to regional resource information centers. We have prepared this circular in a narrative manner in an attempt to answer the most common questions asked about the systems. While we have not at~temp.ted to provide an exhaustive treatment, we hope that ( 1) this method will serve as a basic introduction to this technology for general use and (2) the serious investigator will use it as a springboard to directly contact the authors or other specialists listed in the references.
Rainfall, snowfall, floods, hurricanes, volcanic eruptions and ashfalls, earthquakes, seismic sea waves (tsunami), and iceberg drifts are but a few of the active Earth processes that affect man's environment and his well-being. While satellites provide global imagery of many of these phenomena, there is a need for current in situ sensor data (i.e., data from environmental sensors on the Earth's surface). This current information is critical to the design of regional, national, or even global information systems that are timely and accurate to facilitate modeling and predicting for the future.
DATA COLLECTION SYSTEMS
What is a satellite Data Collection System?
A satellite Data Collection System (DCS) is telemetric and uses an Earth-orbiting satellite to relay data from hundreds or thousands of widely distributed environmental sensors to one or more data receiving stations. There are
three basic elements of any DCS. The first element is a field radio, usually called a Data Collection Platform (DCP), that is connected to environmental sensors such as precipitation or water-level recorders. The second element is a radio transponder (receiver/transmitter) on an Earth-orbiting satellite that is capable of receiving messages from a large number of DCP's. The third element is the data receiving station where data are retrieved from the satellites, processed, and disseminated to users. A satellite DCS can be configured in numerous ways that affect the cost, versatility, and ease of operation of the total system.
How many satellite DCS's are in use or are planned?
Three major U.S. Government satellite DCS's are presently available for use in North and South America, and a third commercialtype system was demonstrated in early 1978. The existing U.S. Government systems are aboard the Landsat, Nimbus F, and the Synchronous Meteorological Satellite/Geostationary Operational Environmental Satellite (SMS/GOES) series. The commercial-type system was jointly de·monstrated in late 1977 and early 1978 by the U.S. Geological Survey and the COM SAT General Corporation. In late 1978, a joint United States-French Data Collection System will be available on the Tiros N satellite.
What are the basic characteristics of satellite DCS's?
Many characteristics of the DCS are governed by the satellite's orbit. If a satellite is placed in an orbit coincident with the Earth's equatorial plane at an altitude of about 36,000 km, it is possible for the satellite's position to be constant relative to the surface of the Earth, i.e., the satellite orbits the Earth in 24 hours and appears to be motionless in the sky. Such orbits, :called geostationary or geosynchronous, provide a continuous opportunity to communicate through the satellite from positions on the Earth's surface that are in the satellite's field of view. Several DCS satellites are in geostationary orbit.
Other DCS satellites generally are in nearpolar orbits and, at altitudes of approximately 900 km, make one ·complete orbit of the E·arth every 100-110 minutes. The orbit periodically
2
carries the satelHte from the North Polar region down over U~e daylight side of the Earth to the South Polar region then up over the dark side of the Earth to the vicinity of the North Pole. When the next orbital transit is made, the Earth will have rotated on its axis about 25 o under the satellite's orbital plane; and the path of the satellite is displaced to the west (oi the previous orbit), cros1sing the Equator about 3,000 km to the west of the previous orbit. At higher latitudes the distance between orbital transits is smaller. The net result is that the satellite passes within radio range of all areas of the Earth several times each day. Ground platforms may be accessed by one of ·three poss;ible modes : ( 1) random access, (2) time-ordered acce:s~s, or (3) an interrogation mode. DCS's using the random access mode have one radio frequency channel, which means the time of a DCP's transmission is completely independent of the time of transmissions of other DCP's, and mutual interference from two or more DCP's is expected to occur at a random but predictable rate. In the event of mutual interference of the transmissions, no data are successfully relayed by the system. It is possible to predict the probability of successfully relaying data through a random-access system. The probability of successfully relaying a transmission through such a system is affected by the number of DCP's in the system, the radio frequency bandwidth, the data coding convention, the orbital characteristics of the satellite, and other system characteristics. The communications parameters and the mathematical models required to predict the performance of this type of system are well known to the communications engineering community.
In summary, in a random-access system a brief data transmission, known as, a data burst, is emitted by each DCP once every several minutes continually round the clock, regardless of whether the satellite is within radio range. If the satellite is in a polar orbit, it will periodically pass within range of the DCP, receive one or more data bursts, and relay the data immediately to a receiving station if it is in range. For most locations in North A:merica, such satellites are within range !Of a DCP and a receiving station only about 2 to 3 percent of
the 24-hour day. Some polar orbiting DCS systems use Doppler principles to track within a few kilometers the positions of DCP's on moving buoys and balloons from frequency shifts in the signal received by the satellite. Some provide data storage on the satellite to record data bursts from DCP's when a receive station is not in view. This capability enables collection of DCP data from any location worldwide.
In contrast to the random-access DGS system is the time-ordered DGS, wherein a DCP is assigned a precisely defined time interval for · transmission. A ·precision timer .in the DCP is
·set to initiate a transmission during a predetermined time interval ; for example, during a 1-minute period once every 6 hours. If all DCP's in the system are well managed, no other DCP will transmit during that time on that channel, and communications can be established. The DCP precision timer, which generally is designed to be accurate to 1 part .in 106 per y~ar, is designed to permit a drift of no more than approximately 30 seconds per year in the time of message initiation. Thus, if selftimed DCP's are assigned 1-minute reporting intervals and broadcast in the central :point of their time intervals, they should continue to operate without mutual interference for at le:ast 1 year.
The last mode of operation used in DCS systems is the interrogate mode of operation, in which a DCP is commanded to transmit by a signal received from the data receiving station through the satellite. Under command from the receiving station, the satellite initiates a request for a DCP with the specified identification number (ID) to reply. Upon recognizing its ID, the DCP transmits its data. Under this mor!e of operation, the receiving station maintains control of the DCP's, causing them to adhere to the receiving station's schedule. In time of emergency, the ground receiving station can reschedule interrogations and attempt to initiate communications under a new schedule.
What are the characteristics of the Landsat DCS?
The Landsat DGS is a random-access system on a polar orbiting satellite. The U.S. Landsat · satellite, operated by the National Aeronautics and Space Administration (NASA), makes an orbit of the Earth every 103 minutes and can
3
receive data from up to 1000 DCP's in the instantaneous field of view (figs. 1, 2, 3, 4, and 5) .
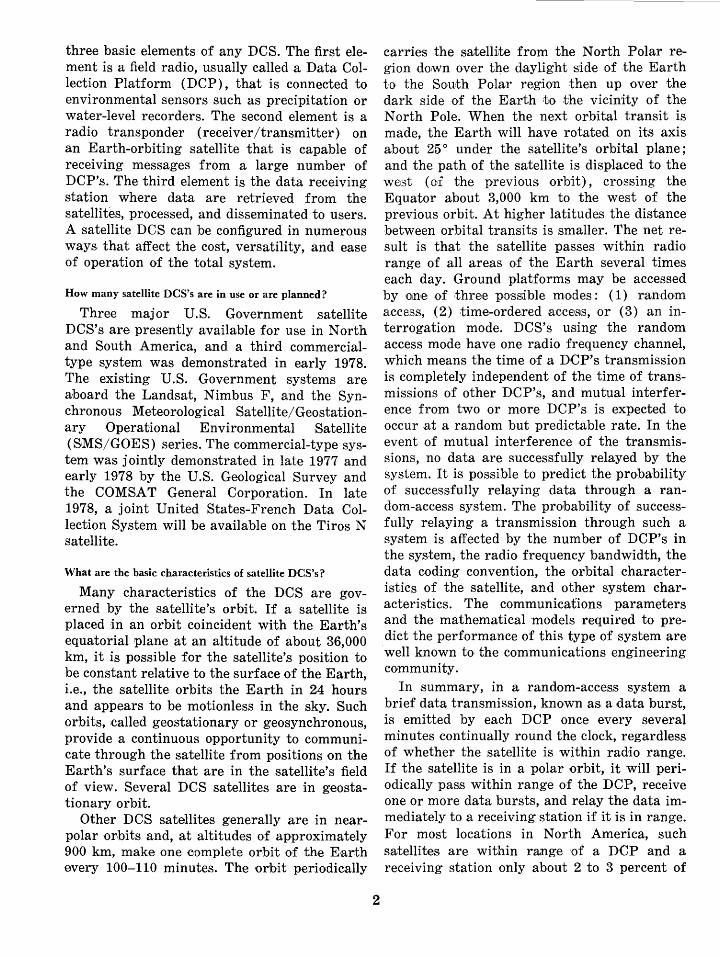
The Landsat Data Collection Platform (DCP) transmits 64 bits of sensor data plus station identification. This transmis,sion is at a rate of 5,000 bits per seeond, lasts 38 milliseconds, and is emitted from the DCP antenna approximately every 180 seconds. The antenna emits the radio transmission to a 140-degree cone abo~e the antenna plane at a radio frequency of 401.55 MHz. At any instant the satellite is capable of receiving data from Landsat DCP's tha,t are within radio range, which is approximately 2,000 km from the point on the Earth's surface below the satellite. If any DCP within range of the satellite transmits a mess .. age, it is instantaneously relayed to the receiving station if a receiving station is in range. DCS experiments in North America have shown that the typical DCP relays data through the Landsat sat,ellite during two and occasionally three orbits every 12 hours.
Al,though the data collection syst1em has functioned well with Landsat 1 and 2, there is no current plan to continue this capability beyond Landsat 3. Preference is being placed on geostationary relay satellites such as GOES, except where position location is required. In view of the development of Landsat receiving stations around the world, the decision ·to drop the data relay capability will result in the loss of a flexibile DCS that is able to, relay data in areas of adverse topography. A reversal of this decision might be accomplished by exp~ressions of interest to NASA from the scientific community that wishes to employ the system.
What are the characteristics of the Nimbus F DCS?
The Nimbus F DCS is a random-access system on a polar orbiting satellite. The U.S. Nimbus satellite, operated by NASA, makes an orbit of the Earth approximately every 108 minutes and can receive data from. up to 200 DCP's in the instantaneous field of view.
The Nimbus DCP transmits 32 bits of sensor data plus station identifi·cation. The trans.mission rate is at 100 bits per second, and a message is transmitted every 180 seconds. The omnidirectional antenna emits. a transmission at a frequency of 401.2 MHz. As in the Landsat syst,em, data will be relayed t1o the data re~
401 55 MHZ 5 KBPS
LANDSAT SPACECRAFT
REMOTE SITE (ALASKA}
REMOTE SITE (GOLDSTONE, CALIF.}
2287. S. MHZ DCS ON 1.024 MHZ
SUBCARRIER}
TYPICAL REMOTE SITE (NETWORK TEST AND TRAINING FACILITY, GREENBELT, MARYLAND}
1200-BIT NASCOM BLOCKS
1200-BIT NASCOM BLOCKS
NOTE: INDICATES EQUIPMENT ~ WHICH IS UNIQUE TO ~ DATA COLLECTION SYSTEM
GODDARD SPACE FLIGHT CENTER (GREENBELT, MARYLAND}
FIGURE 1.-Diagram of the Landsat Data Collection System. (Courtesy of General Electric.)
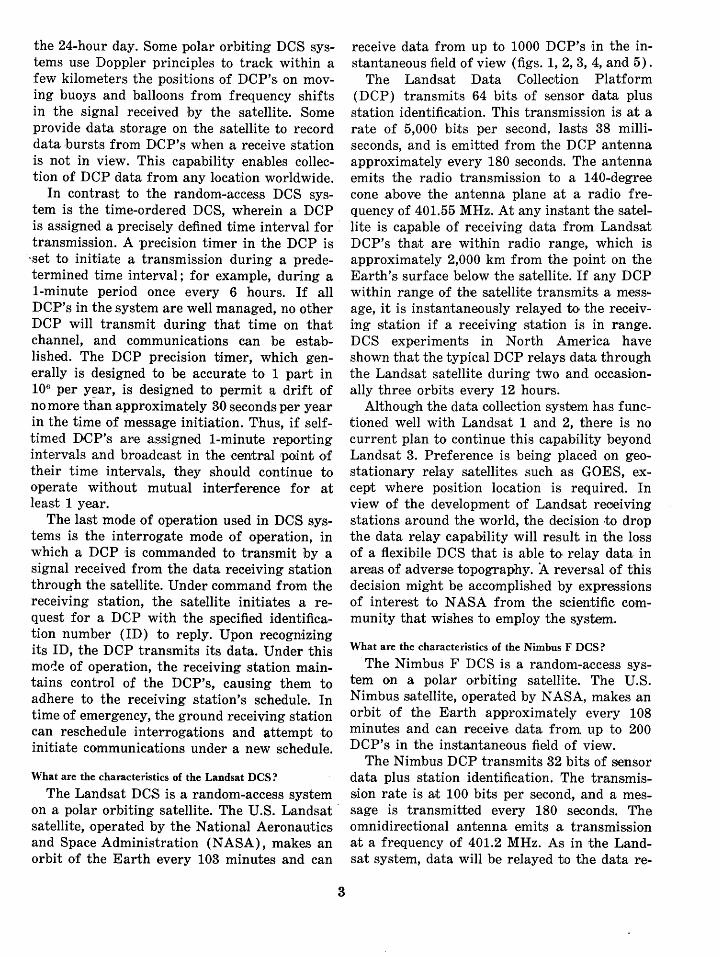
FIGURE 2.-Sketch of geometric relationships of platform and receiving station in relation to polar orbiting satellite (Landsat). (Courtesy of General Electric.)
ceiving station if there is mutual visibility of the DCP and data rec·eiving station fl'lom the satellite. In addition, it is possible for the satellite to record data from a DCP when the satel-
4
li:te is out of range of a receiving station for later trans.miss:ion to the da.ta receiving station. This provides for global coverage not immediately possible on Landsat.
In contrast to the Landsat system, the Nimbus F system provides for position location of the DCP's. There is a slight shift in the radio frequency of the DCP signal as the position of the DCP changes relative to the satellite as the satellite moves through its orbit. This so-called Doppler shift can be used to compute the DCP's location to within 3-5 km. The Nimbus system has been used numerous times to track drifting buoys in the ocean and balloons in the atmosphere.
What are the characteristics of the GOES DCS?
In contrast to the experimental polar orbiting random-access Landsat and Nimbus F DCS's, the SMS/GOES-DCS (fig. 6) is operational and is in a ~eostationary orbit. It uses in excess of 150 radio frequency channels for communication, as opposed to the single chan-
SOLAR ARRAY
ORBIT ADJUST TANK
DATA COLLECTION ANTENNA
RETURN B~ VIDICON CAMERAS (3 ON LANDSAT 1 AND 2, 2 ON LANDSAT-C)
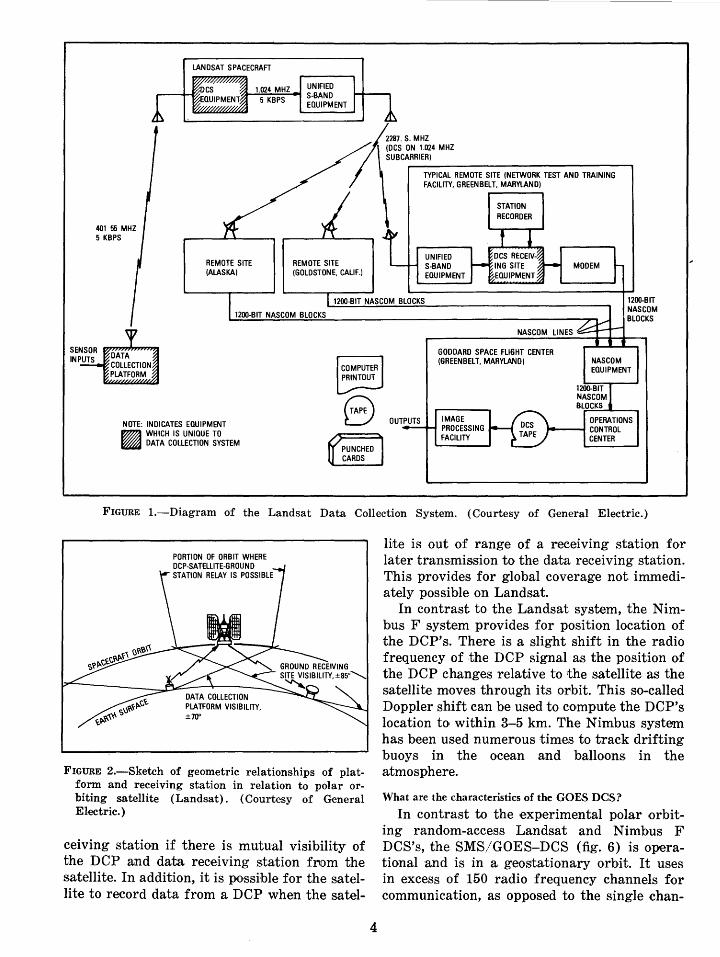
FIGURE 3.-Sketch of Landsat and its components. (Courtesy of General Electric.)
nel employed by Landsat or Nimbus F. The SMS/GOES-DGS operates in a time-ordered or interrogate mode, employs two operational satellites, and uses a radio frequency of about 402 MHz.
The U.S. National Environmental Satellite Service operates two GOES satellites in position ~a:bove the Equator at 75° W. and 135° W. longitude with an in-orbit spare loca:bed at 105° W. The Soviet Union, Japan, and the European Space Agency (ESA) are scheduled to orbit three GOES-type satellites in the 1977-1978 period to provide international and global Earth coverage (fig. 7).
The GOES DCP transmits a variable length message at a rate of 100 bits per second. The length of the message varies depending upon the amount of data that is to be transmitted from the DCP. The message length can be as short as about 9 seconds when minimal data amounts are sent and as long as several minutes when thousands of bits of data are to be sent. Normally, the message length is on the
5
BATTERY OR DC POWER SOURCE (USER PROVIDED)
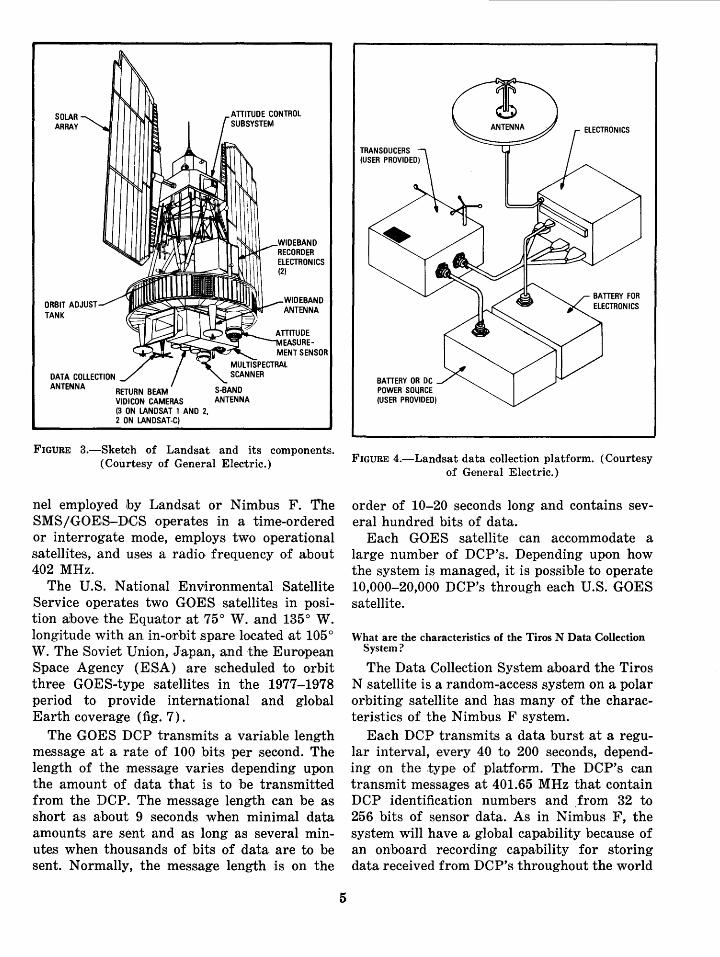
FIGURE 4.-Landsat data collection platform. (Courtesy of General Electric.)
order of 10-20 seconds long and contains several hundred bits of data.
Each GOES satellite can accommodate a large number of DCP's. Depending upon how the system is managed, it is possible to operate 10,000-20,000 DCP's through each U.S. GOES satellite.
What are the characteristics of the Tiros N Data Collection System?
The Data Collection System aboard the Tiros N satellite is a random-access system on a polar orbiting satellite and has many of the characteristics of the Nimbus F system.
Each DCP transmits a data burst at a regular interval, every 40 to 200 seconds, depending on the ,type of platform. The DCP's can transmit messages at 401.65 MHz that contain DCP identification numbers and .from 32 to 256 bits of sensor data. As in Nimbus F, the systen1 will have a global capability because of an onboard recording capability for storing data received from DCP's throughout the world
120W
····PLANNED ---EXISTING FOREIGN -EXISTING U.S.
sow
.. ··
0 60E 120E 180E
----------~---------+----------~------~--r----------r----------j--60S
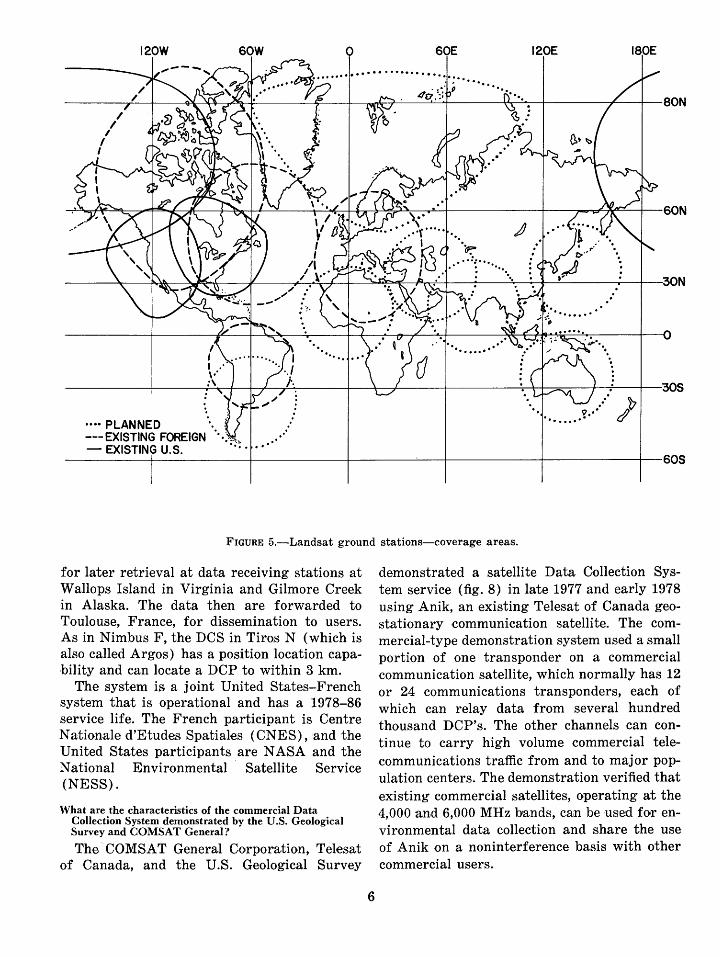
FIGURE 5.-Landsat ground stations-coverage areas.
for later retrieval at data receiving stations at Wallops Island in Virginia and Gilmore Creek in Alaska. The data then are forwarded to Toulouse, France, for dissemination to users. As in Nimbus F, the DCS in Tiros N (which is also called Argos) has a position location capability and can locate a DCP to within 3 km.
The system is a joint United States-French system that is operational and has a 1978-86 service life. The French participant is Centre N ationale d'Etudes Spatiales ( CNES), and the United States participants are NASA and the National Environmental Satellite Service (NESS).
What are the characteristics of the commercial Data Collection System demonstrated by the U.S. Geological Survey and COMSAT General?
The·· COlVISAT General Corporation, Telesat of Canada, and the U.S. Geological Survey
6
demonstrated a satellite Data Collection System service (fig. 8) in late 1977 and early 1978 using Anik, an existing Telesat of Canada geostationary ·Communication satellite. The commercial-type demonstration system used a small portion of one transponder on a commercial communication satellite, which normally has 12 or 24 communications transponders, each of which can relay data from several hundred thousand DCP's. The other channels can continue to carry high volume commercial telecommunications traffic from and to major population centers. The demonstration verified that existing commercial satellites, operating at the 4,000 and 6,000 MHz bands, can be used for environmental data collection and share the use of Anik on a noninterference basis with other commercial users.
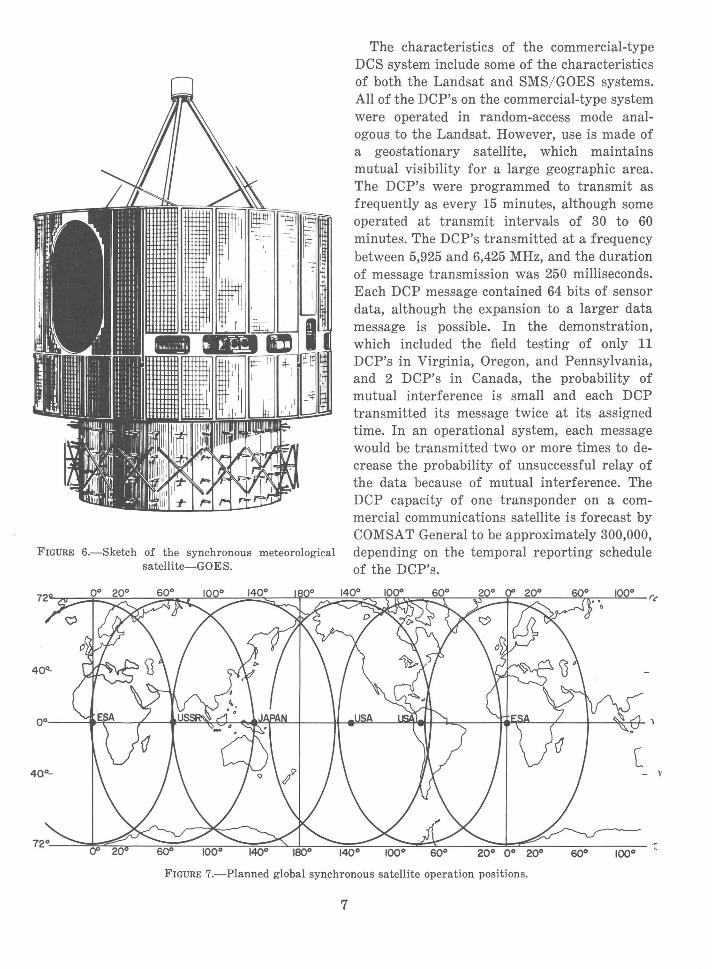
FIGURE 6.-Sketch of the synchronous meteorological satellite-GOES.
The characteristics of the commercial-type DCS system include some of the characteristics of both the Landsat and SMS/ GOES systems. All of the DCP's on the commercial-type system were operated in random-access mode analogous to the Landsat. However, use is made of a geostationary satellite, which maintains mutual visibility for a large geographic area. The DCP's were programmed to transmit as frequently as every 15 minutes, although some operated at transmit intervals o.f 30 to 60 minutes. The DCP's transmitted at a frequency between 5,925 and 6,425 MHz, and the duration of message transmission was 250 milliseconds. Each DCP message contained 64 bits of sensor data, although the expansion to a larger data message is possible. In the demonstration, which included the field testing of only 11 DCP's in Virginia, Oregon, and Pennsylvania, and 2 DCP's in Canada, the probability of mutual interference is small and each DCP transmitted its message twice at its assigned time. In an operational system, each message would be transmitted two or more times to decrease the probability of unsuccessful relay of the data because of mutual interference. The DCP capacity of one transponder on a commercial communications satellite is forecast by COMSAT General to be approximately 300,000, depending on the temporal reporting schedule of the DCP's.
FIGURE 7.-Planned global synchronous satellite operation positions.
7
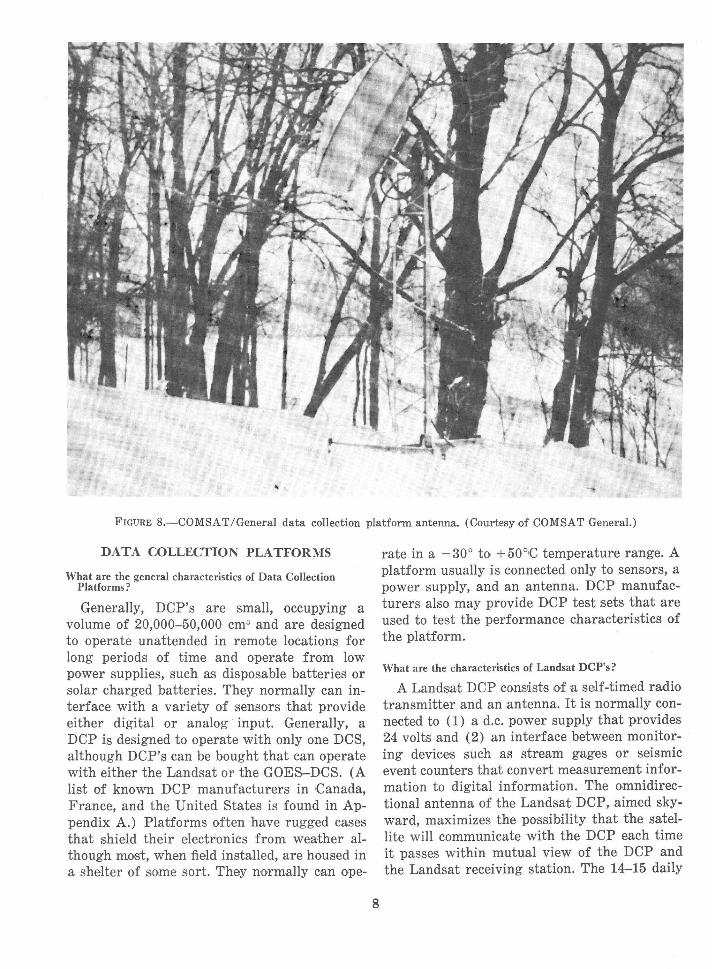
FIGURE 8.-COMSAT/General data collection platform antenna. (Courtesy of COMSAT General.)
DATA COLLECTION PLATFORMS
What are the general characteristics of Data Collection Platforms?
Generally, DCP's are small, occupying a volume of 20,000-50,000 cm3 and are designed to operate unattended in remote locations for long periods of time and operate from low power supplies, such as disposable batteries or solar charged batteries. They normally can interface with a variety of sensors that provide either digital or analog · input. Generally, a DCP is designed to operate with only one DGS, although DCP's can be bought that can operate with either the Landsat or the GOES-DCS. (A list of known DCP manufacturers in Canada, France, and the United States is. found in Appendix A.) Platforms often have rugged cases that shield their electrionics from weather although most, when fi,eld instaUed, are housed in a shelter of some sort. They normally can ope-
8
rate in a -30° to + 50°C temperature range. A platform usually is connected only to sensors, a power supply, and an antenna. DCP manufacturers also may provide DCP test sets that are used to test the performance characteristics of the platform.
What are the characteristics of Landsat DCP's?
A Landsat DCP ,coMists of a self-timed radio transmitter and an antenna. It is normally connected to (1) a d.c. power supply that provides 24 volts and (2) an interface between monitoring devices such as stream gages or seismic event counters that convert measurement information to digital information. The omnidirectional antenna of the Landsat DCP, aimed skyward, maximizes the possibility that the satellite will communicate with the DCP each time it passes within mutual view of the DCP and the Landsat receiving station. The 14-15 daily
orbits of Landsat and range of radio telemetry system provide relay of data several times daily. The Landsat DCP's operate on a frequency of 401.55 MHz. The signals are currently received and relayed to Landsat reception stations only in the United States, Canada, and Chile. Other Landsat stations can receive such data but have not yet done so because the demand for such information has not yet developed.
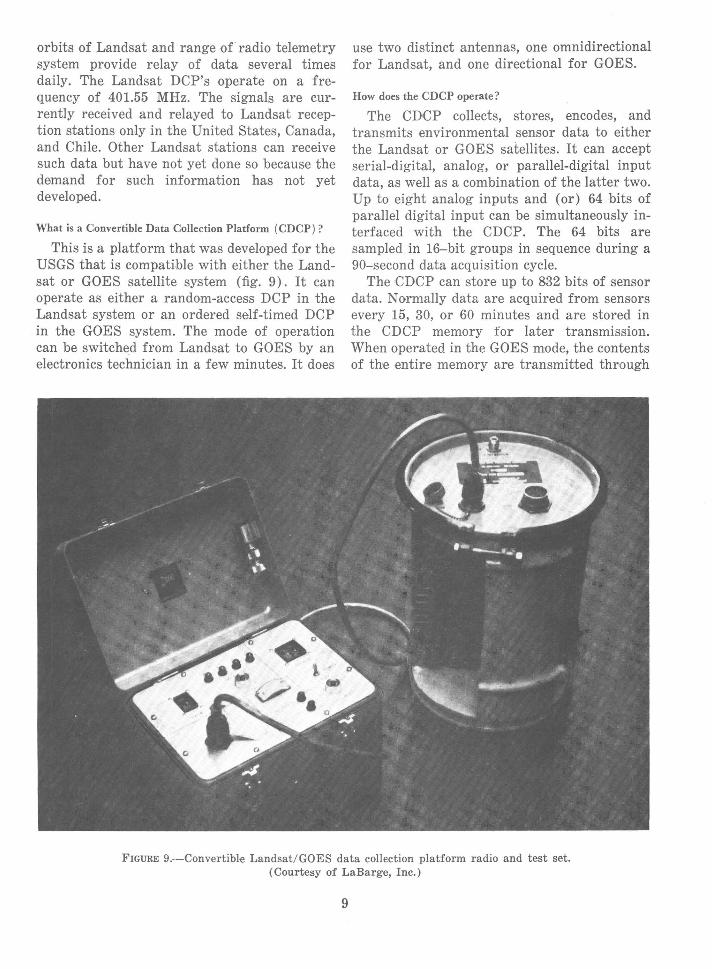
What is a Convertible Data Collection Platform ( CDCP) ?
This is a platform that was developed for the USGS that is compatible with either the Landsat or GOES satellite system (fig. 9). It can operate as either a random-access DCP in the Landsat system or an ordered self-timed DCP in the GOES system. The mode of operation can be switched from Landsat to GOES by an electronics technician in a few minutes. It does
use two distinct antennas, one omnidirectional for Landsat, and one directional for GOES.
How does the CDCP operate?
The CDCP collects, stores, encodes, and transmits environmental sensor data to either the Landsat or GOES satellites. It can accept serial-digital, analog, or parallel-digital input data, as well as a combination of the latter two. Up to eight analog inputs and (or) 64 bits of parallel digital input can be simultaneously interfaced with the CDCP. The 64 bits are sampled in 16-bit groups in sequence during a 90-.second data acquisition cycle.
The CDCP can store up to 832 bits of sensor data. N o·rmally data are acquired from sensors every 15, 30, or 60 minutes and are stored in the CDCP memory for later transmission. When operated in the GOES mode, the contents of the entire memory are transmitted thl'ough
FIGURE 9.-Convertible Landsat/ GOES data collection platform radio and test set. (Courtesy of LaBarge, Inc.)
9
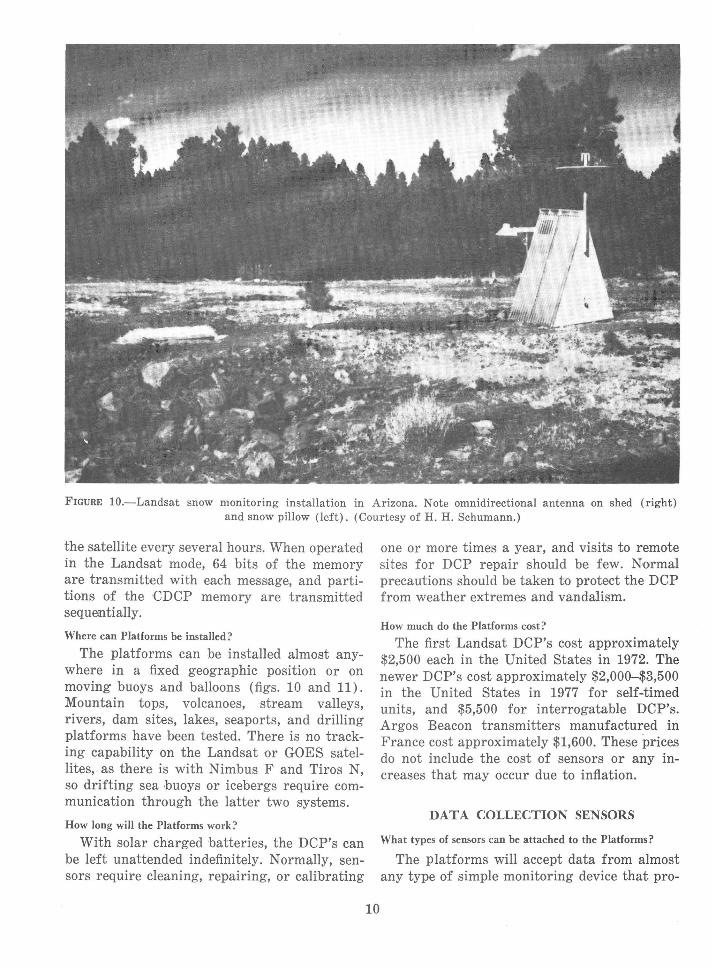
FIGURE 10.-Landsat snow monitoring installation in Arizona. Note omnidirectional antenna on shed (right) and snow pillow (left). (Courtesy of H. H. Schumann.)
the satellite every several hours. When operated in the Landsat mode, 64 bits of the memory are transmitted with each message, and partitions of the CDCP memory are transmitted sequentially.
Where can Platforms be installed?
The platforms can be installed almost anywhere in a fixed geographic position or on moving buoys and balloons (figs. 10 and 11). Mountain tops, volcanoes, stream valleys, rivers, dam sites, lakes, seaports, and drilling platforms have been tested. There is no tracking capability on the Landsat or GOES satellites, as there is with Nimbus F and Tiros N, so drifting sea buoys or icebergs require communication through the latter two systems.
How long will the Platforms work?
With solar charged batteries, the DCP's can be left unattended indefinitely. Normally, sensors require cleaning, repairing, or calibrating
10
one or more times a year, and visits to remote sites for DCP repair should be few. Normal precautions should be taken to protect the DCP from weather extremes and vandalism.
How much do the Platforms cost?
The first Landsat DCP's cost approximately $2,500 each in the United States in 1972. The newer DCP's cost approximately $2,000-$3,500 in the United States in 1977 for self-timed units, and $5,500 for interrogatable DCP's. Argos Beacon transmitters manufactured in France cost approximately $1,600. These prices do not include the cost of sensors or any increases that may occur due to inflation.
DATA COLLECTION SENSORS
What types of sensors can be attached to the Platforms?
The platforms will accept data from almost any type of simple monitoring device that pro-
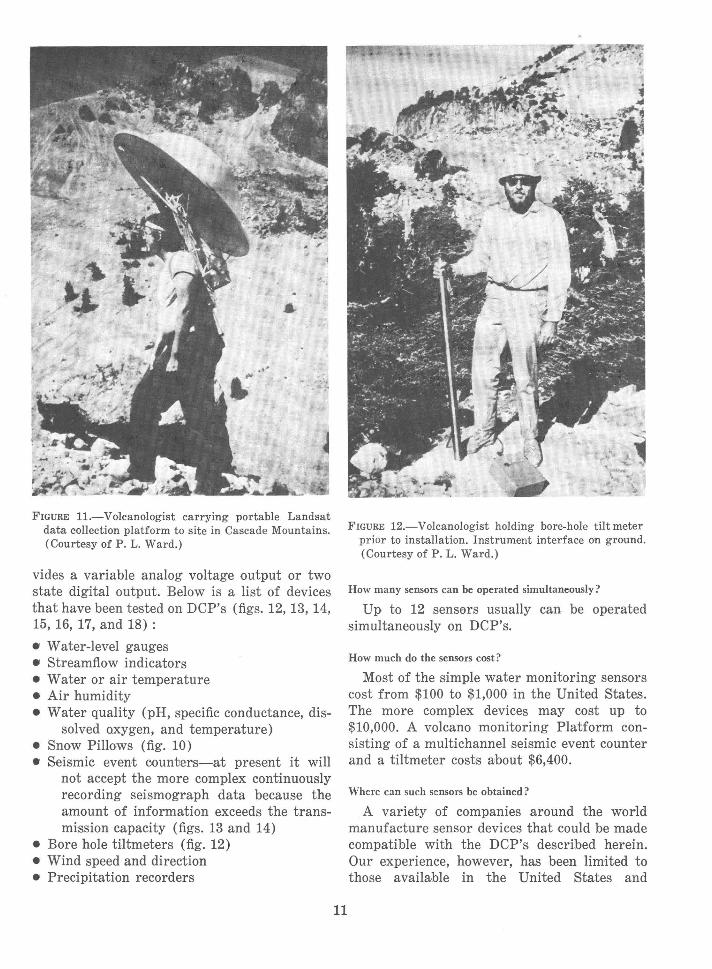
FIGURE 11.-Volcanologist carrying portable Landsat data collection platform to site in Cascade Mountains. (Courtesy of P. L. Ward.)
vides a variable analog voltage output or two state digital output. Below is a list of devices that have been tested on DCP's (figs. 12, 13, 14, 15, 16, 17, and 18):
• Water-level gauges • Streamflow indicators • Water or air temperature • Air humidity • Water quality (pH, specific conductance, dis
solved oxygen, and temperature) • · Snow Pillows (fig. 10) • Seismic event counters-at present it will
not accept the more complex continuously recording seismograph data because the amount of information exceeds the transmission capacity (figs. 13 and 14)
• Bore hole tiltmeters (fig. 12) • Wind speed and direction • Precipitation recorders
11
FIGURE 12.-Volcanologist holding bore-hole tilt meter prior to installation. Instrument interface on ground. (Courtesy of P. L. Ward.)
How many sensors can be operated simultaneously?
Up to 12 sensors usually can be operated simultaneously on DCP's.
How much do the sensors cost?
Most of the simple water monitoring sensors cost from $100 to $1,000 in the United States. The more complex devices may cost up to $10,000. A volcano monitoring Platform consisting of a multichannel seismic event counter and a tiltmeter costs about $6,400.
Where can such sensors be obtained?
A variety of companies around the world manufacture sensor devices that could be made compatible with the DCP's described herein. Our experience, however, has been limited to those available in the United States and
ERTS IOIITORS 16 VOLCAIOES ... daily
I I I to 311 I I I I I I I I I I I
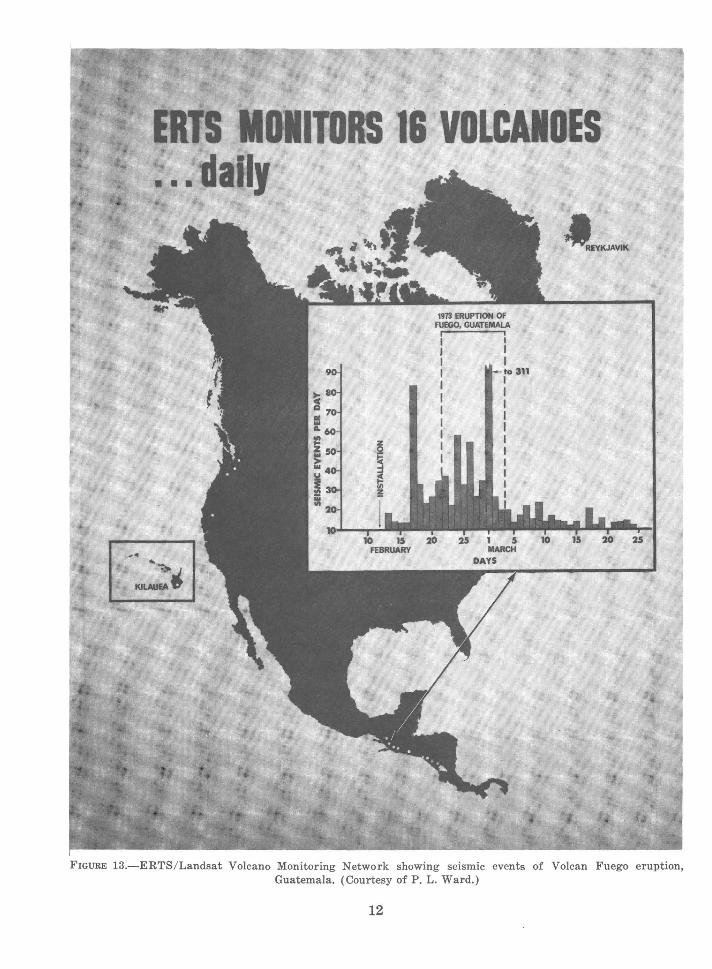
FIGURE 13.-ERTS/Landsat Volcano Monitoring Network showing seismic events of Volcan Fuego eruption, Guatemala. (Courtesy of P. L. Ward.)
12
0
,.,
-. • l i " l ~ I .. . '
~ ~!I~Yit ['ll"T CQtN!(R
f • p l..... u kw: •Ufl:!fik<A
~f
d"M:l """'-'""'
•
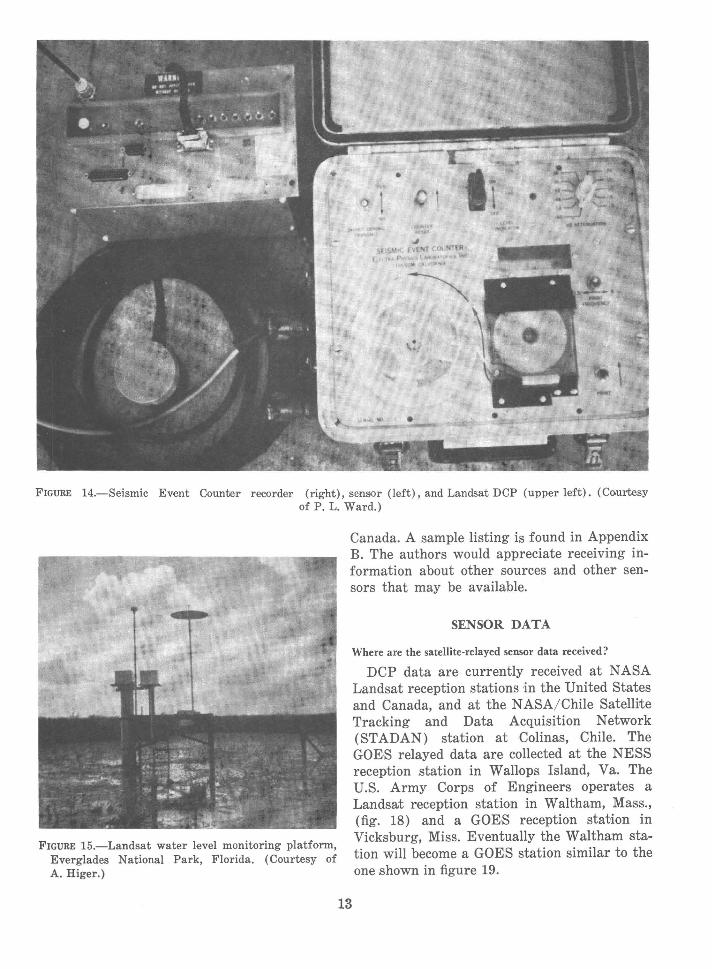
FIGURE 14.-Seismic Event Counter recorder (right), sensor (left), and Landsat DCP (upper left). (Courtesy of P. L. Ward.)
FIGURE 15.-Landsat water level monitoring platform, Everglades National Park, Florida. (Courtesy of A. Higer.)
Canada. A sample listing is found in Appendix B. The authors would appreciate receiving information about other sources and other sensors that may be available.
13
SENSOR DATA
Where are the satellite· relayed sensor data received?
DCP data are currently received at NASA Landsat reception stations in the United States and Canada, and at the NASA/ Chile Satellite Tracking and Data Acquisition Network (STADAN) station at Colinas, Chile. The GOES relayed data are collected at the NESS reception station in Wallops Island, Va. The U.S. Army Corps of Engineers operates a Landsat reception station in Waltham, Mass., (fig. 18) and a GOES reception station in Vicksburg, Miss. Eventually the Waltham station will become a GOES station similar to the one shown in figure 19.
---.: .. -· ~-----------·-- -------- -:··-··- ---·---.: --
SHARK RIVER SLOUGH, EVERGLADES NATIONAL PARK
ERTS·liiACES fOI •ASIIUIC
CIABS II .TEl ..
+ ERTS DATA
COLLECTION PLATFORM TO RELAY WATER LEVEL --
CURRENT VOLUME Of WATER IN STORACE
NECESSARY DATA FOR WILDLIFE MANAGEMENT
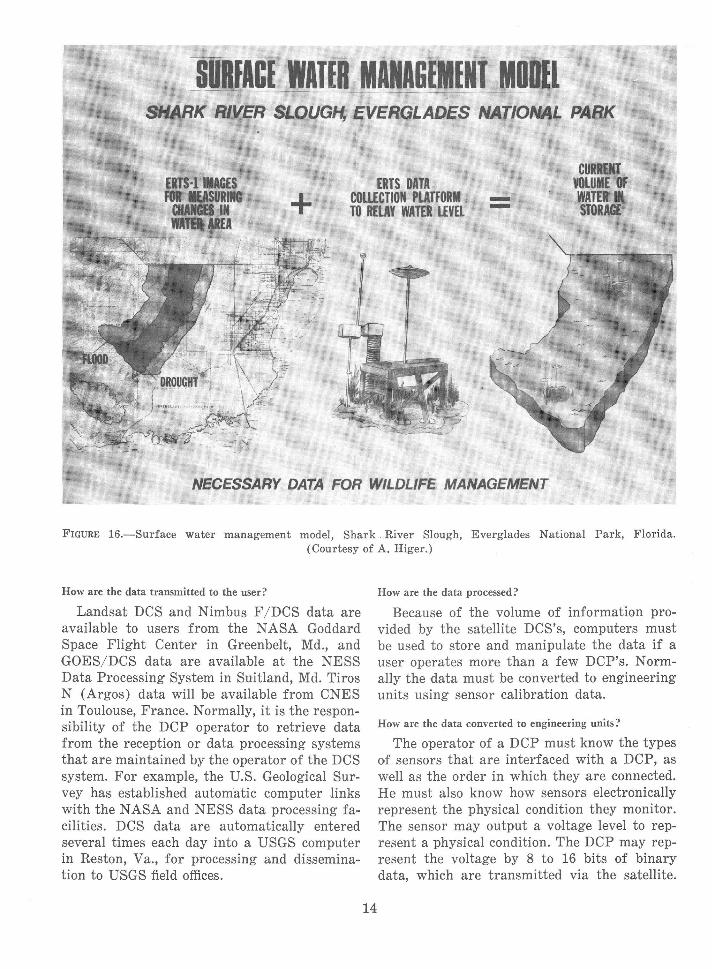
FIGURE 16.-Surface water management model, Shark. River Slough, Everglades National Park, Florida. (Courtesy of A. Higer.)
How are the data transmitted to the user?
Landsat DCS and Nimbus F /DCS data are available to users from the NASA Goddard Space Flight Center in Greenbelt, Md., and GOES/DCS data are availahle at the NESS Data Processing System in Suitland, Md. Tiros N (Argos) data will be available from CNES in Toulouse, France. Normally, it is the responsibility of the DCP operator to retrieve data from the reception or data processing systems that are maintained by the operator of the DCS system. For example, the U.S. Geological Survey has established automatic computer links with the NASA and NESS data processing facilities. DCS data are automatically entered several times each day into a USGS computer in Reston, Va., for processing and dissemination to USGS field offices.
14
How are the data processed?
Because of the volume of information provided by the satellite DCS's, computers must be used to store and manipulate the data if a user operates more than a few DCP's. Normally the data must be converted to engineering units using sensor calibration data.
How are the data converted to engineering units?
The operator of a DCP must know the types of sensors that are interfaced with a DCP, as well as the order in which they are connected. He must also know how sensors electronically represent the physical condition they monitor. The sensor may output a voltage level to represent a physical condition. The DCP may represent the voltage by 8 to 16 bits of binary data, which are transmitted via the satellite.
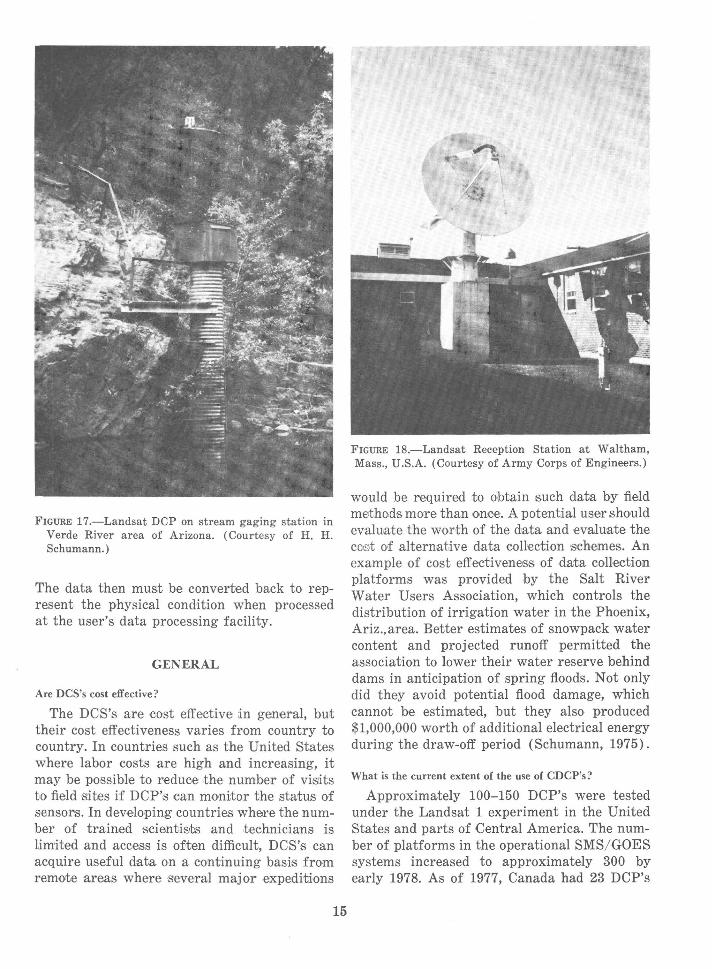
FIGURE 17.-Landsat DCP on stream gaging station in Verde River area of Arizona. (Courtesy of H. H. Schumann.)
The data then must be converted back to represent the physical condition when processed at the user's data processing facility.
GENERAL
Are DCS's cost effective?
The DCS's ar,e oost effective in general, but their cost effectiveness varies from country to country. In countries such as the United States where labor costs are high and increasing, it may be po,ssible to reduce the number of vis1its to field sit,es if DCP's can monitor the status of sensors. In developing countries where the number of trained scientis,ts and ,technicians, is limit~ed and access is often difficult, DCS's can acquire useful data on a continuing basis from remote areas where S'everal major expeditions
15
FIGURE 18.-Landsat Reception Station at Waltham, Mass., U.S.A. (Courtesy of Army Corps of Engineers.)
would be required :to obtain 1such data by field methods more than once. A potential user should evaluate the wor,th of the data and evaluate the co's't of alternative data eollection sehemes. An example of cost effectiveness of data coHection platforms was provided by the Salt River Water Users Association, which controls the distribution of irrigation water in the Phoenix, Ariz.,area. Better estimates of snowpack water content and projected runoff permitted the association to lower their water reserve behind dams in anticipation of spring floods. Not only did they avoid potential flood damage, which cannot be estimated, but they also produced $1,000,000 worth of additional electrical energy during the draw-off period (Schumann, 1975).
What is the current extent of the use of CDCP's?
Approximately 100-150 DCP's were tested under the Landsat 1 experiment in the United States and parts of Central America. The number of platforms in the operational SMS/ GOES systems increased to approximately 300 by early 1978. As of 1977, Canada had 23 DCP's
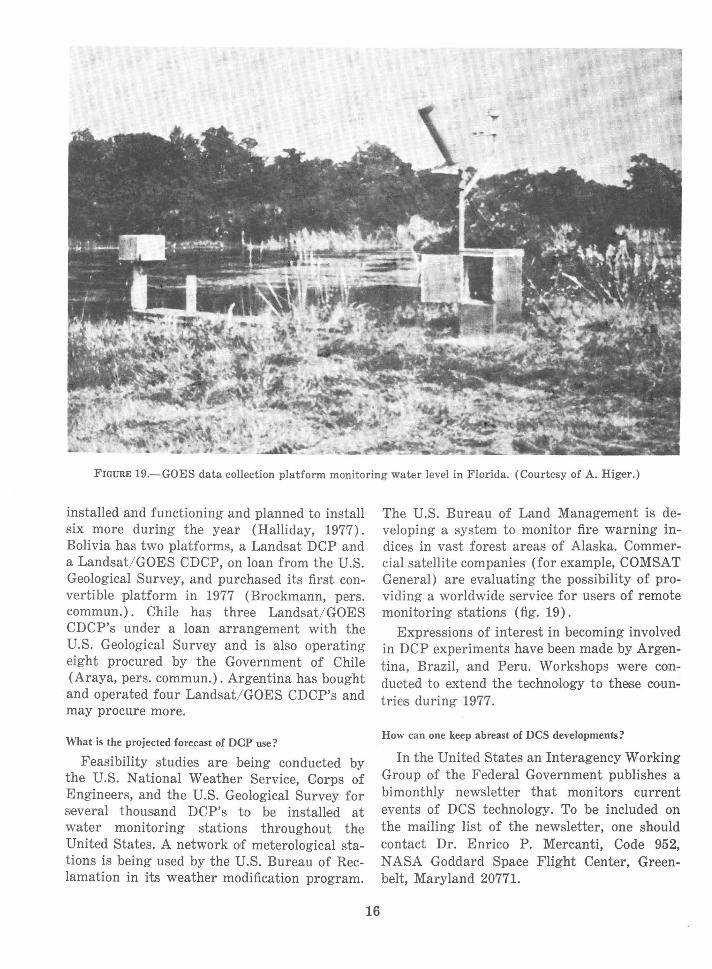
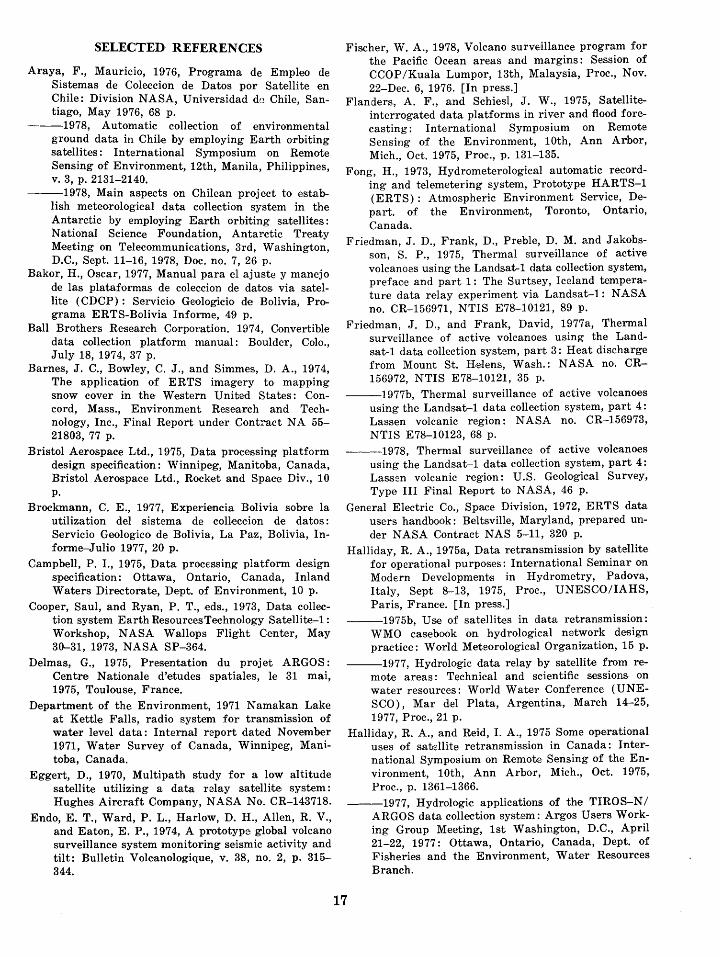
FIGURE 19.-GOES data collection platform monitoring water level in Florida. (Courtesy of A. Higer.)
installed and functioning and planned to install six more during the year (Halliday, 1977). Bolivia has two platforms, a Landsat DCP and a Landsat/ GOES CDCP, on loan from the U.S. Geological Survey, and purchased its first convertible platform in 1977 (Brockmann, pre.rs. commun.). Chile has three Landsat/ GOES CDCP's under a loan arrangement with the U.S. Geological Survey and is also operating eight procured by the Government of Chile (Araya, pers. commun.). Argentina has bought and operated four Landsat/ GOES CDCP's and may procure more.
What is the projected forecast of DCP use?
Feasibility studies are being conducted by the U.S. National Weather Service, Corps of Engineers, and the U.S. Geological Survey for s·everal thousand DCP's to be installed at water monitoring stations throughout the United States. A network of meterological stations is being used by the U.S. Bureau of Reclamation in its weather modification program.
16
The U.S. Bureau of Land Management is developing a system to monitor fire warning indices in vast forest areas of Alaska. Commercial satellite companies (for example, COMSAT General) are evaluating the possibility of providing a worldwide service for users of remote monitoring stations (fig. 19).
Expressions of interest in ·becoming involved in DCP experiments have been made by Argentina, Brazil, and Peru. Workshops were conduc,ted to extend the technology to these countries during 1977.
How can one keep abreast of DCS developments?
In the United States an Interagency Working Group of the Federal Government publishes a bimonthly newsletter that monitors current events of DCS technology. To be included on the mailing list of the newsletter, one should contact Dr. Enrico P. Mercanti, Code 952, NASA Goddard Space Flight Center, Greenbelt, Maryland 20771.
SELECTED REFERENCES
Araya, F., Mauricio, 1976, Programa de Empleo de Sistemas de Coleccion de Datos por Satellite en Chile: Division NASA, Universidad do Chile, Santiago, May 1976, 68 p.
---1978, Automatic collection of environmental ground data in ChHe by employing Earth orbiting satellites: International Symposium on Remote Sensing of Environment, 12th, Manila, Philippines, v. 3, p. 2131-2140.
---1978, Main aspects on Chilean project to establish meteorological data collection system in the Antarctic by employing Earth orbiting satellites: National Science Foundation, Antarctic Treaty Meeting on Telecommunications, 3rd, Washington, D.C., Sept. 11-16, 1978, Doc. no. 7, 26 p.
Bakor, H., Oscar, 1977, Manual para el ajuste y manejo de las plataformas de coleccion de datos via satellite ( CDCP) : Servicio Geologicio de Bolivia, Pro-grama ERTS-Bolivia Informe, 49 p.
Ball Brothers Re·search Corporation. 197 4, Convertible data collection platform manual: Boulder, Colo., July 18, 1974, 37 p.
Barnes, J. C., Bowley, C. J., and Simmes, D. A., 1974, The application of ERTS imagery to mapping snow cover in the Western United States: Concord, Mass., Environment Research and Technology, Inc., Final Report unde·r Cont~act NA 55-21803, 77 p.
Bristol Aerospace Ltd., 1975, Data processing platform design specification: Winnipeg, Manitoba, Canada, Bristol Aerospace Ltd., Rocket and Space Div., 10 p.
Brockmann, C. E., 1977, Experiencia Bolivia sobre la utilization del sistema de colleccion de datos: Servicio Geologico de Bolivia, La Paz, Bolivia, Informe-Julio 1977, 20 p.
Campbell, P. 1., 1975, Data processing platform design sp·ecification: Ottawa, Ontario, Canada, Inland Waters Directorate, De·pt. of Environment, 10 p.
Cooper, Saul, and Ryan, P. T., eds., 1973, Data collection system Earth Resources Technology Satellite-!: Workshop, NASA Wallops Flight Center, May 30-31, 1973, NASA SP-364.
Delmas, G., 1975, Presentation du projet ARGOS: Centre Nationale d'etudes spatiales, le 31 mai, 1975, Toulouse, France.
Department of the Environment, 1971 Namakan Lake at Kettle Falls, radio system for transmission of water level data: Internal report dated November 1971, Water Survey of Canada, Winnipeg, Manitoba, Canada.
Eggert, D., 1970, Multipath study for a low altitude satellite utilizing a data relay satellite, system: Hughes Aircraft Company, NASA No. CR-143718.
Endo, E. T., Ward, P. L., Harlow, D. H., Allen, R. V., and Eaton, E. P., 1974, A prototyp~ global volcano surveillance system monitoring seismic activity and tilt: Bulletin Volc-anologique, v. 38, no. 2, p. 315-344.
Fischer, W. A., 1978, Volcano surveillance program for the Pacific Oce-an areas and margins : Session of CCOP /Kuala Lumpor, 13th, Malaysia, Proc., Nov. 22-Dec. 6, 1976. [In press.]
Flanders, A. F., and Schiesl, J. W., 1975, Satelliteinterrogated data platforms in riv:er and flood forecasting: International Symposium on Remote Sensing of the Environment, lOth, Ann Arbor, Mich., Oct. 1975, Proc., p. 131-135.
Fong, H., 1973, Hydrometerological automatic recording and telemetering system, Prototype HARTS-1 (ERTS): Atmospheric Environment Service, Depart. of the Environment, Toronto, Ontario, Canada.
Friedman, J. D., Frank, D., Preble, D. M. and Jakobsson, S. P., 1975, Thermal surveillance of active volcanoes using the Landsat-1 data collection system, prefaee and part 1: The Surtsey, Iceland temperature data relay experiment via Landsat-1: NASA no. CR-156971, NTIS E78-10121, 89 p.
Friedman, J. D., and Frank, David, 1977a, Thermal surveillance of active volcanoes using the Landsat-! data collection system, par:t 3: Heat discharge from Mount St. Helens, Wash.: NASA no. CR-156972, NTIS E78-10121, 35 p.
---1977b, Thermal surveillance of active volcanoes using the Landsa~l data collection system, part 4: Lassen volcanic region: NASA no. CR-156973, NTIS E78-10123, 68 p.
---1978, Thermal surveillanc·e of active volcanoes using the Landsat-1 data collection system, part 4: Lassen volcanic region: U.S. Geological Survey, Type III Final Report to NASA, 46 p.
General Electric Co., Space Division, 1972, ERTS data users handbook: Beltsville, Maryland, prepared under NASA Contract NAS 5-11, 320 p.
Halliday, R. A., 1975-a, Data retransmission by satellite for operational purposes: International Seminar on Modern Development·s in Hydrometry, Padova, Italy, Sept 8-13, 1975, Proc., UNESCO/IAHS, Paris, France. [In press.]
---1975b, Use of satellites in data retransmission: WMO casebook on hydrological network design practice: World. Meteorological Organization, 15 p.
---1977, Hydrologic data relay by satellite from remote areas: Technical and scientific sessions on water resources: w.oorld Water Conference (UNESCO), Mar del Plata, Argentina, March 14-25, 1977, Proc., 21 p.
Halliday, R. A., and Reid, I. A., 1975 Some operational uses of sat,ellite retransmission in Canada: International Symposium on Remote Sensing of the Environment, lOth, Ann Arbor, Mich., Oct. 1975, Proc., p. 1361-1366.
---1977, Hydrologic applications of the TIROS-N/ ARGOS data collection syst.em: Argos Users Working Group Meeting, 1st Washington, D.C., April 21-22, 1977: Ottawa, Ontario, Canada, Dept. of Fisheries and the Environment, Water Resources Branch.
17
Halliday, R. A., Reid, I. A., and Terroux, A. C. D., 1976, Retransmission of hydrometric data in Canada: Ottawa, Dept. of Environment, R.eport to NASA no. CR-149651, 25 p. NTIS E-77-10116.
Hig.er, A. L., Coker, A. E., and Cordes, E. H., 1973, Water-management models in Florida from ERTS-1 data: Earth Resources Technology Sa.tellite-1 Sympos.ium, 3rd, Washington, D.C., Dec. 10-14, 1973, v. 1, sec. B, p. 1071-1088.
Kahan, A. M., 1974, Use of the ERTS-1 satellite data collection system in monitoring weather conditions for control of cloud seeding operations: Denver, Colorado, U.S. Bureau of Reclamation, Type III Final Report to NASA, July 1974, 112 p.
---1976, Use of the Landsat-2 data collection system in the Colorado river basin weather modification program: Denver, Colorado, U.S. Bureau of Reclamation, Type III Final Report to NASA, Feb. 1976, 103 p.
Krus, Jan., 1973, A water resource monitoring platform: Ottawa, Ontario, Canada, Dept. of the Environment, Type II Report to NASA for Period January to Aug., 1973.
LaBarge, Inc., Electronics Division, 1975, Instruction manual for the convertible data cellection platform (CDCP) and related equipment: Tulsa, Okla.
Ludwig, H., 1974, The NOAA Operational Environmental Satellite System-Status and Plans: American Meteorological Society, Conference on Aerospace and Aeronautical Meteorology, 6th, El Paso, Tex., Nov. 12-15, 1974.
The Magnavox Company, 1974, Interrogated data collection Platform radio set, operation and mainte• nance manual: Fort Wayne, Ind., Jan. 15, 1974.
Maitre, J., and others, 1974, Les sources d'energie autonomE'S dans les telecommunications: Commutation et Electronique, no. 44, janvier 1974, France, p. 85-96.
Mathematica, Inc., 1974, The potential market for satellite data collection and localization services in the Unit,ed States: Princeton, N. J., Sept. 27, 1974, 94 p.
McKim, H. L., Cooper, Saul, Merry, C. J., and Anderson, D. M., 1975, Applications of remote sensing for Corps of Engineers programs in New England: International Symposium on Remote Sensing of the Environment, lOth, Ann Arbor, Mich., Oct. 1975, Proc., p. 189-190.
Moody, D. W., and Preble, D. M., 1975, The potential impact of satellite data relay systems on the operation of hydrologic data programs: World Congress on Water Resources, New Delhi, India, Dec. Proc., 12-17, 1975. [In press.]
National Aeronautics and Space Administration, 1971, Earth Resources Technology Satellite data users handbook: Goddard Space Flight Center, Greenbelt, Md., Doc. no. 71 SD4249.
Nelson, M. L., 1975, Da.ta collection system geostationary operational environmental satellite-preliminary report: National Oceanic and Atmospheric Administration, National Environmental Satellite Service, NOAA Technical memo NESS67, 48 p.
18
Paulson, R. W., 1973, An evaluation of the ERTS data collection system as a potential operational tool: Earth Resources Technology Satellite-1 Symposium, 3rd, Washington, D.C., Dec. 10-14, 1973, Proc., v. 1, s~c. B, p. 1099-1111.
---1975, Use of earth satellite technology for telemetering hydrometeorological station data: International Seminar on Modern Developments in Hydrometry, Sept. 8-13, 1975, Padova, Italy, Proc., UNESCO/IAHS, Paris, France. [In press.]
---1976, Use of Earth satellites for automation. of hydrologic data collection: Inte·rnational Seminar on Organizations and Operation of Hydrologic Services, Ottawa, Canada. July 15-16, 1976, Proc.
Penick, David, 1975, The use of ERTS DCS in re1servoir management and op.eration: International Symposium on Remote Sensing of the EnvironmEnt, lOth, Ann Arbor, Mich., Oct. 1975, Proc. p. 191.
P.ersoons, E., and others, 1974, Telemeasurement in hydrology: International Water Resources Association, International S.eminar on Water Resources Instrumentation, Chicago, June 4-6, 1974, Proc., v. 1, p. 243-253.
Preble, D. M., Friedman, J. D., and Frank D., 1976, Thermal surveillance of active volcanoes using the Landsat-1 data collection system, pt. 5: Electronic thermal ~sensor and data collection platform technology: NASA no. CR-156974, NTIS E78-10124, 66 p.
Pric·e, G. R., and Scheetz, V. R., 1977, Automatic environmental surface observation platforms (AESOP) for the high plains experiment (HIPLEX) : Bureau of Reclamation, Atmospheric and Water Resource Divis.ion, Contract no. 6-07-DR-20030, 10 p.
Rango, Albert, 1975, Operational applications of satellite snowcover observations project: International Symposium on Remote Sensing of the Environment, lOth, Ann Arbor, Mich., Oct. 1975, Proc., p. 194-195.
RCA Research Laboratories, 1975, Final report on a feasibility study of a data retransmis1sion platform: RCA Ltd., Ste Anne de Bellevue, Quebec, Canada, June 1973, 177 p.
Robinove, C. J., 1969, Space technology in hydrologic applications: International Seminar for Hydrology Professors, 1st, Univ. of Illinois, Dept. of Civil Engineering, Urbana, Ill., July 13-15, 1969, v. 1, p. 88-107.
Rattner, Donald, and Price, G. R., 1978, Testing of sateUite uplinked remote surface weather stations in the Sierra N e~vada: Ame·rican Mete·rological Society Conference on Sierra Nevada Meteorology, Lake Tahoe, California, June 19-21, 1978, Preprint, p. 19-22.
Schumann, H. H., 1974, Hydrologic applications of ERTS-1 data coHection system in central Arizona: Earth Resources Technology Satellite Symposium, 3rd, Washington, D.C., Dec. 10-14, 1973, Proc., v. 1, sec. B., p. 1213-1223.
Vannostrand, G. C., and Meyerson, G., 1973, Data collection platform/field test set program: Beltsville, Md., General Electric Co., NASA CR-133801, NTIS E 73-11008.
Ward, P. L., 1974, A prototyp1e global volcano surveillance syst€m and Identification of a volcano-tectonic fault in Central America: Bulletin Volcanologique, v. 37, no. 3 p. 438-442.
Ward, P. L., Endo, E. T., Harlow, D. H .. Allen, Rex, Marquez, Dan, and Eaton, J. P., 1974, Development and evaluation of a prototype global volcano
19
surveillance. system utilizing the ERTS-1 satellite data collection system: U.S. Geological Survey, open file rept., 154 p. See also NASA no. CR-139222 and NTIS no. E74-10689.
World Meteorological Organization, 197 4, Guide to hydrological practices: Geneva, Switzerland, WMO no. 168, p. 4.5-4.9.
---1975, Information of meteorological satellite programmes operated by members and organizations: Geneva, Switzerland, WMO no. 411.
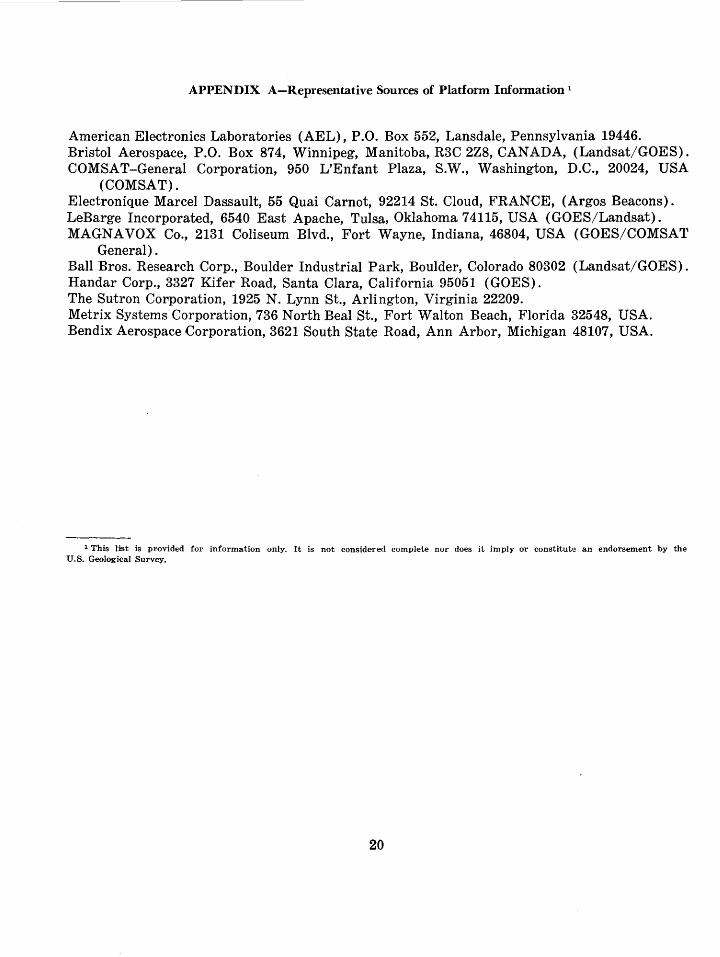
APPENDIX A-Representative Sources of Platform Information 1
American Electronics Laboratories (AEL), P.O. Box 552, Lansdale, Pennsylvania 19446. Bristol Aerospace, P.O. Box 874, Winnipeg, Manitoba, R3C 2Z8, CANADA, (Landsat/GOES). COMSAT--General Corporation, 950 L'Enfant Plaza, S.W., Washington, D.C., 20024, USA
(COMSAT). Electronique Marcel Das.sault, 55 Quai Carnot, 92214 St. Cloud, FRANCE, (Argos Beacons). LeBarge Incorporated, 6540 East Apache, Tulsa, Oklahoma 74115, USA (GOES/Landsat). MAGNA VOX Co., 2131 Coliseum Blvd., Fort Wayne, Indiana, 46804, USA (GOES/COMSA1.'
General). Ball Bros. Research Corp., Boulder Industrial Park, Boulder, Colorado 80302 (Landsat/GOES). Handar Corp., 3327 Kifer Road, Santa Clara, California 95051 (GOES). The Sutron Corporation, 1925 N. Lynn St., Arlington, Virginia 22209. Metrix Systems Corporation, 736 North Beal St., Fort Walton Beach, Florida 32548, USA. Bendix Aerospace Corporation, 3621 South State Road, Ann Arbor, Michigan 48107, USA.
1 This Ust is pmvided for information only. It is not considered complete nor does it imply or constitute an endorsement by the U.S. Geological Survey.
20
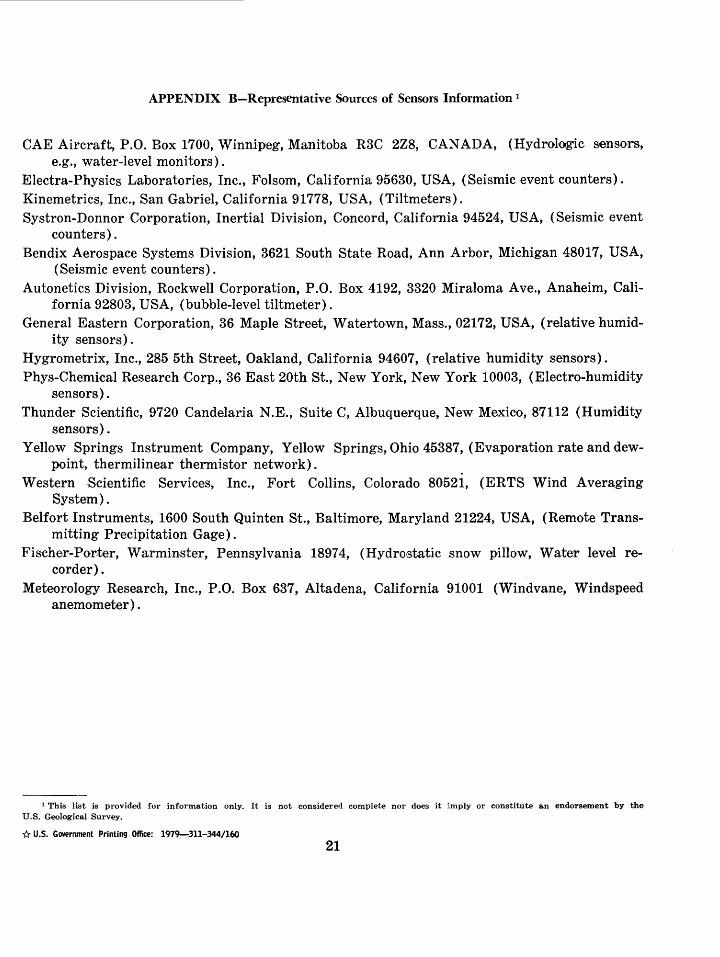
APPENDIX B-Representative Sources of Sensors Information 1
CAE Aircraft, P.O. Box 1700, Winnipeg, Manitoba R3C 2Z8, CANADA, (Hydrologic senso·rs., e.g., water-level monitors).
Electra-Physics Laboratories, Inc., Folsom, California 95630, USA, (Seismic event counters). Kinemetrics, Inc., San Gabriel, California 91778, USA, (Tiltmeters). Systron-Donnor Corporation, Inertial Division, Concord, California 94524, USA, (Seismic event
counters). Bendix Aerospace Systems Division, 3621 South State Road, Ann Arbor, Michigan 48017, USA,
(Seismic event counters) . Autonetics Division, Rockwell Corporation, P.O. Box 4192, 3320 Miraloma Ave., Anaheim, Cali
fornia 92803, USA, (bubble-level tiltmeter). General Eastern Corporation, 36 Maple Street, Watertown, Mass., 02172, USA, (relative humid
ity sensors). Hygrometrix, Inc., 285 5th Street, Oakland, California 94607, (relative humidity sensors). Phys-Chemical Research Corp., 36 East 20th St., New York, New York 10003, (Electro-humidity
sensors). Thunder Scientific, 9720 Candelaria N.E., Suite C, Albuquerque, New Mexico, 87112 (Humidity
sensors). Yellow Springs Instrument Company, Yellow Springs, Ohio 45387, (Evaporation rate and dew
point, thermilinear thermistor network). Western .Scientific Services, Inc., Fort Collins, Colorado 80521, (ERTS Wind Averaging
System). Belfort Instruments, 1600 South Quinten St., Baltimore, Maryland 21224, USA, (Remote Trans
mitting Precipitation Gage). Fischer-Por,ter, Warminster, Pennsylvania 18974, (Hydrostatic snow pillow, Water level re
corder). Meteorology Research, Inc., P.O. Box 637, Altadena, California 91001 (Windvane, Windspeed
anemometer) .
1 This list is provided for information only. It is not considered complete nor does it i.mply or constitute an endorsement by the U.S. Geological Survey.
1:! U.S. Government Printing Office: 1979-311-344/160
21

![Photonic crystals for monitoring fa tigue phenomena in ...dzonta/download/Publications/[B30]-SPIE09-Crysta… · Photonic crystals for monitoring fa tigue phenomena in steel structures](https://img.pdfslide.us/doc/110x75/5eaf2e3cc7c0ac1ba2665720/photonic-crystals-for-monitoring-fa-tigue-phenomena-in-dzontadownloadpublicationsb30-spie09-crysta.jpg)