Embed Size (px)
Citation preview

Promoting a knowledge based NHS www.southeastlibrarysearch.nhs.uk Promoting a knowledge based NHS www.southeastlibrarysearch.nhs.uk
Introduction to Medical Statistics
Mark Kerr Clinical Librarian, EKHUFT
CLIST July 30th 2014
Promoting a knowledge based NHS www.southeastlibrarysearch.nhs.uk

Promoting a knowledge based NHS www.southeastlibrarysearch.nhs.uk Promoting a knowledge based NHS www.southeastlibrarysearch.nhs.uk
Learning objectives
By the end of this session you will:
• understand how statistics represent medical
research
• interpret statistical tables in research papers
• describe common medical statistical concepts
• identify statistical inadequacies in research
• Interpret statistical diagrams

Promoting a knowledge based NHS www.southeastlibrarysearch.nhs.uk Promoting a knowledge based NHS www.southeastlibrarysearch.nhs.uk

Promoting a knowledge based NHS www.southeastlibrarysearch.nhs.uk Promoting a knowledge based NHS www.southeastlibrarysearch.nhs.uk
The different types of statistics
Descriptive statistics - summarise the population and the results
Statistics for validity – describe the reliability of the study and how the results are applicable to others
Statistics to demonstrate difference (statistics for probability) – describe the results as comparisons between groups under study
Promoting a knowledge based NHS www.southeastlibrarysearch.nhs.uk Promoting a knowledge based NHS www.southeastlibrarysearch.nhs.uk
Descriptive statistics

Promoting a knowledge based NHS www.southeastlibrarysearch.nhs.uk Promoting a knowledge based NHS www.southeastlibrarysearch.nhs.uk

Promoting a knowledge based NHS www.southeastlibrarysearch.nhs.uk Promoting a knowledge based NHS www.southeastlibrarysearch.nhs.uk
Descriptive statistics
Summarise the population and the results
1) Numerical – where a value can fall at any point in a range (e.g. weight)
2) Categorical – where a value is selected from specific options (e.g. gender) – can be ‘nominal’ or ‘ordinal’
Some measurements can fall into either – BMI (e.g. 28, or ‘overweight’)
Different techniques are used to summarise each type of data.

Promoting a knowledge based NHS www.southeastlibrarysearch.nhs.uk Promoting a knowledge based NHS www.southeastlibrarysearch.nhs.uk
Classification of Types of Data

Promoting a knowledge based NHS www.southeastlibrarysearch.nhs.uk Promoting a knowledge based NHS www.southeastlibrarysearch.nhs.uk
Normal vs skewed data The type of data distribution matters when it comes to
summarising and (later) statistical testing
www.southalabama.edu/coe/bset/johnson/lectures/lec15.htm
Data distributions

Promoting a knowledge based NHS www.southeastlibrarysearch.nhs.uk Promoting a knowledge based NHS www.southeastlibrarysearch.nhs.uk
‘Averaging’ values - mean
Used to calculate the average where the data are ‘normally distributed’, ie a point is equally likely to appear above or below the mean:
To calculate the mean: – Add up all the values – Divide by the total number of values
1 + 1 + 2 + 3 + 4 + 5 +5 + 6 + 7 + 9 = 43 43 / 10 = 4.3 = Mean Susceptible to extreme outliers
1 1 2 3 4 5 5 6 7 9

Promoting a knowledge based NHS www.southeastlibrarysearch.nhs.uk Promoting a knowledge based NHS www.southeastlibrarysearch.nhs.uk
‘Averaging’ data - median
1 1 2 2 2 2 2 2 3 3 3 3 4 4 4 5 6 6 7 9 15
Median is used for skewed data where values are not evenly
distributed around a central value.
To calculate the median, line up all the values and find the
centre value. If there is an even number of values, take the
mean of the 2 centre values.
Less susceptible to outliers…

Promoting a knowledge based NHS www.southeastlibrarysearch.nhs.uk Promoting a knowledge based NHS www.southeastlibrarysearch.nhs.uk
‘Averaging’ data - mode
1 1 2 2 2 2 2 2 3 3 3 3 4 4 4 5 6 6 7 9 15
Mode is often used for categorical data where values
cannot be added up. You identify the most frequent
value. Here it would be 2.
You have 30 seconds to calculate/guesstimate the mean, mode and median

Promoting a knowledge based NHS www.southeastlibrarysearch.nhs.uk Promoting a knowledge based NHS www.southeastlibrarysearch.nhs.uk
What is the difference?
0
1
2
3
4
5
6
7
1 2 3 4 5 6 7 8 9 10 11 12 13 14 15
Fre
qu
en
cy
Length of Stay
Median
= 3
Mean
= 4.1
Mode
= 2

Promoting a knowledge based NHS www.southeastlibrarysearch.nhs.uk Promoting a knowledge based NHS www.southeastlibrarysearch.nhs.uk
Summarising numerical results
We summarise numerical results by reporting:
Mean
Median
Standard Deviation
Inter-Quartile Range
1 1 2 3 4 5 5 6 7 9
3 3 4 4 4 5 5 5 5 7
AVERAGE
SPREAD

Promoting a knowledge based NHS www.southeastlibrarysearch.nhs.uk Promoting a knowledge based NHS www.southeastlibrarysearch.nhs.uk
Inter-quartile range
1 1 2 2 2 2 2 2 3 3 3 3 4 4 4 5 6 6 7 9 15
The inter-quartile range (IQR) is the middle 50% of the values.
2 2 2 3 3 3 3 4 4 4 5

Promoting a knowledge based NHS www.southeastlibrarysearch.nhs.uk Promoting a knowledge based NHS www.southeastlibrarysearch.nhs.uk
0
2
4
6
8
10
12
60 65 70 75 80 85 90 95 100
The standard deviation measures how widely the set of values is spread around the mean
Mean (SD)
80 kg (10 kg)
Standard deviation

Promoting a knowledge based NHS www.southeastlibrarysearch.nhs.uk Promoting a knowledge based NHS www.southeastlibrarysearch.nhs.uk
0
2
4
6
8
10
12
60 65 70 75 80 85 90 95 100
The standard deviation measures how widely the set of values is spread around the mean
Mean (SD)
80 kg (5 kg)
Standard deviation

Promoting a knowledge based NHS www.southeastlibrarysearch.nhs.uk Promoting a knowledge based NHS www.southeastlibrarysearch.nhs.uk
Standard deviation
0
2
4
6
8
10
12
60 65 70 75 80 85 90 95 100
68.2% of results are between +1 and -1
standard deviations from the mean
Mean (SD)
80 kg (5 kg)
68.2%
95.4 % of results are between
2 standard deviations from the
mean
99.7 % of results are between
3 standard deviations from the
mean

Promoting a knowledge based NHS www.southeastlibrarysearch.nhs.uk Promoting a knowledge based NHS www.southeastlibrarysearch.nhs.uk
Statistical Validity
“Validity – the extent to which a
test measures what it is supposed
to measure.” (Gosall 2009)

Promoting a knowledge based NHS www.southeastlibrarysearch.nhs.uk Promoting a knowledge based NHS www.southeastlibrarysearch.nhs.uk
Statistical Validity
The degree to which an observed result, such as a
difference between two measurements, can be relied upon
and not attributed to random error in sampling and
measurement
Sample Size – enough to detect true difference
Power – ability to detect a true difference
P – probability of results if null hypothesis is true
CI – the degree of uncertainty around an estimate

Promoting a knowledge based NHS www.southeastlibrarysearch.nhs.uk Promoting a knowledge based NHS www.southeastlibrarysearch.nhs.uk
To calculate the sample size, you need to know:
The minimum clinically important difference
The frequency (prevalence) and spread of data we might expect - usually from previous studies
Type of study design (superiority, non-inferiority, equivalence)
Type of primary outcome (dichotomous/continuous)
General aim is to achieve valid outcome with smallest possible sample, for cost and practicality
Sample Size

Promoting a knowledge based NHS www.southeastlibrarysearch.nhs.uk Promoting a knowledge based NHS www.southeastlibrarysearch.nhs.uk
The evidence: a statement on sample size calculation
and the expected sample – and the proof in the results
that this was achieved:
CLOTS Trial: Lancet. 2009 June 6; 373(9679): 1958–1965.
Sample Size – the evidence

Promoting a knowledge based NHS www.southeastlibrarysearch.nhs.uk Promoting a knowledge based NHS www.southeastlibrarysearch.nhs.uk
The p value gives a measure of how likely it is that any differences between control and experimental groups are due to chance alone. P values range from 0 (impossible to happen by chance) to 1 (the event will certainly happen).
p=0.001 unlikely result happened by chance: 1 in 1000 Strong evidence
p=0.05 fairly unlikely result happened by chance: 1 in 20 Weak evidence, within a whisker of non-significance
p=0.5 equally likely the result happened by chance: 1 in 2 Still some indication of benefit?
p=0.75 very likely the result happened by chance: 3 in 4 No useful result?
Results where p is less than 0.05 are said to be “significant.” This is just an arbitrary figure, in 1 in 20 cases, the results could be due to chance.
P (Probability) Value

Promoting a knowledge based NHS www.southeastlibrarysearch.nhs.uk Promoting a knowledge based NHS www.southeastlibrarysearch.nhs.uk
P Values – just a first step From: http://theconversation.com/the-problem-with-p-values-how-significant-are-they-really-20029

Promoting a knowledge based NHS www.southeastlibrarysearch.nhs.uk Promoting a knowledge based NHS www.southeastlibrarysearch.nhs.uk
Type 1 error = concluding a relationship exists between two
variables, when in fact there is no relationship, leading us to
reject the null hypothesis when it is actually true
A study has avoided Type 1 error if P<0.05
Type I or ά Error
Type II or β Error Type 2 error = concluding a relationship doesn’t exist
between two variables, when in fact there is a relationship,
i.e. a high (poor) P value when the null hypothesis was
correct
A study has avoided Type II error if Power>80%

Promoting a knowledge based NHS www.southeastlibrarysearch.nhs.uk Promoting a knowledge based NHS www.southeastlibrarysearch.nhs.uk
Used in the same way as p values in assessing the effects of chance but gives more information.
Any result obtained in a sample of patients only gives an estimate of the result which would be obtained in the whole population.
The real value will not be known, but the confidence interval shows the size of the likely variation from the true figure.
A 95% CI means a 95% chance that the ‘true’ result lies within the range specified. (Equivalent to a p value of 0.05).
The larger the trial the narrower the confidence interval, and therefore the more likely the result is to be definitive.
If the CI includes the point of zero effect (i.e. 0 for a difference, 1 for a ratio) it can mean either that there is no significant difference between the treatments and/or that the sample size was too small to allow us to be confident where the true result lies.
95% CI (Confidence Interval)
Promoting a knowledge based NHS www.southeastlibrarysearch.nhs.uk Promoting a knowledge based NHS www.southeastlibrarysearch.nhs.uk
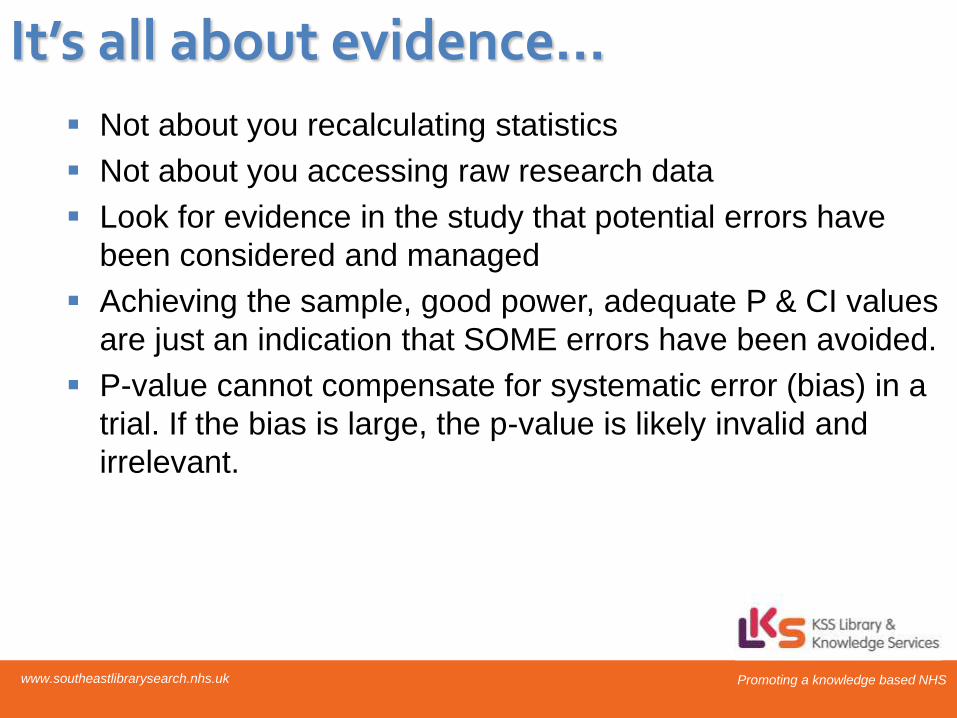
Not about you recalculating statistics
Not about you accessing raw research data
Look for evidence in the study that potential errors have
been considered and managed
Achieving the sample, good power, adequate P & CI values
are just an indication that SOME errors have been avoided.
P-value cannot compensate for systematic error (bias) in a
trial. If the bias is large, the p-value is likely invalid and
irrelevant.
It’s all about evidence...
Promoting a knowledge based NHS www.southeastlibrarysearch.nhs.uk Promoting a knowledge based NHS www.southeastlibrarysearch.nhs.uk
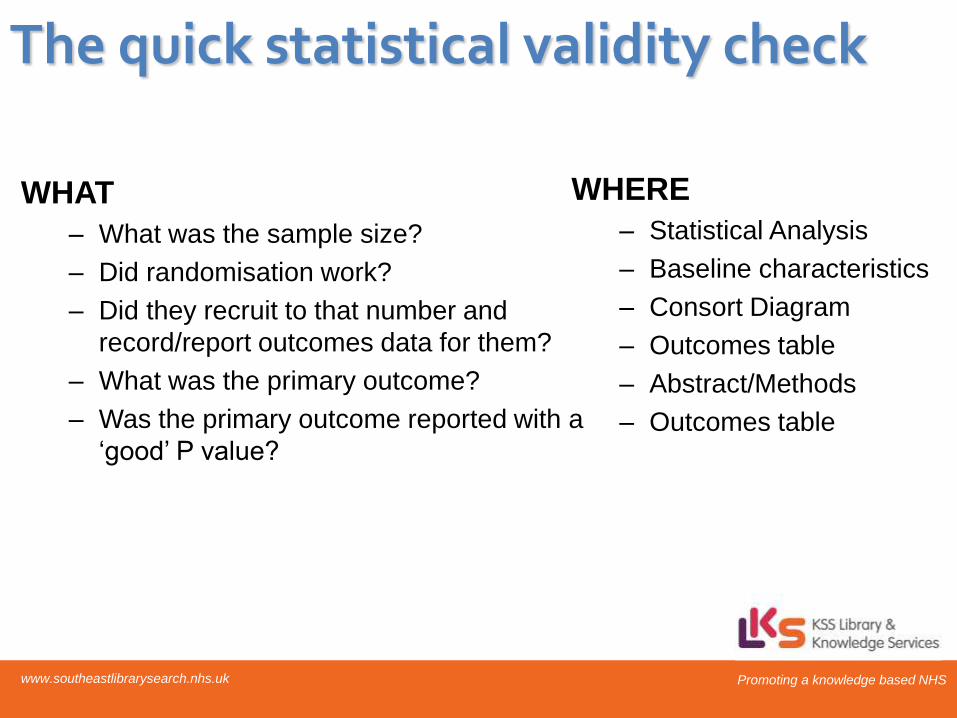
The quick statistical validity check
WHAT
– What was the sample size?
– Did randomisation work?
– Did they recruit to that number and
record/report outcomes data for them?
– What was the primary outcome?
– Was the primary outcome reported with a
‘good’ P value?
WHERE
– Statistical Analysis
– Baseline characteristics
– Consort Diagram
– Outcomes table
– Abstract/Methods
– Outcomes table

Promoting a knowledge based NHS www.southeastlibrarysearch.nhs.uk Promoting a knowledge based NHS www.southeastlibrarysearch.nhs.uk

Promoting a knowledge based NHS www.southeastlibrarysearch.nhs.uk Promoting a knowledge based NHS www.southeastlibrarysearch.nhs.uk
Statistics for probability (measures of effect)

Promoting a knowledge based NHS www.southeastlibrarysearch.nhs.uk Promoting a knowledge based NHS www.southeastlibrarysearch.nhs.uk
Definitions
• Risk: the number of participants having the event in a group divided by the total number of participants
• Odds: the number of participants having the event divided by the number of participants not having the event
• Risk ratio (relative risk): the risk of the event in the intervention group divided by the risk of the event in the control group
• Odds ratio: the odds of the event in the intervention group divided by the odds of the event in the control group
• Risk difference: the absolute change in risk that is attributable to the experimental intervention
• Number needed to treat (NNT): the number of people you would have to treat with the experimental intervention (compared with the control) to prevent one event (in a specific time period).
(EER = Experimental Event Rate, CER = Control Event Rate)

Promoting a knowledge based NHS www.southeastlibrarysearch.nhs.uk Promoting a knowledge based NHS www.southeastlibrarysearch.nhs.uk
Counting the number of events
When measuring
an event rate we
count how many
people experience
the event…
… and divide that
number by the total
number of people in
the group
Ratio
Proportion
(Event) Rate
Percentage
Prevalence

Promoting a knowledge based NHS www.southeastlibrarysearch.nhs.uk Promoting a knowledge based NHS www.southeastlibrarysearch.nhs.uk
So...
If we wanted to compare two groups for the
number of people who fell over in a group,
we would simply count the number of
people who fell over in Group A and count
the number of people who fell over in
Group B. The number of people falling
over could be expressed as a simple
count, but to make comparison easier it is
usually expressed as a %.

Promoting a knowledge based NHS www.southeastlibrarysearch.nhs.uk Promoting a knowledge based NHS www.southeastlibrarysearch.nhs.uk
The 2x2 Matrix: Risk & Relative Risk
In treatment group
Risk = a ÷ (a+b)
In control group
Risk = c ÷ (c+d)
RR = (a ÷ (a+b)) ÷ (c ÷ (c+d))
Relative Risk compares
the event rates between
two groups

Promoting a knowledge based NHS www.southeastlibrarysearch.nhs.uk Promoting a knowledge based NHS www.southeastlibrarysearch.nhs.uk
Absolute or relative difference
Difference can be Absolute or Relative
Absolute Difference: X – Y where X and Y are averages or proportions
or
Relative Difference: X ÷ Y where X and Y are proportions
Promoting a knowledge based NHS www.southeastlibrarysearch.nhs.uk Promoting a knowledge based NHS www.southeastlibrarysearch.nhs.uk
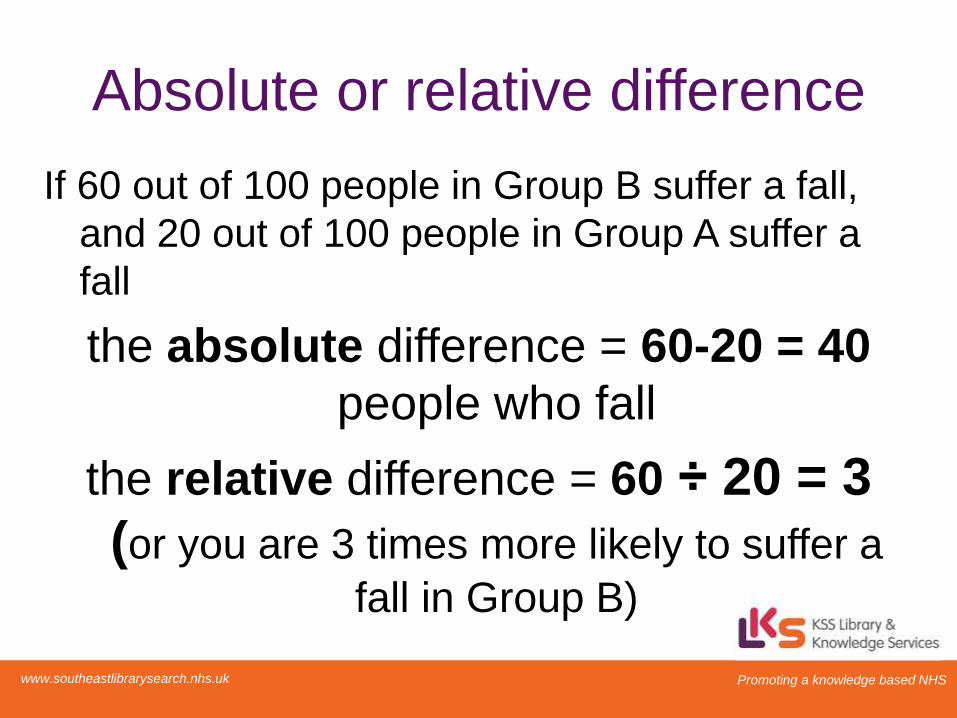
Absolute or relative difference
If 60 out of 100 people in Group B suffer a fall,
and 20 out of 100 people in Group A suffer a
fall
the absolute difference = 60-20 = 40
people who fall
the relative difference = 60 ÷ 20 = 3
(or you are 3 times more likely to suffer a
fall in Group B)

Promoting a knowledge based NHS www.southeastlibrarysearch.nhs.uk Promoting a knowledge based NHS www.southeastlibrarysearch.nhs.uk
Event rates (proportions)
2x2 table Disease/
outcome
Disease/
outcome
Total
Yes No
Risk factor
/ Exposure
a b a + b
No risk factor
/ Control
c d c + d
• Exposure Event Rate = a ÷ (a + b)
• Control Event Rate = c ÷ (c + d)

Promoting a knowledge based NHS www.southeastlibrarysearch.nhs.uk Promoting a knowledge based NHS www.southeastlibrarysearch.nhs.uk
Event rates (proportions)
2x2 table Falls Falls Total
Yes No
Vitamin D
(Group A)
20 80 100
No Vitamin D
(Group B)
60 40 100
• Exposure Event Rate = 20 ÷ (20 + 80) = 20%
• Control Event Rate = 60 ÷ (60 + 40) = 60%

Promoting a knowledge based NHS www.southeastlibrarysearch.nhs.uk Promoting a knowledge based NHS www.southeastlibrarysearch.nhs.uk
Relative risk
Pfeifer M, Begerow B, Minne HW, et al. Effects of a short-term vitamin D and calcium supplementation on body sway and secondary hyperparathyroidism in elderly women. Bone Miner Res 2000;15:1113-8.
% of people who fell
Risk ratio Vitamin D
and calcium
Calcium
alone
16% 28% 0.57

Promoting a knowledge based NHS www.southeastlibrarysearch.nhs.uk Promoting a knowledge based NHS www.southeastlibrarysearch.nhs.uk
Relative risk
Vitamin D
and calcium Calcium
alone
% of people who fell 16% 28%
Relative Risk (RR)
= Exposure Event Rate ÷ Control Event Rate
= 16% ÷ 28%
= 0.57 or 57%

Promoting a knowledge based NHS www.southeastlibrarysearch.nhs.uk Promoting a knowledge based NHS www.southeastlibrarysearch.nhs.uk
Relative risk reduction
Relative Risk Reduction (RRR)
= 1 – Relative Risk
= 1 – 0.57
= 0.43 or 43%
Vitamin D
and calcium Calcium
alone
% of people who fell 16% 28%

Promoting a knowledge based NHS www.southeastlibrarysearch.nhs.uk Promoting a knowledge based NHS www.southeastlibrarysearch.nhs.uk
Odds ratios
Odds are worked out differently to risks.
No. of people who experience outcome
÷
No. of people who don’t experience outcome
An odds ratio compares the odds of Group A experiencing an event compared to the odds of Group B experiencing an event.

Promoting a knowledge based NHS www.southeastlibrarysearch.nhs.uk Promoting a knowledge based NHS www.southeastlibrarysearch.nhs.uk
The 2x2 Matrix: Odds & Odds Ratio

Promoting a knowledge based NHS www.southeastlibrarysearch.nhs.uk Promoting a knowledge based NHS www.southeastlibrarysearch.nhs.uk
Odds ratios
So, using the same falls example:
If 11 out of 70 people fell in Group A, the odds of falling in that group are 11 ÷ 59 = 0.19
If 19 out of 67 people fell in Group B, the odds of falling in that group are 19 ÷ 48 = 0.40
Odds ratio = 0.19 ÷ 0.40 = 0.48

Promoting a knowledge based NHS www.southeastlibrarysearch.nhs.uk Promoting a knowledge based NHS www.southeastlibrarysearch.nhs.uk
Odds ratio
OR is particularly useful because as an effect-size
statistic, it gives clear and direct information to
clinicians about which treatment approach has the
best odds of benefiting the patient.
Also used in cross-sectional studies and case-
control studies, where exposure or not exposure
replaces treatment and control, and outcome is
presence or absence of disease.

Promoting a knowledge based NHS www.southeastlibrarysearch.nhs.uk Promoting a knowledge based NHS www.southeastlibrarysearch.nhs.uk
Odds versus risk
• If 50 in every 100 children are boys then:
– Risk of having a boy = 50/100 = 0.5
– Odds of having a boy = 50/50 = 1
• If 1 in 100 patients suffers a side-effect then:
– Risk of having a side-effect = 1/100 = 0.01
– Odds of having a side-effect = 1/99 = 0.01

Promoting a knowledge based NHS www.southeastlibrarysearch.nhs.uk Promoting a knowledge based NHS www.southeastlibrarysearch.nhs.uk
Odds versus risk
Risk can be stated as “6 people die out of every 10
who are exposed”
Risks are a consequence of a risk leading to an
outcome, whereas odds compare two groups,
and can be reversed
Odds can be stated as “for every 4 people who
recover, 6 people do not” (or for 6 who don’t, 4
do).

Promoting a knowledge based NHS www.southeastlibrarysearch.nhs.uk Promoting a knowledge based NHS www.southeastlibrarysearch.nhs.uk
Success/Failure
Measure No Effect Total Success
Absolute Risk Reduction Zero Initial Risk
Risk Ratio/Relative Risk 1 (or 100%) 0
Odds Ratio* 1 0 (or ∞)
Number Needed to Treat ∞ 1

Promoting a knowledge based NHS www.southeastlibrarysearch.nhs.uk Promoting a knowledge based NHS www.southeastlibrarysearch.nhs.uk
SAFE Study
http://www.nejm.org/doi/pdf/10.1056/NEJMoa040232
NEJM Correspondence
http://www.nejm.org/doi/full/10.1056/NEJM200410283511818
Journal Club Commentaries
http://www.biomedcentral.com/content/pdf/cc3006.pdf
http://www.biomedcentral.com/content/pdf/cc8940.pdf
SAFE Study - albumin/saline a
c d
b
Outcome
YES NO
Treatment
Control

Promoting a knowledge based NHS www.southeastlibrarysearch.nhs.uk Promoting a knowledge based NHS www.southeastlibrarysearch.nhs.uk
ODDS & RISK EXERCISES RISK
• 133 women take an antibiotic for treatment of UTI
• 14 still have UTI after 6 weeks
• Q1: What is the risk of remaining infected?
ODDS
• Q2: For these 133 women, what is the risk of having the event (still infected) divided by the risk of not having it (cured)?
COMPARING ODDS & RISK
• Q3: Both are similar, due to small result. But if you include the 148 women in this trial receiving placebo, of whom 128 still had UTI after 6 weeks. In this group what is the risk of staying infected?
• Q4: What are the odds?
• Odds and Risk are never identical, although similar at low values. But depending on presentation can seem much more powerful (especially in a newspaper headline)

Promoting a knowledge based NHS www.southeastlibrarysearch.nhs.uk Promoting a knowledge based NHS www.southeastlibrarysearch.nhs.uk
The Answers •[1] 14/133 = approx 0.1
•[2] 14/119 = still approx 0.1; more formally, it is 14/133 (risk of having the event) divided by 119/133 (risk of not having the event), still 14/119 or 0.1
•[3] 128 (number with event – still infected)/148 (total number in the group)
•= 0.86
•[4] 128 (still infected)/20 (number cured) = 6.4 – very different).

Promoting a knowledge based NHS www.southeastlibrarysearch.nhs.uk Promoting a knowledge based NHS www.southeastlibrarysearch.nhs.uk
Relative risk or risk ratio (RR) Risk of event in one group divided by risk of the event in other group.
RR = no. with event in treatment group / no. with event in control group
no. in treatment group no. in control group
= (14/133) / (128/148)
= 0.1 / 0.86
= 0.12
RR =1 Intervention has identical effect to control
RR <1 Intervention reduces chances of having the event
RR >1 Intervention increases the chances of having the event
RR = 0 No events in treated group = 100% perfect treatment!
Comparing two groups
Event No Event Total
Intervention 14 119 133
Control 128 20 148

Promoting a knowledge based NHS www.southeastlibrarysearch.nhs.uk Promoting a knowledge based NHS www.southeastlibrarysearch.nhs.uk
Odds ratio (OR) Odds in the treated group / odds in the control group
OR = no. with event in treatment group / no. with event in control group
no. without event in treatment group no. without event in control group
= (14/119) / (128/20)
= 0.118 / 6.40
= 0.018
OR =1 Intervention has identical effect to control
OR <1 Intervention reduces chances of having the event
OR >1 Intervention increases the chances of having the event
OR = 0 No events in treated group = 100% perfect treatment!
Comparing two groups
Event No Event Total
Intervention 14 119 133
Control 128 20 148

Promoting a knowledge based NHS www.southeastlibrarysearch.nhs.uk Promoting a knowledge based NHS www.southeastlibrarysearch.nhs.uk
Absolute risk reduction and
Number needed to treat
Absolute Risk Reduction (ARR) or Risk Difference
= Control Event Rate (CER) – Experimental Event Rate (EER)
= 28% – 16% = 12%
Or
= Relative Risk Reduction (RRR) x Control Event Rate (CER)
= 1 – (0.16 / 0.28) = 0.43
= 0.43 x 0.28
= 0.12 (1%)
Vitamin D
and calcium Calcium
alone
% of people who fell 16% 28%
Promoting a knowledge based NHS www.southeastlibrarysearch.nhs.uk Promoting a knowledge based NHS www.southeastlibrarysearch.nhs.uk
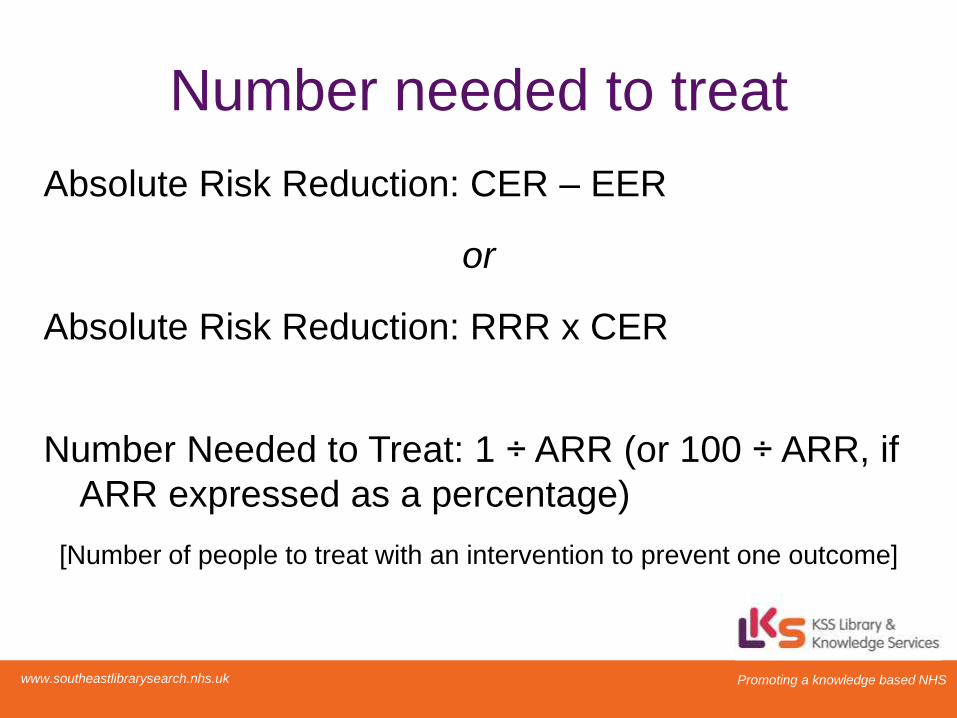
Number needed to treat
Absolute Risk Reduction: CER – EER
or
Absolute Risk Reduction: RRR x CER
Number Needed to Treat: 1 ÷ ARR (or 100 ÷ ARR, if
ARR expressed as a percentage)
[Number of people to treat with an intervention to prevent one outcome]

Promoting a knowledge based NHS www.southeastlibrarysearch.nhs.uk Promoting a knowledge based NHS www.southeastlibrarysearch.nhs.uk
Number Needed To Treat
• A measure of the relative efficacy / risk of a
treatment
• How many patients need to be exposed to a risk
factor (i.e. a treatment) over a specific period for
one extra patient to be show benefit/harm who
would not otherwise have shown benefit/harm.
• 1÷Absolute Risk Reduction or 1÷Risk Difference
• Consider also NNH (harm), NNV (vaccinate)

Promoting a knowledge based NHS www.southeastlibrarysearch.nhs.uk Promoting a knowledge based NHS www.southeastlibrarysearch.nhs.uk
Examples
• When dose-adjusted warfarin was compared to
aspirin, the absolute risk reduction of stroke was
0.6% in warfarinized patients (NNT 167)
• Tamoxifen vs Placebo for BrCa: – NNT 112 (5 yrs treatment);
– NNH (Venous Thromboembolic Events) = 137,
– NNH (Mortality) = 256 (so need to identify/control for high
risk of BrCa against high risk of adverse events)
• Cochrane (2010): Vaccines for Influenza in healthy
adults – NNV = 33 (matched vaccines) to 100
(unmatched)

Promoting a knowledge based NHS www.southeastlibrarysearch.nhs.uk Promoting a knowledge based NHS www.southeastlibrarysearch.nhs.uk
• 4 out of 55 or 7.3% died on Streptomycin = EER
• 14 out of 52 or 26.9% died on placebo = CER
ARR = CER–EER = 26.9% – 7. 3% = 19.6% (or 0.196) NNT = 1/0.196 = 6
6 patients with TB would need to be treated with streptomycin to prevent 1 additional person dying
• RR of dying on streptomycin compared to placebo was 0.27
• Tx with streptomycin showed 73% reduction in the risk of death compared with placebo.
• Antibiotic treatment prevented approximately three quarters of the deaths that would have occurred on placebo.
4 51
14 38
BMJ 30.12.1948 769-80

Promoting a knowledge based NHS www.southeastlibrarysearch.nhs.uk Promoting a knowledge based NHS www.southeastlibrarysearch.nhs.uk
Reading Statistical Diagrams
Forest Plots, Survival Curves, Life
Expectancy Curves and ROC Curves

Promoting a knowledge based NHS www.southeastlibrarysearch.nhs.uk Promoting a knowledge based NHS www.southeastlibrarysearch.nhs.uk
Reading Statistical Diagrams
You’re appraising, not recalculating
First test significance, then what or how much
Read the words & numbers, not just the pictures!

Promoting a knowledge based NHS www.southeastlibrarysearch.nhs.uk Promoting a knowledge based NHS www.southeastlibrarysearch.nhs.uk
Line width shows
the CI, box size
reflects the size of
the group
3 sub-group
analyses, each pair
adds up to ‘All’
figures
Summary diamond
shows overall total
Line of zero
effect or unity
Effectiveness of thigh-length graduated compression stockings to reduce the risk of deep vein thrombosis after stroke (CLOTS trial 1): a multicentre, randomised controlled trial
CLOTS Trial: Lancet. 2009 June 6; 373(9679): 1958–1965.
Not all Forest Plots are meta-analyses

Promoting a knowledge based NHS www.southeastlibrarysearch.nhs.uk Promoting a knowledge based NHS www.southeastlibrarysearch.nhs.uk
Use of weaning protocols for reducing duration of mechanical ventilation in critically ill adult patients:Cochrane systematic review and meta-analysis BMJ 2011;342:c7237
Odds Ratio Diagram – Forest Plot

Promoting a knowledge based NHS www.southeastlibrarysearch.nhs.uk Promoting a knowledge based NHS www.southeastlibrarysearch.nhs.uk
Not all Forest Plots are Odds Ratios
BMJ 2011;342:c7237

Promoting a knowledge based NHS www.southeastlibrarysearch.nhs.uk Promoting a knowledge based NHS www.southeastlibrarysearch.nhs.uk
Heterogeneity Occurs where the results of different studies vary from each other more
than might be expected by chance. Visually, on a Forest Plot, where the CI
lines do NOT overlap. Significant heterogeneity would rule out meta-
analysis, alternatives would include sub-group or sensitivity analysis.
Χ2 = variation in results above that
expected by chance – relates to DF
(“n of studies -1” = ‘perfect’), much
higher suggests heterogeneity’
Low P value for Χ2 may indicate
heterogeneity
High I2 indicates heterogeneity
If Z Statistic > 2.2, then
heterogeneity is present; Z should
have an associated P value

Promoting a knowledge based NHS www.southeastlibrarysearch.nhs.uk Promoting a knowledge based NHS www.southeastlibrarysearch.nhs.uk
The survival curve is a graphical display of the Kaplan-Meier
estimate that an event will occur
Does not presume normal distribution
Log Rank test compares rates in 2 groups
Measures time to an event following treatment (‘survival’),
but may be non-mortality – revision of arthroscopy, time in
remission before relapse, or positive (pregnancy, discharge)
If sample large enough, the estimate approaches the true
survival function for the population
Allows inclusion of patients starting & leaving studies at
different time intervals
Survival Curves

Promoting a knowledge based NHS www.southeastlibrarysearch.nhs.uk Promoting a knowledge based NHS www.southeastlibrarysearch.nhs.uk
Dropouts/mortality NOT due to target cause, but lost to
follow-up, withdrawal from study
Marked on curve but doesn’t affect analysis
Assumes loss to follow-up is independent of their prognosis
For each event survival curve drops - denominator changes,
but plot stays the same, marked by ticks
Censored Data
Gijbels Irène. Censored data.
WIREs Comp Stat 2010, 2: 178-188

Promoting a knowledge based NHS www.southeastlibrarysearch.nhs.uk Promoting a knowledge based NHS www.southeastlibrarysearch.nhs.uk
A gap in the horizontal direction =
“the median (50%) survival time is
much larger (about 200 days larger)
in the patients without cachexia”.
A gap in the vertical direction =
“at 500 days, the probability of survival
is about 45% in the patients without
cachexia and only 25% in the patients
with cachexia”.
Comparing/Describing Survival

Promoting a knowledge based NHS www.southeastlibrarysearch.nhs.uk Promoting a knowledge based NHS www.southeastlibrarysearch.nhs.uk
Vertical axis = estimated probability of survival for a hypothetical cohort, not actual % surviving.
Precision depends on the number of observations: estimates at left-hand side are more precise than right-hand side (because of smaller numbers due to deaths and dropouts).
Curves may give the impression that a given event occurs more frequently early than late, because of high survival rate and large number people at beginning.
Rule of thumb is to truncate the x axis at the point where you only have 10 survivors, or 10% of the original cohort, whichever is higher, as reliability of curve diminishes as population survival reduces
Survival Curves
Cumulative morbidity plots are often better than survival plots when overall survival is high

Promoting a knowledge based NHS www.southeastlibrarysearch.nhs.uk Promoting a knowledge based NHS www.southeastlibrarysearch.nhs.uk
Hazard is a measure of how rapidly the event occurs. The hazard ratio compares the hazards in two groups.
If a hazard ratio is, say, 4.17, the estimated relative risk of the event in group 2 is 4.17 higher than in group 1.
The hazard ratio is significant if the confidence interval does not include the value 1.
Note: calculating the hazard ratio assumes the ratio is consistent over time - if the survival curves cross, the hazard ratio should be ignored.
Hazard Ratios
Promoting a knowledge based NHS www.southeastlibrarysearch.nhs.uk Promoting a knowledge based NHS www.southeastlibrarysearch.nhs.uk
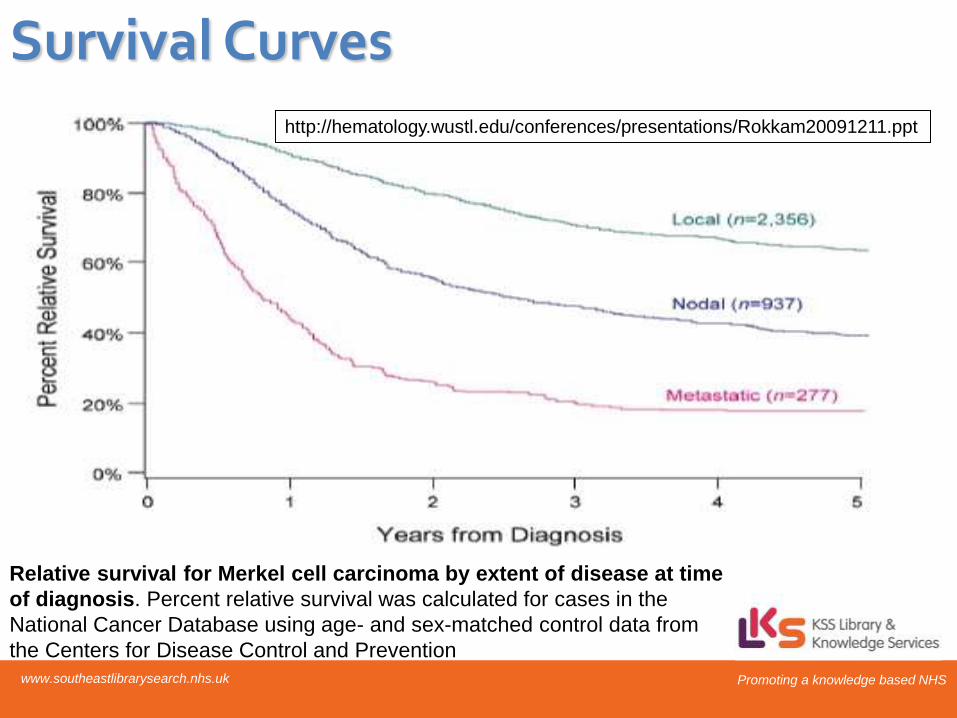
Relative survival for Merkel cell carcinoma by extent of disease at time
of diagnosis. Percent relative survival was calculated for cases in the
National Cancer Database using age- and sex-matched control data from
the Centers for Disease Control and Prevention
http://hematology.wustl.edu/conferences/presentations/Rokkam20091211.ppt
Survival Curves

Promoting a knowledge based NHS www.southeastlibrarysearch.nhs.uk Promoting a knowledge based NHS www.southeastlibrarysearch.nhs.uk
Studenski S, Perera S, Patel K, Rosano C, Faulkner K, Inzitari M, et al. Gait speed and survival in older adults. JAMA 2011;305:50-8.
Life Expectancy Curve

Promoting a knowledge based NHS www.southeastlibrarysearch.nhs.uk Promoting a knowledge based NHS www.southeastlibrarysearch.nhs.uk

Promoting a knowledge based NHS www.southeastlibrarysearch.nhs.uk Promoting a knowledge based NHS www.southeastlibrarysearch.nhs.uk
Diagnostic Test Study Statistics
How good is the screening/diagnostic
test at predicting/confirming the
outcome of the Gold Standard test?
Promoting a knowledge based NHS www.southeastlibrarysearch.nhs.uk Promoting a knowledge based NHS www.southeastlibrarysearch.nhs.uk
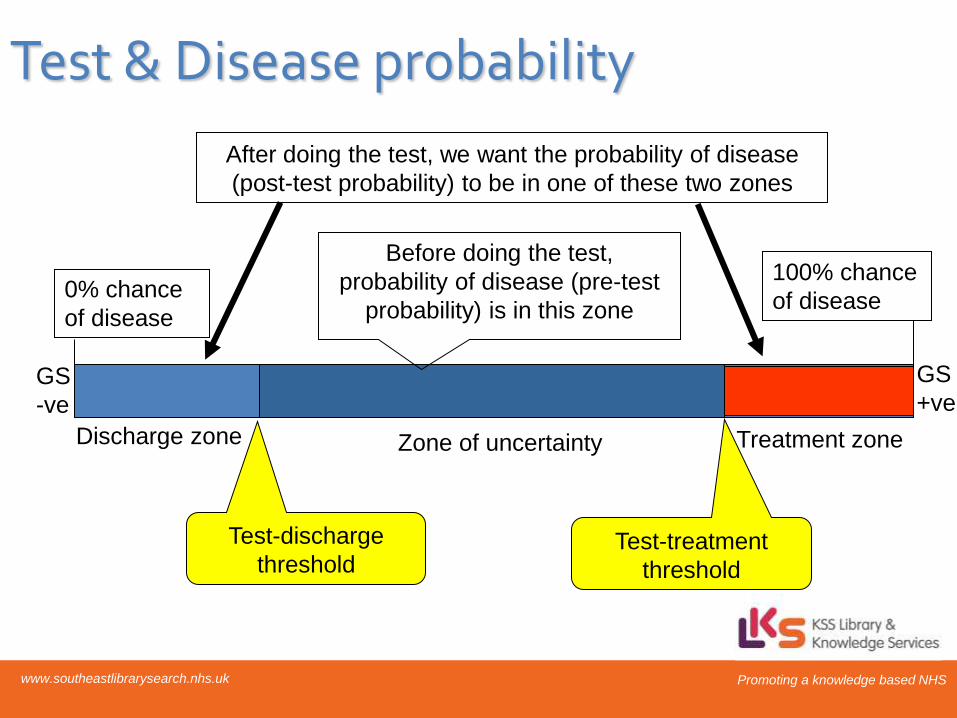
Test & Disease probability
Zone of uncertainty Treatment zone Discharge zone
0% chance
of disease
100% chance
of disease
Before doing the test,
probability of disease (pre-test
probability) is in this zone
After doing the test, we want the probability of disease
(post-test probability) to be in one of these two zones
GS
-ve
GS
+ve
Test-discharge
threshold Test-treatment
threshold

Promoting a knowledge based NHS www.southeastlibrarysearch.nhs.uk Promoting a knowledge based NHS www.southeastlibrarysearch.nhs.uk
Key Screening Questions
• Is the test useful?
– Was it researched in a population relevant to the individual or population in whish it will be used?
• Is the test reliable?
– Can it be repeated and the effects reproduced using the same of different observers?
• Is the test valid?
– Does it measure what it sets out to measure and is the result true, when compared with the gold standard?

Promoting a knowledge based NHS www.southeastlibrarysearch.nhs.uk Promoting a knowledge based NHS www.southeastlibrarysearch.nhs.uk
Biases to avoid – or identify
• Spectrum bias
– Tested on ‘healthy’ as well as ‘ill’ subjects
• Verification/Ascertainment bias
– ALL patients get BOTH tests
• Review bias
– Proper blinding to avoid influencing test results
• Lead time bias
– Earlier test without change in outcome

Promoting a knowledge based NHS www.southeastlibrarysearch.nhs.uk Promoting a knowledge based NHS www.southeastlibrarysearch.nhs.uk
Lead time bias
http://en.wikipedia.org/wiki/Lead_time_bias
Where an earlier test implies longer survival, but actually there is no difference in
clinical outcome, so what seems like an effective early test (breast screening, genetic
test for Huntingtons) causes no real benefit, and may cause harm (anxiety etc).

Promoting a knowledge based NHS www.southeastlibrarysearch.nhs.uk Promoting a knowledge based NHS www.southeastlibrarysearch.nhs.uk
Sensitivity
Disease No
Disease
Test Result
Positive
Negative
TP FP
FN TN
Gold Standard
Sensitivity
TP/TP+FN
Sensitivity: The capacity of the test to correctly identify diseased
individuals in a population; “TRUE POSITIVES”.

Promoting a knowledge based NHS www.southeastlibrarysearch.nhs.uk Promoting a knowledge based NHS www.southeastlibrarysearch.nhs.uk
Specificity
Disease No
Disease
Positive
Negative
TP FP
FN TN Test Result
Gold Standard
Specificity
TN/FP+TN
Specificity: The capacity of the test to correctly exclude individuals
who are free of the disease; “TRUE NEGATIVES”.

Promoting a knowledge based NHS www.southeastlibrarysearch.nhs.uk Promoting a knowledge based NHS www.southeastlibrarysearch.nhs.uk
Example
Disease No
Disease
Positive
Negative
75
25
20
180
100 200 300
95
205
Sensitivity = 75/100 = 75% Specificity = 180/200 = 90%
Test Result
Gold Standard

Promoting a knowledge based NHS www.southeastlibrarysearch.nhs.uk Promoting a knowledge based NHS www.southeastlibrarysearch.nhs.uk
Accuracy of the test
(a+d)/(a+b+c+d)
Disease No
Disease
Positive
Negative
a
c
b
d
Test Result
Gold Standard

Promoting a knowledge based NHS www.southeastlibrarysearch.nhs.uk Promoting a knowledge based NHS www.southeastlibrarysearch.nhs.uk
Likelihood ratios • Reflects the degree of confidence that a person
who scores in the positive range does have the
disorder, or in the negative range does not have
the disorder
• LR+ = sensitivity/1-specificity
• LR- = 1-sensitivity/specificity
• The higher the LR+ the more useful the indicator
for identifying people with the disorder
• The higher the LR-, the more useful the indicator
for identifying people without the disorder

Promoting a knowledge based NHS www.southeastlibrarysearch.nhs.uk Promoting a knowledge based NHS www.southeastlibrarysearch.nhs.uk
Worked example: Prevalence of 30%, Sensitivity of 50%, Specificity of 90%
30
70
15
7
100
22 people test positive……….
of whom 15 have the disease
So, chance of disease is 15/22 about 70%
Disease +ve
Disease -ve
Testing +ve
Sensitivity
= 50%
False
positive
rate = 10%

Promoting a knowledge based NHS www.southeastlibrarysearch.nhs.uk Promoting a knowledge based NHS www.southeastlibrarysearch.nhs.uk
Positive Predictive Value
Disease No
Disease
Positive
Negative
TP FP
FN TN Test Result
Gold Standard
PPV=TP/TP+FP
PPV: the probability of the disease being present, among those with positive
diagnostic test results

Promoting a knowledge based NHS www.southeastlibrarysearch.nhs.uk Promoting a knowledge based NHS www.southeastlibrarysearch.nhs.uk
Negative Predictive Value
Disease No
Disease
Positive
Negative
TP FP
FN TN Test Result
Gold Standard
NPV=TN/TN+FN
NPV: the probability of the disease being absent, among those with negative
diagnostic test results
Promoting a knowledge based NHS www.southeastlibrarysearch.nhs.uk Promoting a knowledge based NHS www.southeastlibrarysearch.nhs.uk
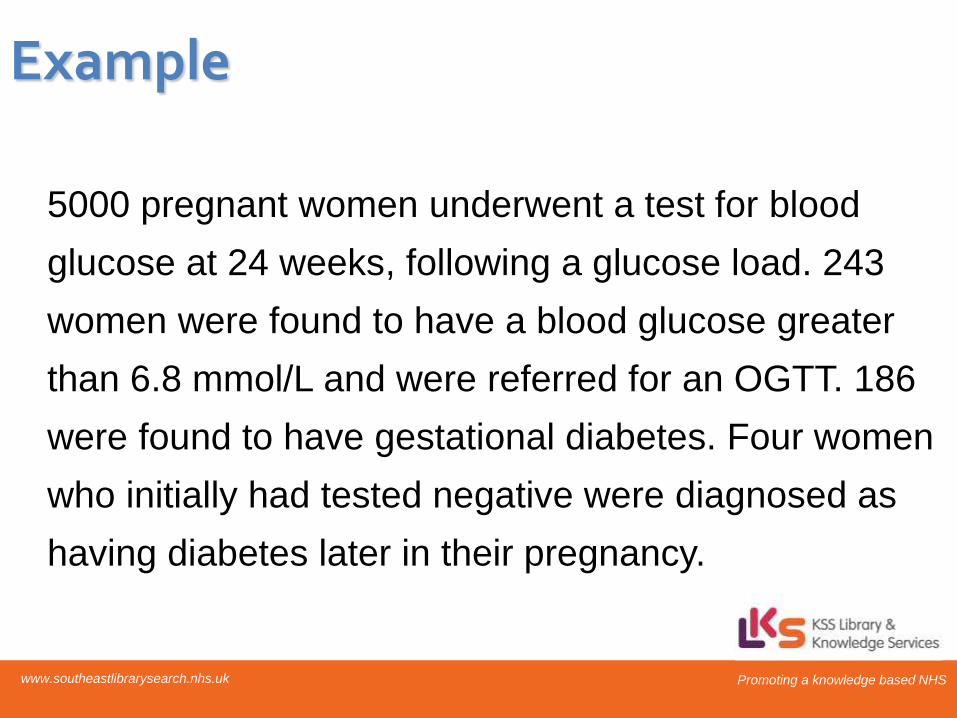
Example
5000 pregnant women underwent a test for blood
glucose at 24 weeks, following a glucose load. 243
women were found to have a blood glucose greater
than 6.8 mmol/L and were referred for an OGTT. 186
were found to have gestational diabetes. Four women
who initially had tested negative were diagnosed as
having diabetes later in their pregnancy.
Promoting a knowledge based NHS www.southeastlibrarysearch.nhs.uk Promoting a knowledge based NHS www.southeastlibrarysearch.nhs.uk
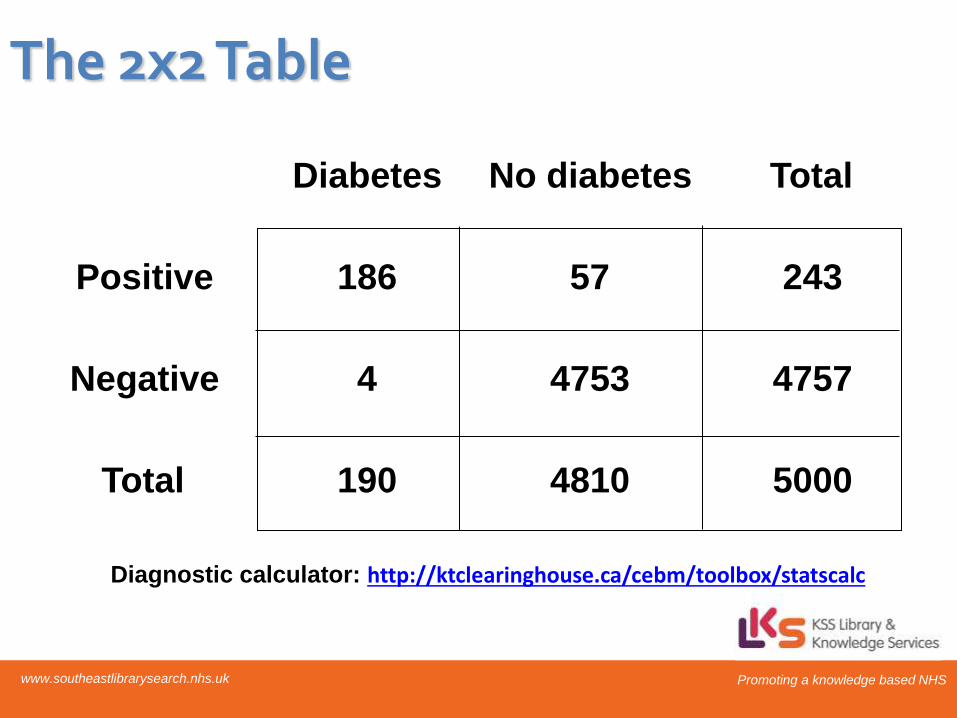
The 2x2 Table
Diabetes No diabetes Total
Positive 186 57 243
Negative 4 4753 4757
Total 190 4810 5000
Diagnostic calculator: http://ktclearinghouse.ca/cebm/toolbox/statscalc

Promoting a knowledge based NHS www.southeastlibrarysearch.nhs.uk Promoting a knowledge based NHS www.southeastlibrarysearch.nhs.uk
The Sums Prevalence
Sensitivity
Specificity
Positive predictive value
Negative predictive value
Likelihood ratio + test
Likelihood ratio - test
Accuracy
190/5000
186/190
4753/4810
186/243
4753/4757
(186/190)/(57/4810)
(4/190)/(4753/4810)
(186+4753)/5000
3.8%
97.9%
98.8%
76.5%
99.9%
82.6
.02
98.8%

Promoting a knowledge based NHS www.southeastlibrarysearch.nhs.uk Promoting a knowledge based NHS www.southeastlibrarysearch.nhs.uk
The Fagan Nomogram:
If you know 2 of the 3
elements, then you can
calculate the third, and see
the results of changes
i.e. for a known prevalence,
you can adjust the
likelihood ratio to see how it
affects the post-test
probability
Prev = 3.8% (0.038)
LR+ = 82.6
LR- = 0.02
Promoting a knowledge based NHS www.southeastlibrarysearch.nhs.uk Promoting a knowledge based NHS www.southeastlibrarysearch.nhs.uk
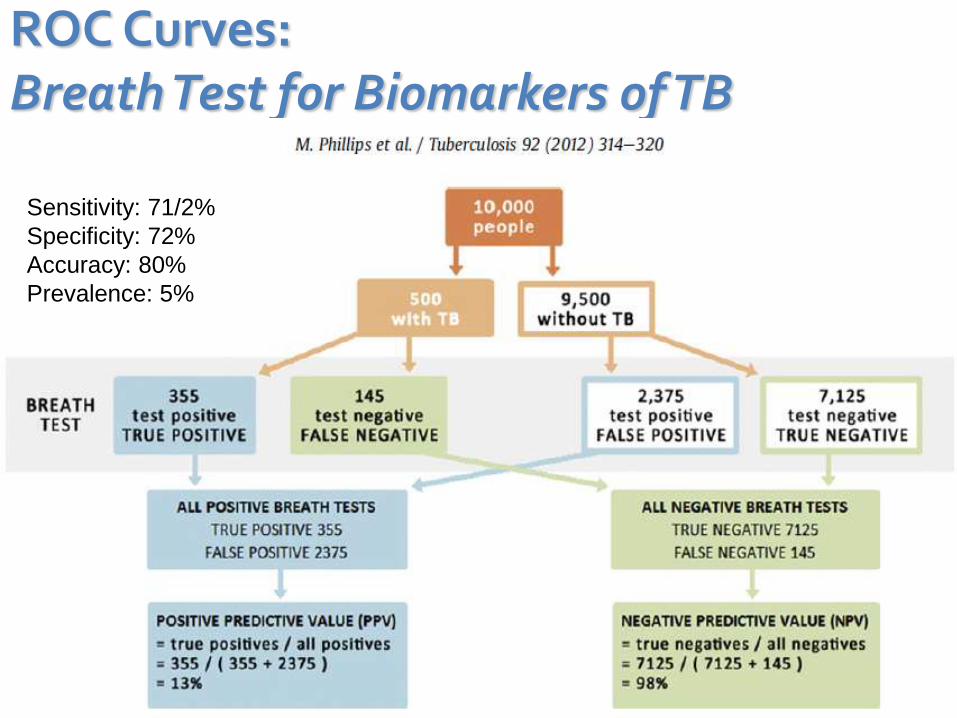
ROC Curves: Breath Test for Biomarkers of TB
Sensitivity: 71/2%
Specificity: 72%
Accuracy: 80%
Prevalence: 5%

Promoting a knowledge based NHS www.southeastlibrarysearch.nhs.uk Promoting a knowledge based NHS www.southeastlibrarysearch.nhs.uk
• Each point on the ROC curve represents a sensitivity/specificity pair corresponding to a particular decision threshold.
• The area under the ROC curve is a measure of how well a parameter can distinguish between two diagnostic groups (diseased/normal).
• Not just ‘diagnosis’ but also ‘prediction’
ROC Curves

Promoting a knowledge based NHS www.southeastlibrarysearch.nhs.uk Promoting a knowledge based NHS www.southeastlibrarysearch.nhs.uk
• Represents the trade off between the false negative
(sensitivity) and false positive (specificity) rates for every
possible combination.
• If the ROC curve rises rapidly towards the upper right-
hand corner of the graph, or if the value of area under
the curve is large, we can say the test performs well.
• Area = 1.0 = an ideal test, because it achieves both
100% sensitivity and 100% specificity (i.e. the curve hits
the top left corner, where both are 100%). Area = 0.5 =
‘bad test’, as it doesn’t show a clear benefit of the test.
ROC Curves

Promoting a knowledge based NHS www.southeastlibrarysearch.nhs.uk Promoting a knowledge based NHS www.southeastlibrarysearch.nhs.uk
• LR is the likelihood that a given test result would be expected in a patient with the target disorder compared to the likelihood that that same result would be expected in a patient without the target disorder.
• More useful than sensitivity/specificity: – less likely to change with prevalence of disorder
– can calculate for several levels of symptom/sign/test
– can be used to combine results of multiple tests
– can be used to calculate post-test probability
Likelihood Ratios

Promoting a knowledge based NHS www.southeastlibrarysearch.nhs.uk Promoting a knowledge based NHS www.southeastlibrarysearch.nhs.uk
• A good test should have a LR+ of at least 2.0 and a LR- of 0.5 or less. This would correspond to an AUC of roughly 0.75. A better test would have likelihood ratios of 5 and 0.2, respectively, and this corresponds to an AUC of around 0.92.
• 0.50 to 0.75 = fair
• 0.75 to 0.92 = good
• 0.92 to 0.97 = very good
• 0.97 to 1.00 = excellent
ROC Curves & Likelihood ratios
Promoting a knowledge based NHS www.southeastlibrarysearch.nhs.uk Promoting a knowledge based NHS www.southeastlibrarysearch.nhs.uk
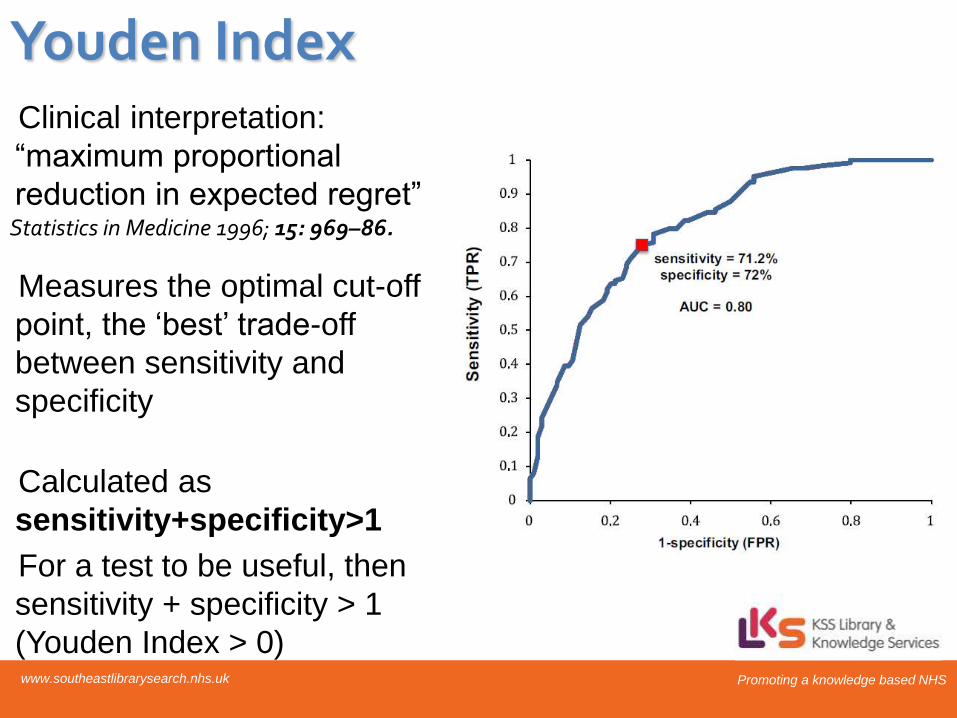
Clinical interpretation:
“maximum proportional
reduction in expected regret”
Measures the optimal cut-off
point, the ‘best’ trade-off
between sensitivity and
specificity
Calculated as
sensitivity+specificity>1
For a test to be useful, then
sensitivity + specificity > 1
(Youden Index > 0)
Statistics in Medicine 1996; 15: 969–86.
Youden Index

Promoting a knowledge based NHS www.southeastlibrarysearch.nhs.uk Promoting a knowledge based NHS www.southeastlibrarysearch.nhs.uk

Promoting a knowledge based NHS www.southeastlibrarysearch.nhs.uk Promoting a knowledge based NHS www.southeastlibrarysearch.nhs.uk
Key References, Help, Ideas… Feedback, comment, complaints and suggestions: [email protected]
KSS Searching and training Wiki
https://sites.google.com/site/healthliteraturesearchers/Home
KSS Resources for Appraisal & Statistics Workshops
https://sites.google.com/site/healthliteraturesearchers/staff-development-1/cpd-for-library-staff
EQUATOR NETWORK – toolkits for every study type (CONSORT, PRISMA, GRADE et al)
http://www.equator-network.org/toolkits/
Medical Calculators:
http://www.mdcalc.com/ ; http://ktclearinghouse.ca/cebm/toolbox ; www.medal.org
NIHS RDS Resource Packs – guides to Research, SPSS, Statistics etc
http://www.rds-eastmidlands.nihr.ac.uk/resources/cat_view/13-resource-packs.html
Statistics in medicine
Anaesthesia & Intensive Care Medicine, April 2012 13/4 181-88
Statistics for clinical trials and audit
Anaesthesia & Intensive Care Medicine, April 2012, 13/4 189–193