Embed Size (px)
Citation preview
Introduction to Matlab IIIntroduction to Matlab II
EE 2303 Lab
Basic Matlab Review
Data file input/output string, char, double, struct Types of
variables load, save directory/workspace data file
movement
Navigation/workspace commands clear – clears workspace of all variables close all – close all figure-windows Up-arrow – scroll through recently used command
Basic Matlab Review Fundamentals of matrix computing
[ ], Brackets are used to form vectors and matrices
{ }, Curly braces are used in cell array assignment
( ), ParenthesesEnclose arguments of functionsEnclose subscripts of vectors and matricesIndicate precedence in arithmetic
expressions
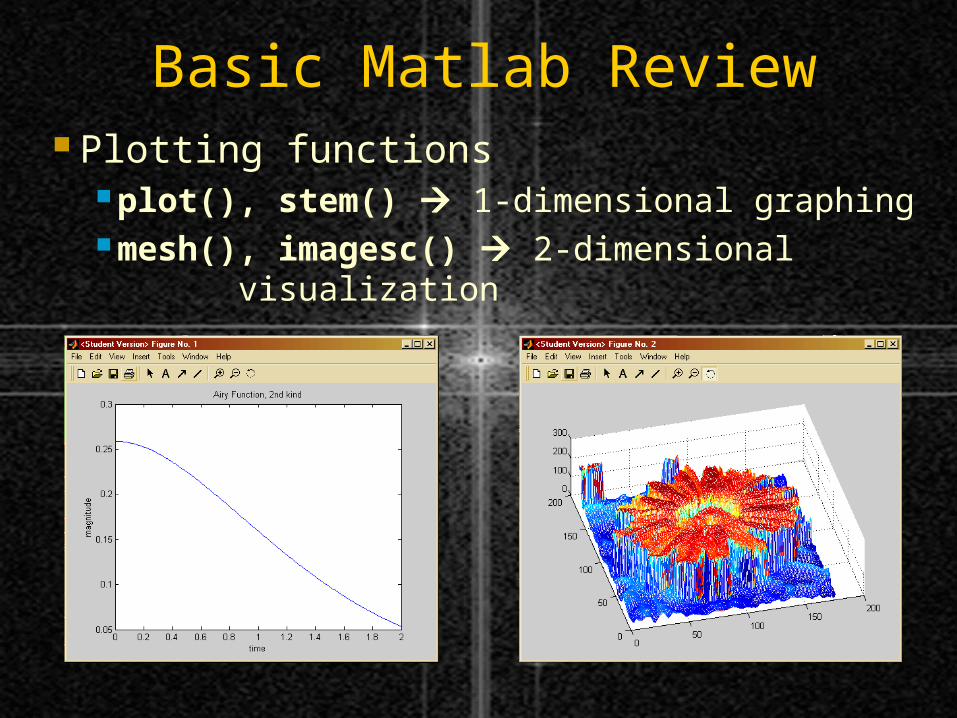
Basic Matlab Review Plotting functions
plot(), stem() 1-dimensional graphingmesh(), imagesc() 2-dimensional
visualization
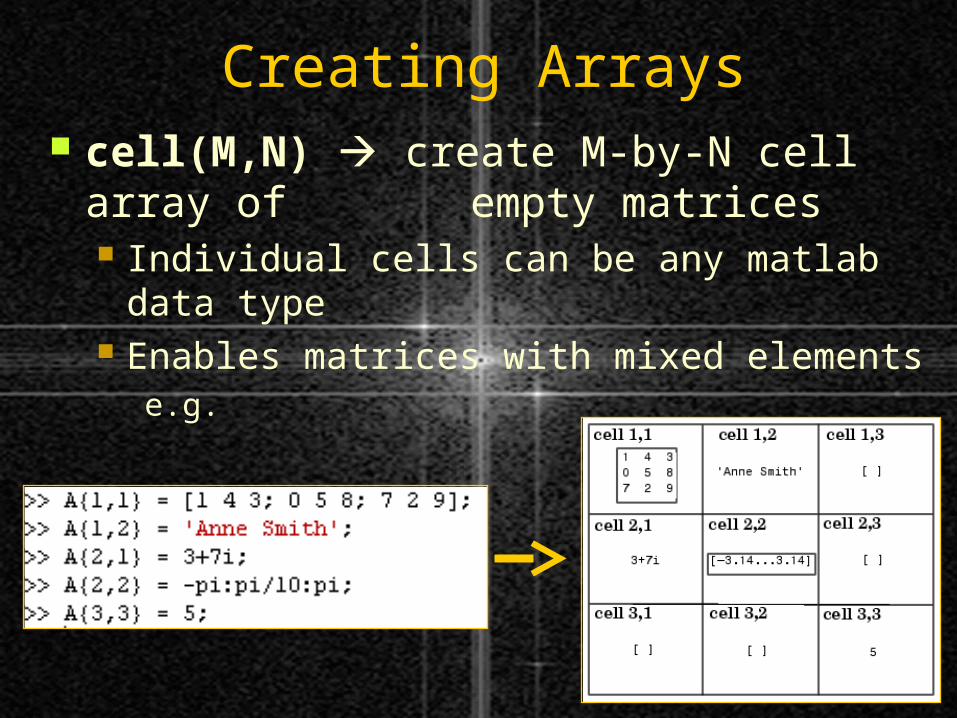
Creating Arrays cell(M,N) create M-by-N cell array of
empty matrices Individual cells can be any matlab data type Enables matrices with mixed elements
e.g.
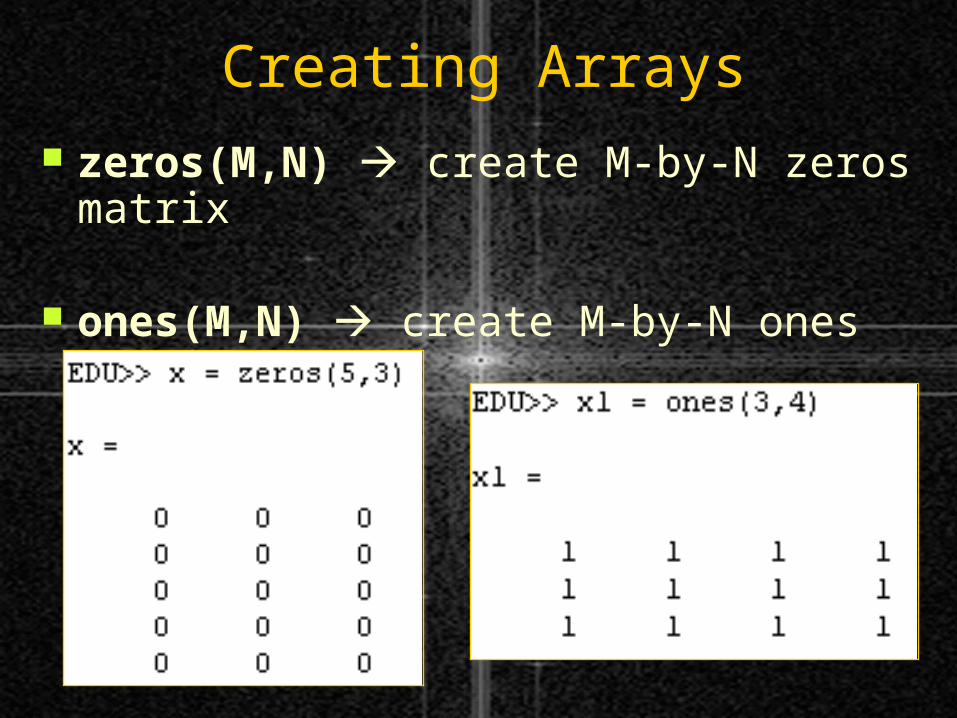
Creating Arrays zeros(M,N) create M-by-N zeros matrix
ones(M,N) create M-by-N ones matrix
User Interface Commands
More user-friendly Looks slicker Principal UI commands
uigetfile() – retrieve files questdlg() – input logical buttons inputdlg()– input values
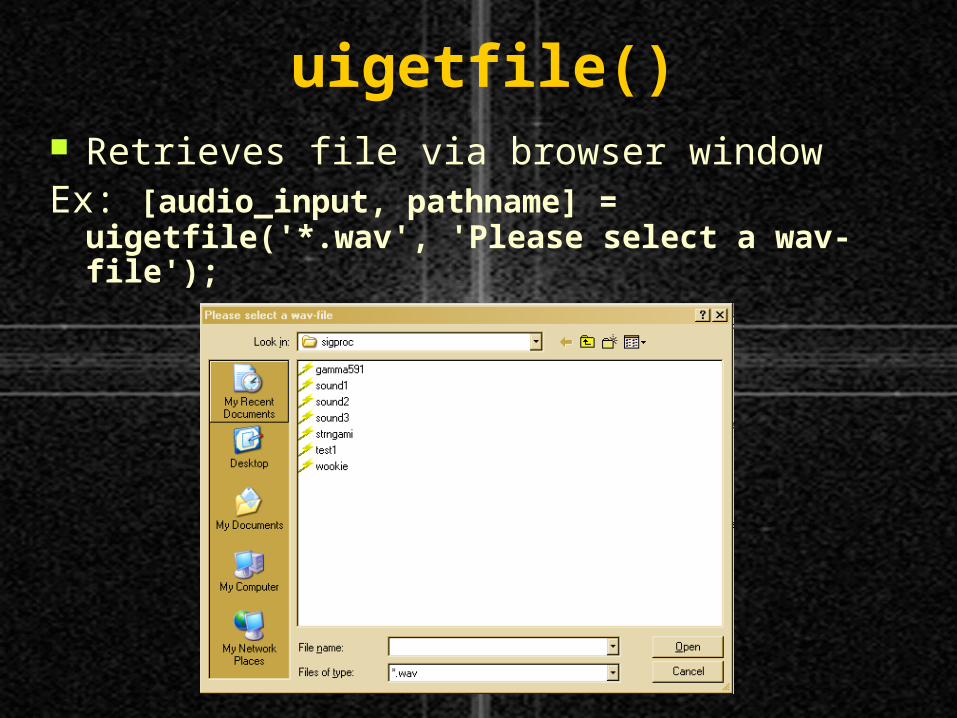
uigetfile() Retrieves file via browser windowEx: [audio_input, pathname] = uigetfile('*.wav', 'Please select a wav-file');
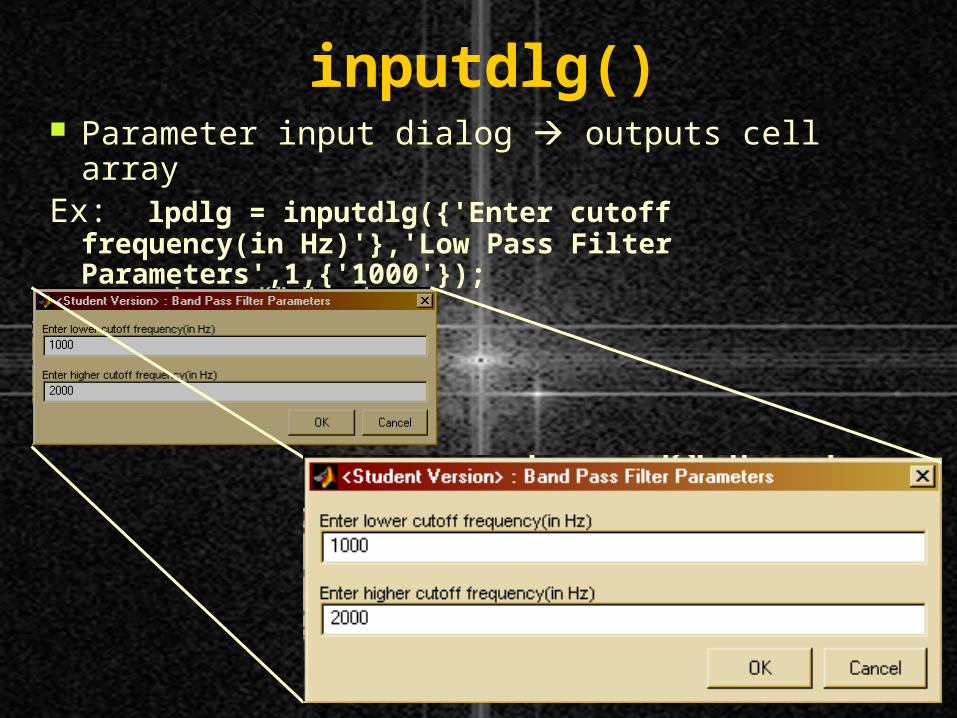
inputdlg() Parameter input dialog outputs cell arrayEx: lpdlg = inputdlg({'Enter cutoff frequency(in Hz)'},'Low Pass Filter Parameters',1,{'1000'});
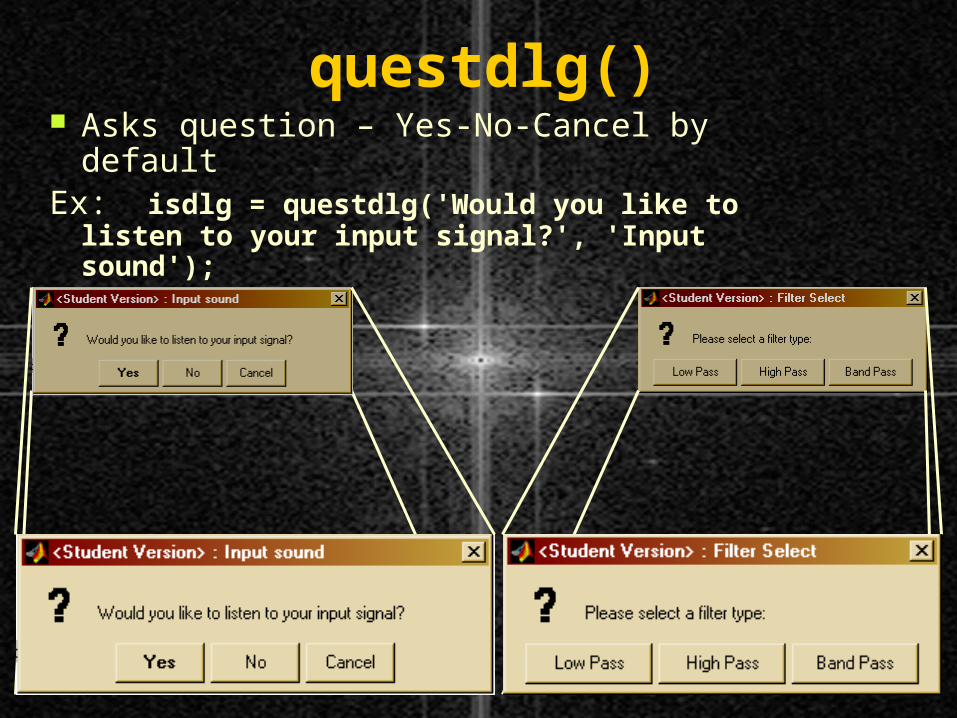
questdlg() Asks question – Yes-No-Cancel by defaultEx: isdlg = questdlg('Would you like to listen to your input signal?', 'Input sound');
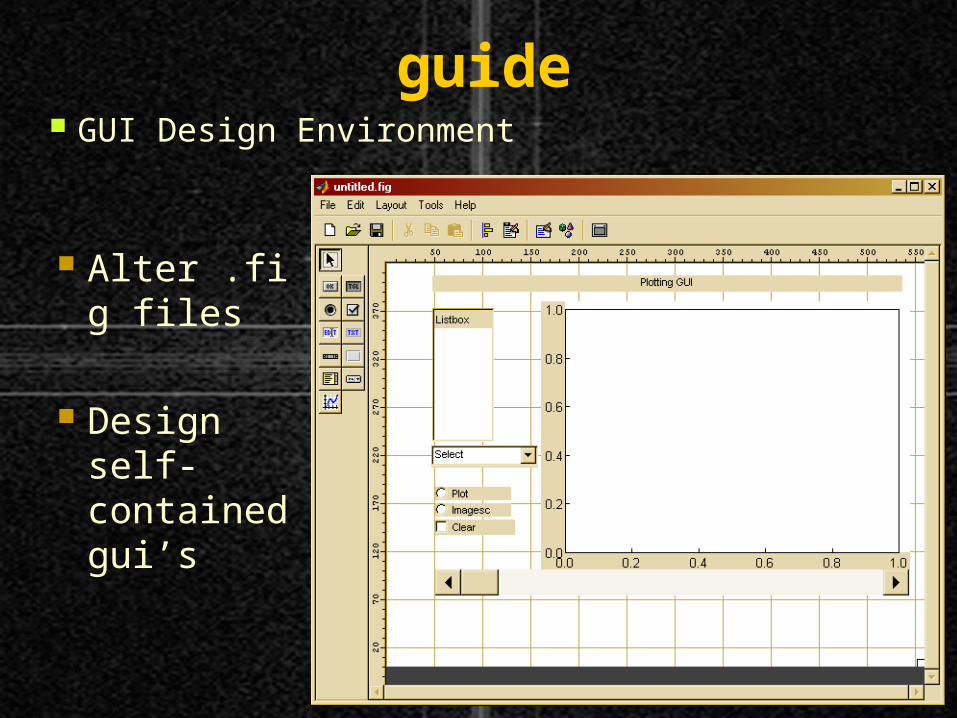
guide GUI Design Environment
Alter .fig files
Design self-contained gui’s
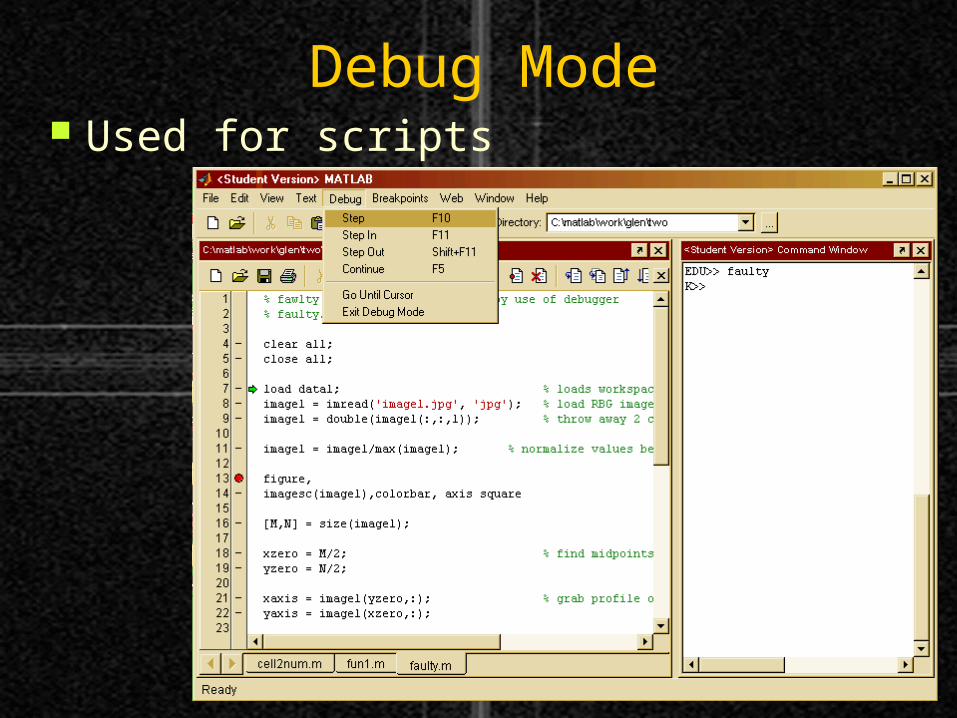
Debug Mode Used for scripts
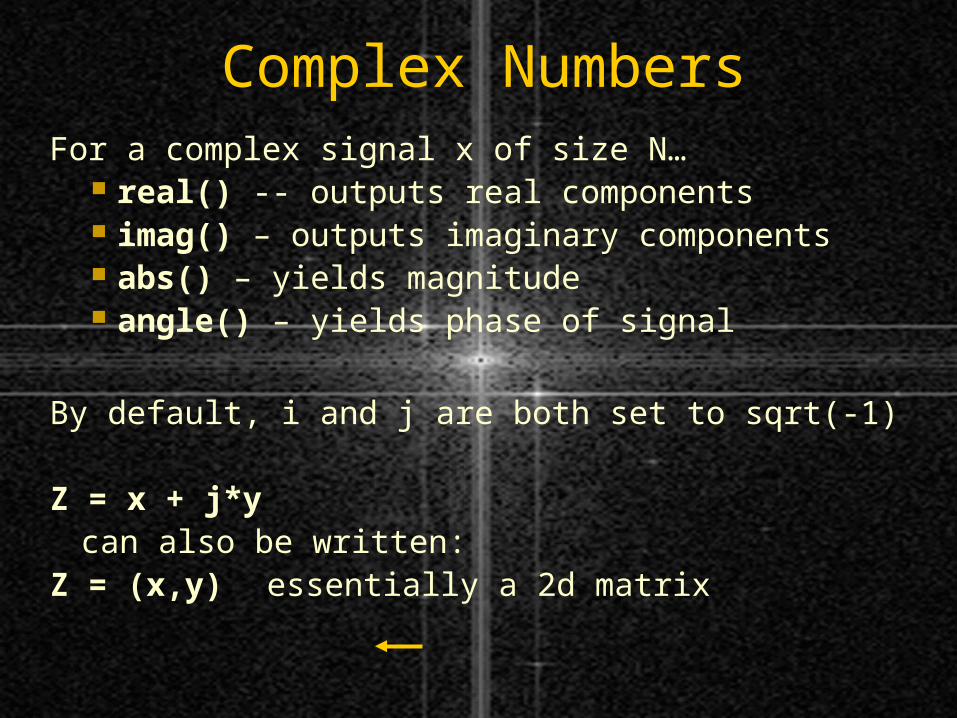
Complex NumbersFor a complex signal x of size N…
real() -- outputs real components imag() – outputs imaginary components abs() – yields magnitude angle() – yields phase of signal
By default, i and j are both set to sqrt(-1)
Z = x + j*y can also be written:
Z = (x,y) essentially a 2d matrix
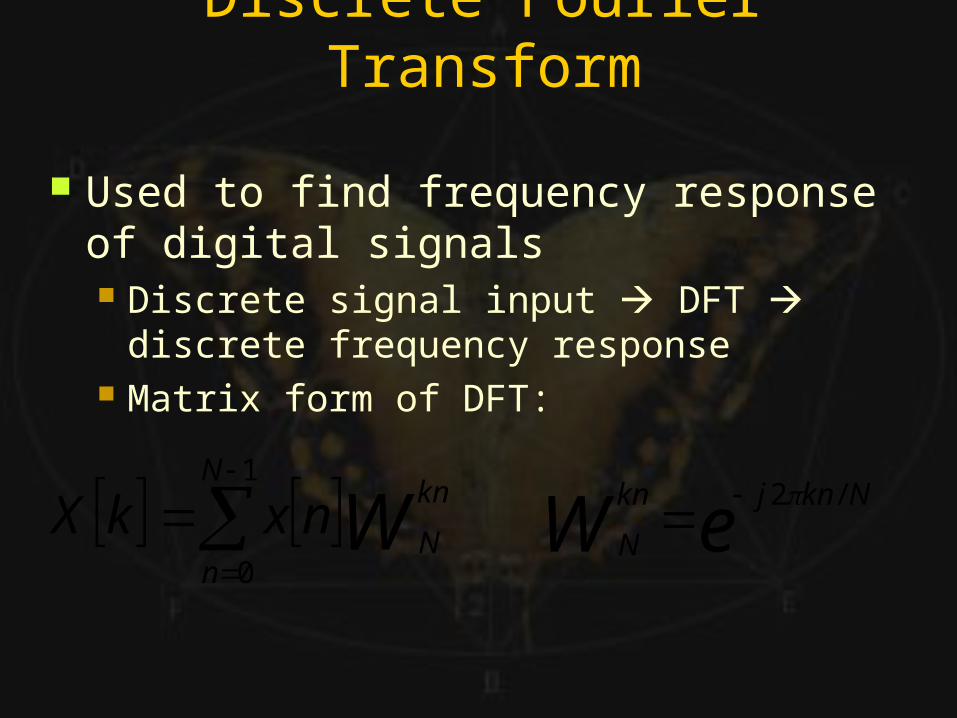
Discrete Fourier Transform
Used to find frequency response of digital signals Discrete signal input DFT discrete
frequency response Matrix form of DFT:
eWNknjkn
N
/2
1
0
N
n
kn
NWnxkX
FFT Example
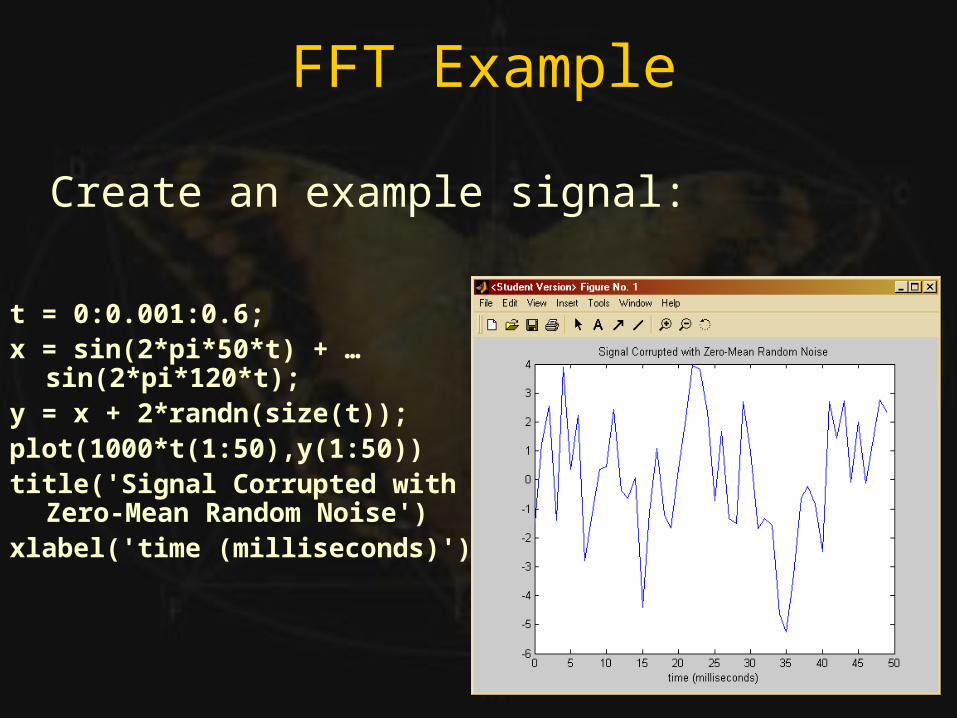
Create an example signal:
t = 0:0.001:0.6;x = sin(2*pi*50*t) + …
sin(2*pi*120*t);y = x + 2*randn(size(t));plot(1000*t(1:50),y(1:50))title('Signal Corrupted with
Zero-Mean Random Noise')xlabel('time (milliseconds)')
FFT Example
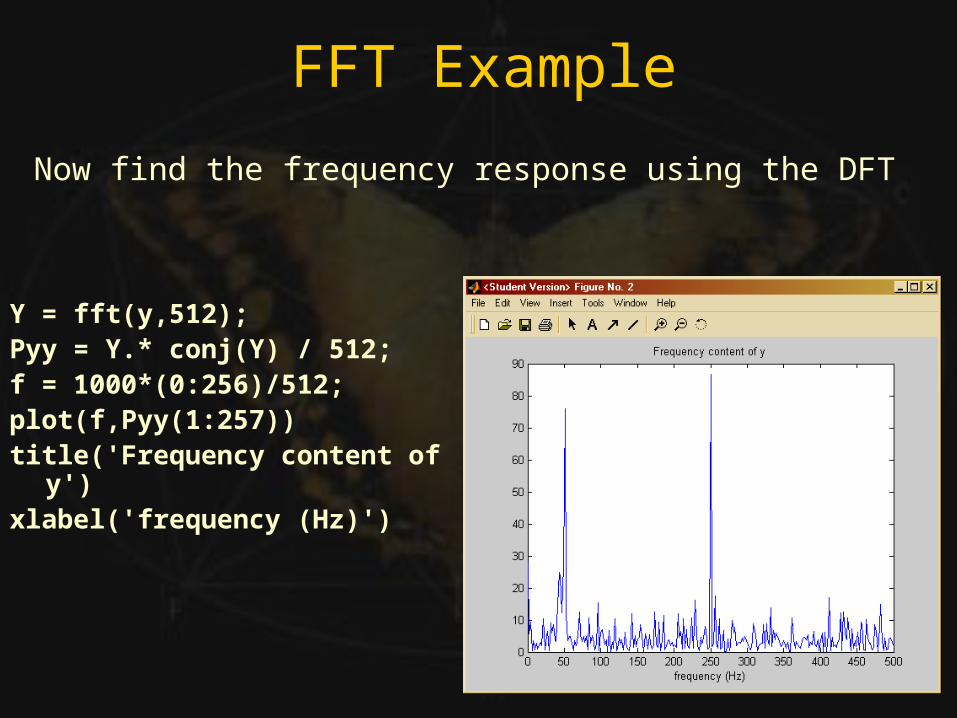
Now find the frequency response using the DFT
Y = fft(y,512);Pyy = Y.* conj(Y) / 512;f = 1000*(0:256)/512;plot(f,Pyy(1:257))title('Frequency content of
y')xlabel('frequency (Hz)')
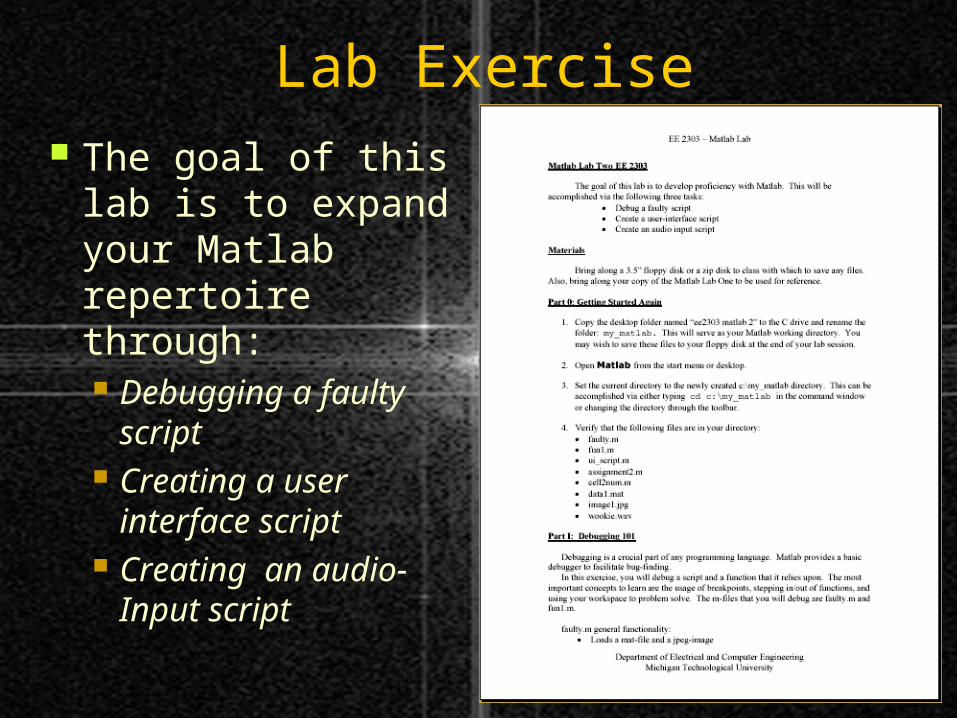
Lab Exercise The goal of this lab
is to expand your Matlab repertoire through: Debugging a faulty
script Creating a user
interface script Creating an audio-
Input script
Approximating RealityApproximating RealityEE 2303 Lab
References:
Oppenheim, Schafer. Discrete-Time Signal Processing. 2nd Edition, 1999, Prentice-Hall.
Mathworks Home Page: www.mathworks.com