Embed Size (px)
Citation preview

Introduction to MATLAB
Violeta Ivanova, Ph.D.MIT Academic Computing
[email protected]://web.mit.edu/violeta/www/IAP2006
IAP 2006 Introduction to MATLAB: Graphics
Topics
MATLAB Interface and BasicsLinear Algebra and CalculusGraphicsProgrammingGraphical User InterfaceMath On the Web (optional)
IAP 2006 Introduction to MATLAB: Graphics
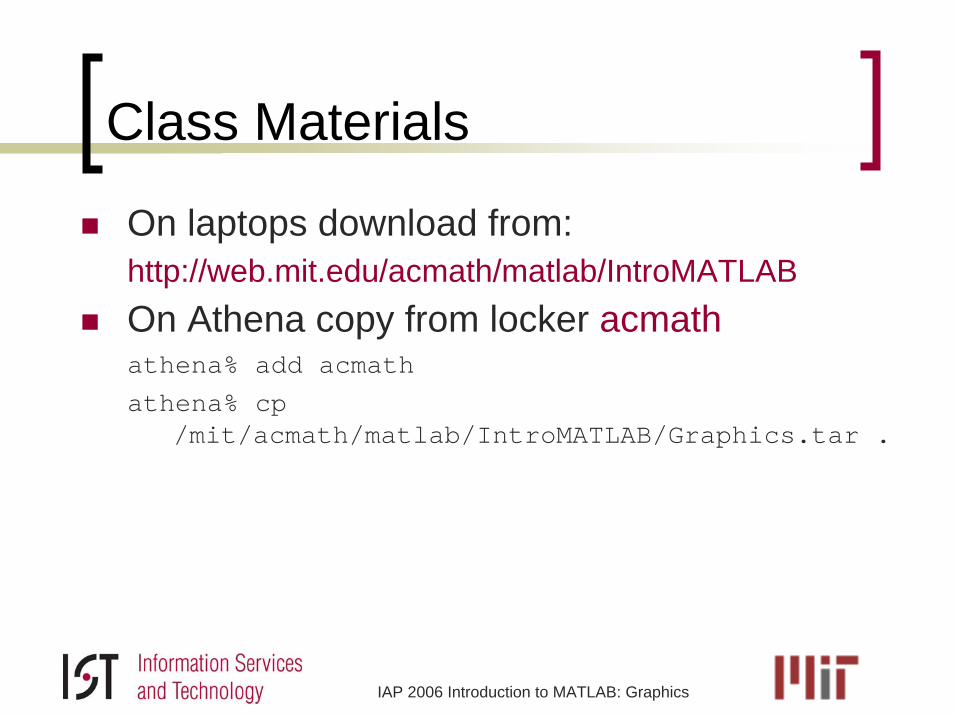
Class Materials
On laptops download from:http://web.mit.edu/acmath/matlab/IntroMATLABOn Athena copy from locker acmathathena% add acmathathena% cp
/mit/acmath/matlab/IntroMATLAB/Graphics.tar .
IAP 2006 Introduction to MATLAB: Graphics
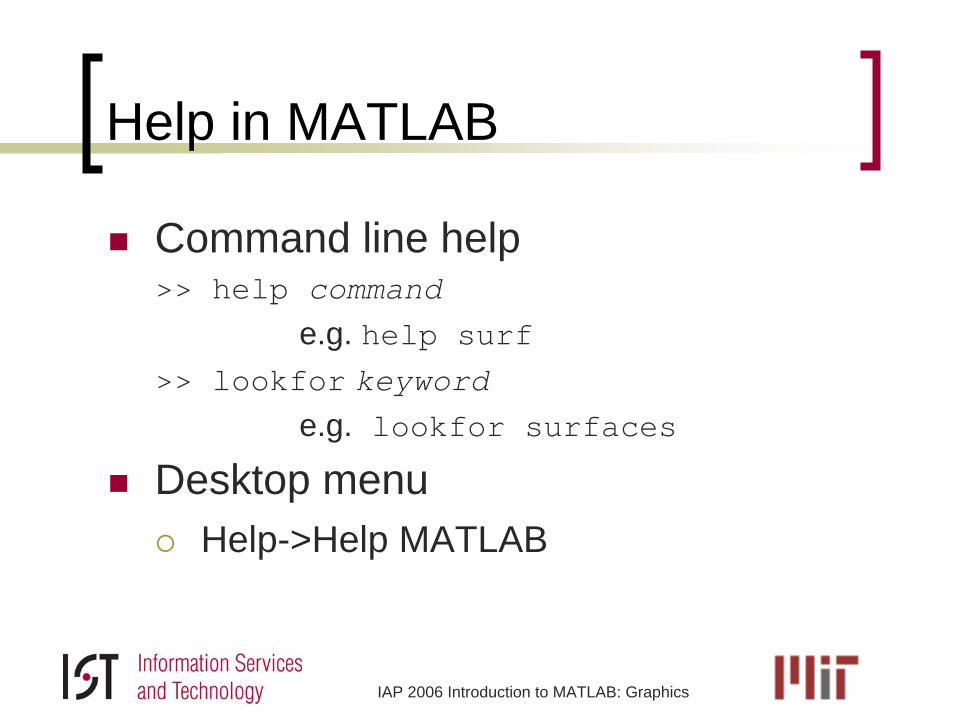
Help in MATLAB
Command line help>> help command
e.g. help surf>> lookfor keyword
e.g. lookfor surfaces
Desktop menuHelp->Help MATLAB
IAP 2006 Introduction to MATLAB: Graphics
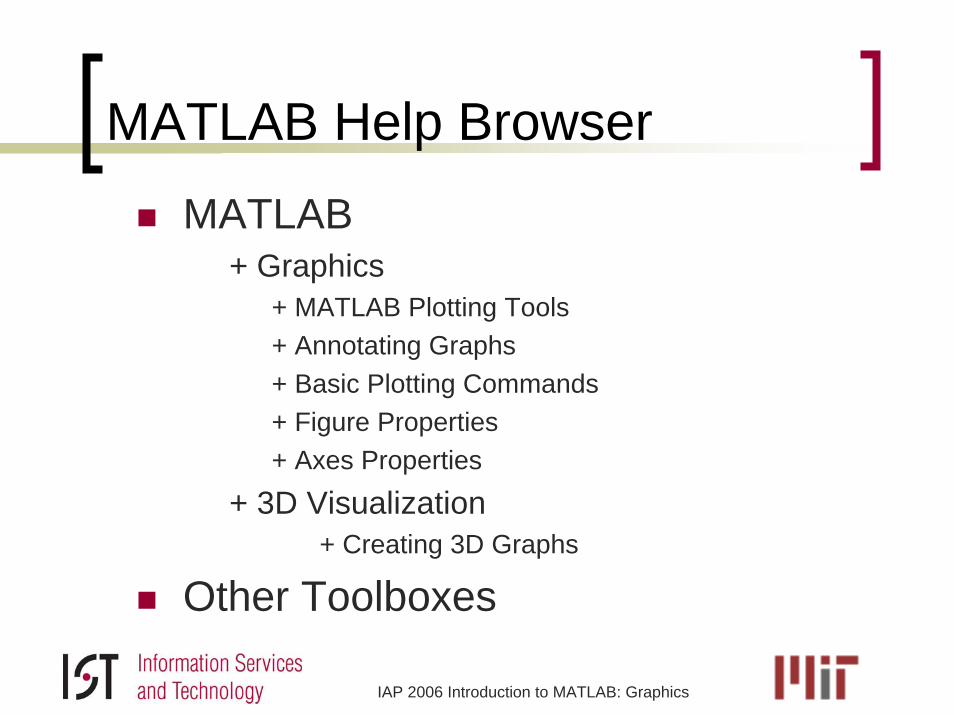
MATLAB Help Browser
MATLAB+ Graphics
+ MATLAB Plotting Tools+ Annotating Graphs+ Basic Plotting Commands+ Figure Properties+ Axes Properties
+ 3D Visualization+ Creating 3D Graphs
Other Toolboxes
MATLAB Graphics
2D and 3D PlottingFigure Property EditingAnimation
IAP 2006 Introduction to MATLAB: Graphics
Built-In FunctionsBasic plots and graphs
>> plot>> plot3>> semilogy, semilogx>> polar
Surface and mesh graphs>> surf>> mesh
Specialized plots>> contour>> scatter
IAP 2006 Introduction to MATLAB: Graphics
Built-In Functions (continued)
Annotating figures>> xlabel, ylabel, zlabel>> title>> legend>> colorbar
Multiple plots>> hold on, hold off>> subplot
Saving figures>> saveas
IAP 2006 Introduction to MATLAB: Graphics
Built-In Functions (continued)
Animation>> drawnow>> getframe>> movie2avi
Domain generation>> meshgrid>> griddata
Object properties>> get>> set
IAP 2006 Introduction to MATLAB: Graphics
Built-In Functions (continued)
Axes’ properties>> axes>> axis
Graphics handles>> gcf>> gca
And many others>> view>> lengthetc.

IAP 2006 Introduction to MATLAB: Graphics
Figure Editor
To open a new figure window:>> figure
To plot in the current figure window:>> plot (X, Y, ‘ro’)>> surf (x, y, z)>> contour (x, y, z, N)
Plotting commands create a figure window if none is open.
IAP 2006 Introduction to MATLAB: Graphics
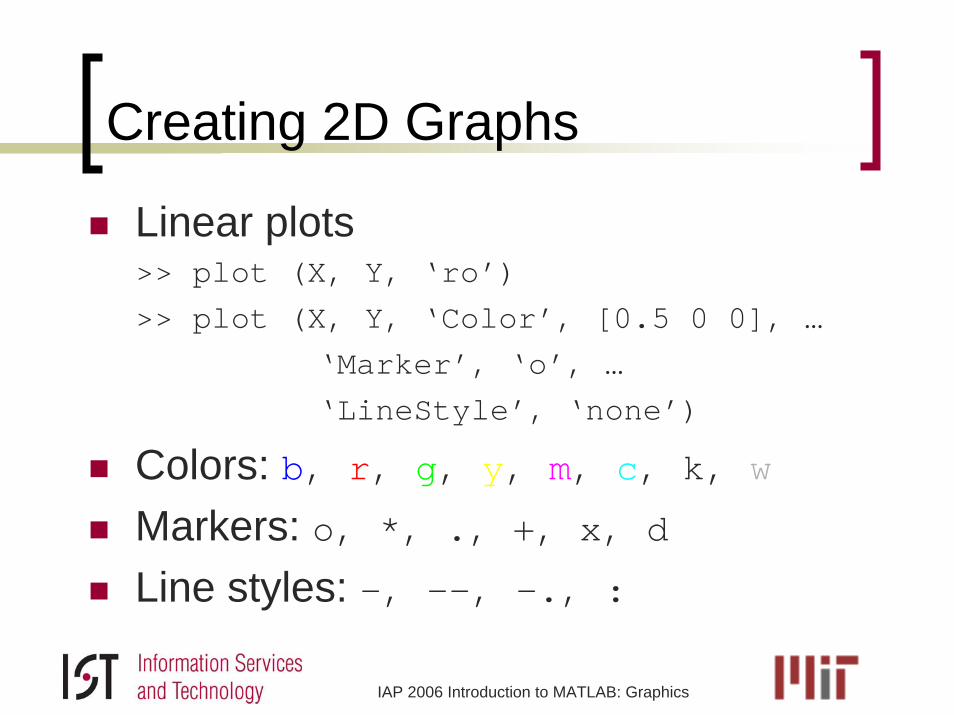
Creating 2D Graphs
Linear plots>> plot (X, Y, ‘ro’)>> plot (X, Y, ‘Color’, [0.5 0 0], …
‘Marker’, ‘o’, …‘LineStyle’, ‘none’)
Colors: b, r, g, y, m, c, k, wMarkers: o, *, ., +, x, d Line styles: -, --, -., :
IAP 2006 Introduction to MATLAB: Graphics
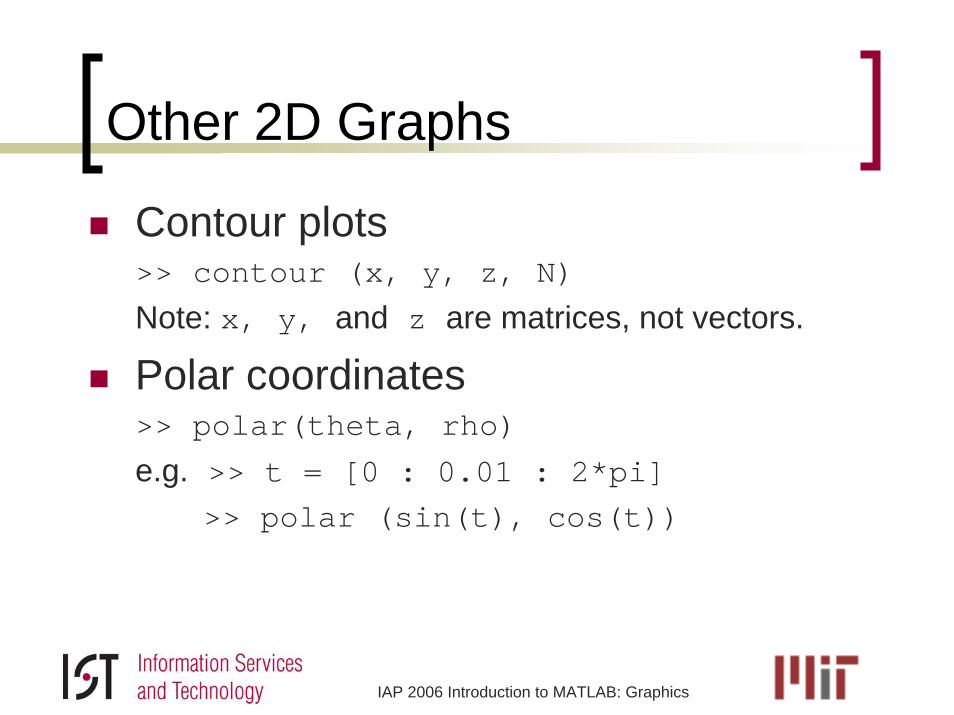
Other 2D Graphs
Contour plots>> contour (x, y, z, N)
Note: x, y, and z are matrices, not vectors.
Polar coordinates>> polar(theta, rho)
e.g. >> t = [0 : 0.01 : 2*pi]>> polar (sin(t), cos(t))
IAP 2006 Introduction to MATLAB: Graphics
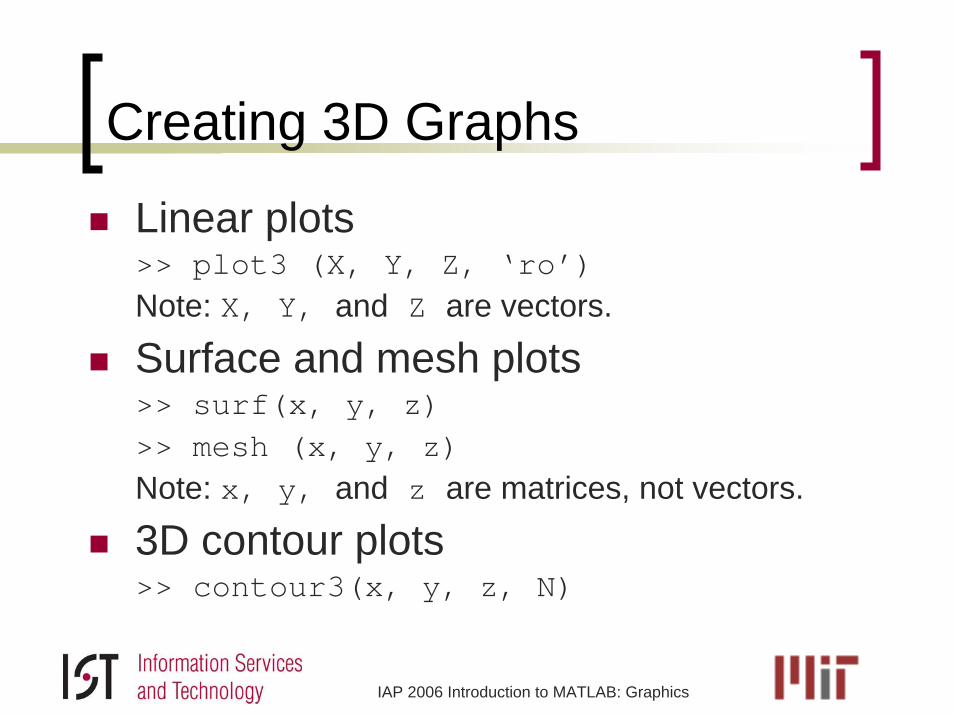
Creating 3D Graphs
Linear plots>> plot3 (X, Y, Z, ‘ro’)Note: X, Y, and Z are vectors.
Surface and mesh plots>> surf(x, y, z)>> mesh (x, y, z)Note: x, y, and z are matrices, not vectors.
3D contour plots>> contour3(x, y, z, N)
IAP 2006 Introduction to MATLAB: Graphics
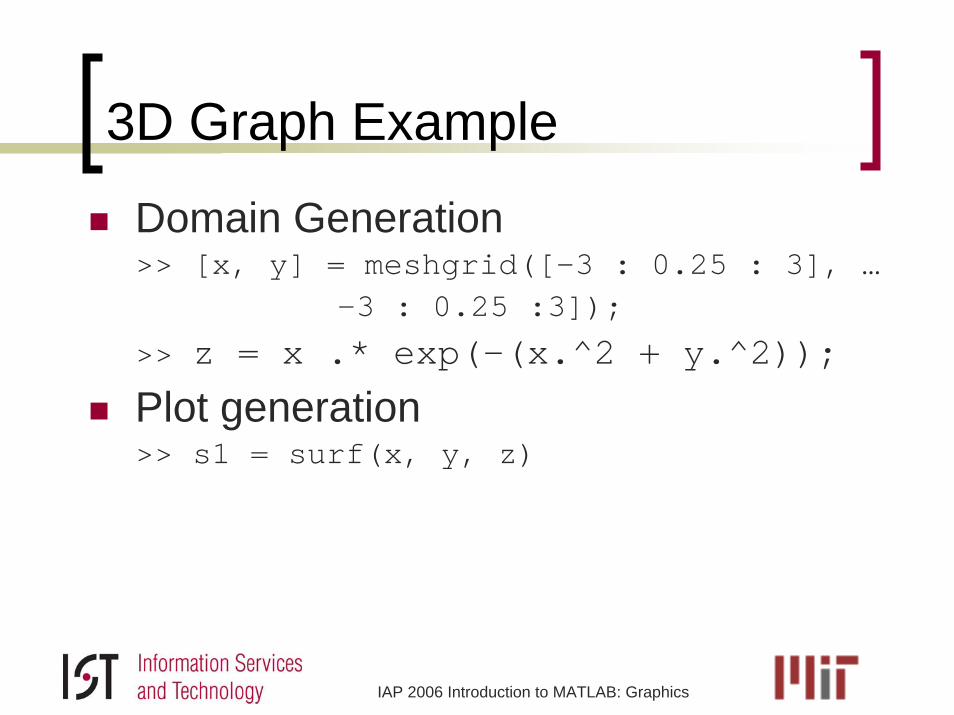
3D Graph Example
Domain Generation>> [x, y] = meshgrid([-3 : 0.25 : 3], …
-3 : 0.25 :3]);
>> z = x .* exp(-(x.^2 + y.^2));
Plot generation>> s1 = surf(x, y, z)
IAP 2006 Introduction to MATLAB: Graphics
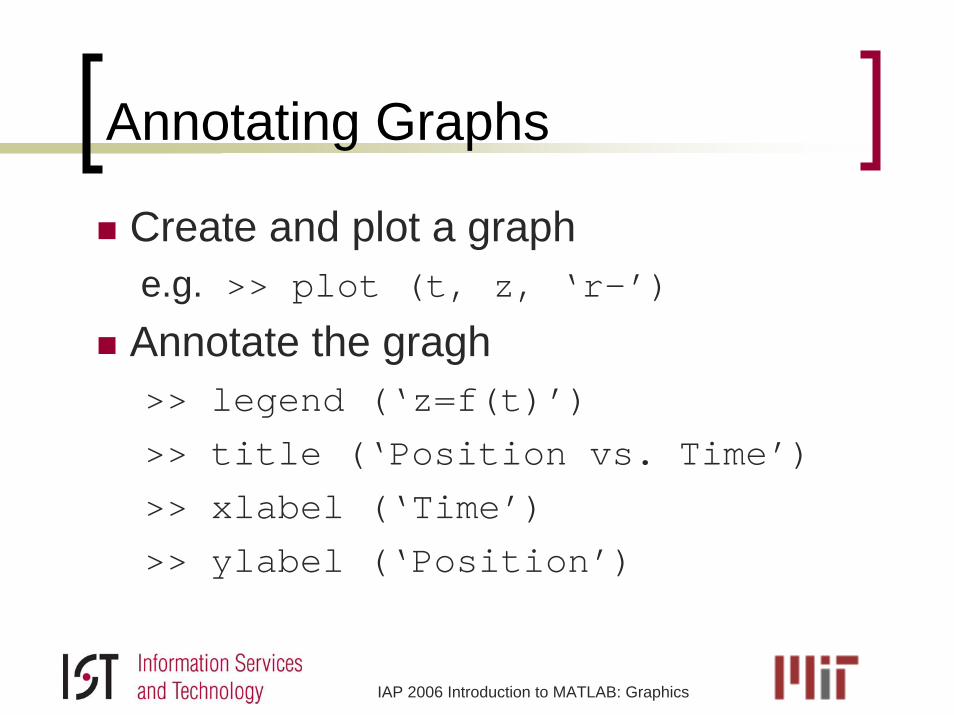
Annotating Graphs
Create and plot a graphe.g. >> plot (t, z, ‘r-’)
Annotate the gragh>> legend (‘z=f(t)’)>> title (‘Position vs. Time’)>> xlabel (‘Time’)>> ylabel (‘Position’)
IAP 2006 Introduction to MATLAB: Graphics
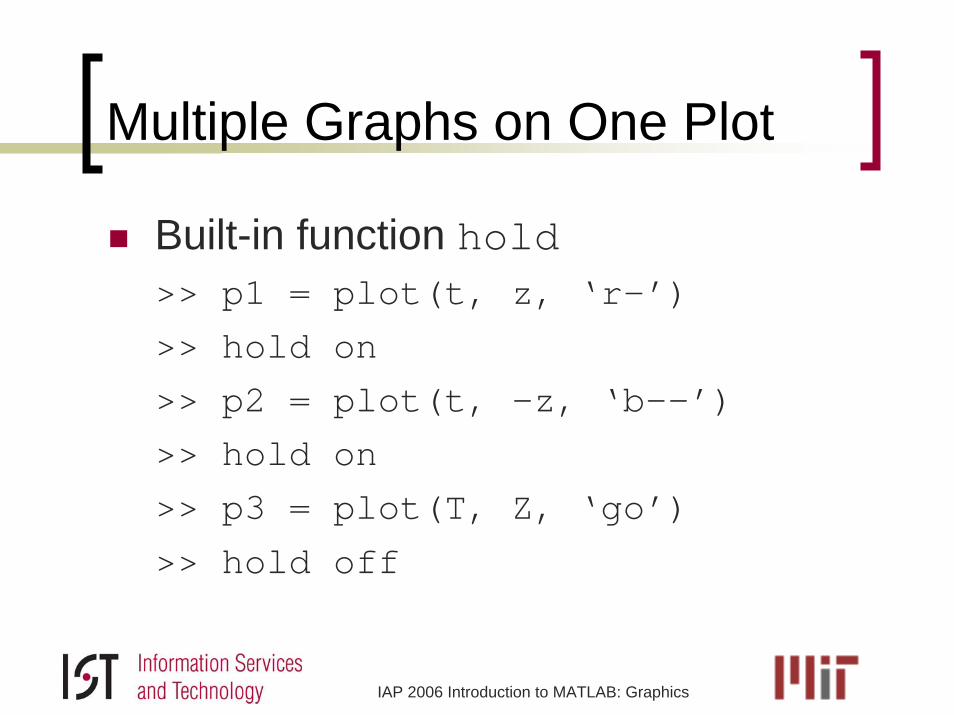
Multiple Graphs on One Plot
Built-in function hold>> p1 = plot(t, z, ‘r-’)>> hold on>> p2 = plot(t, -z, ‘b--’)>> hold on>> p3 = plot(T, Z, ‘go’)
>> hold off
IAP 2006 Introduction to MATLAB: Graphics
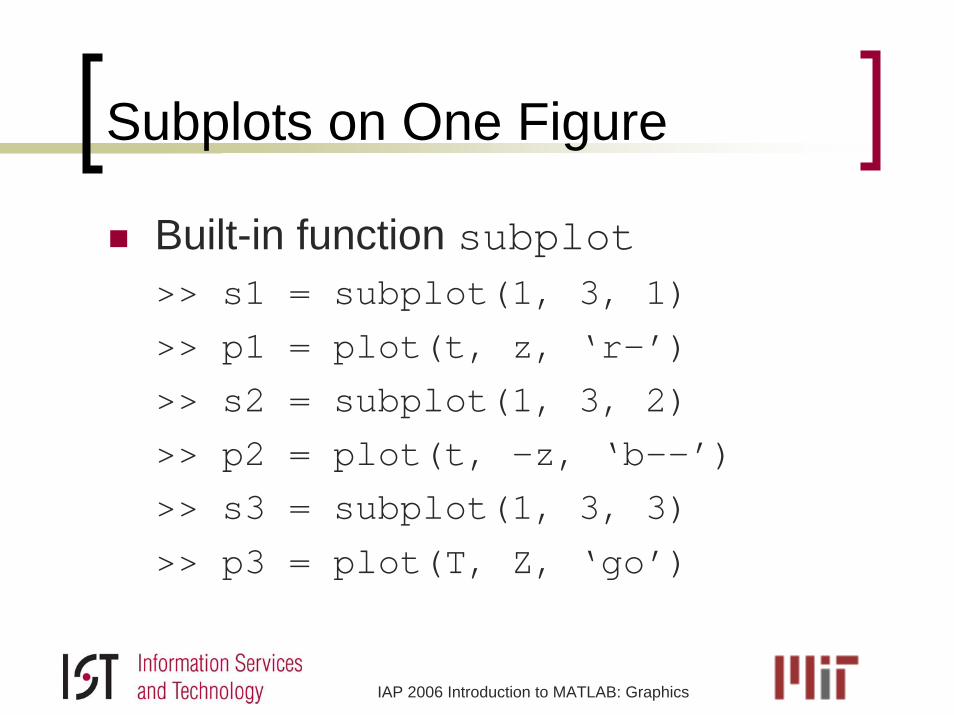
Subplots on One Figure
Built-in function subplot>> s1 = subplot(1, 3, 1)>> p1 = plot(t, z, ‘r-’)>> s2 = subplot(1, 3, 2)>> p2 = plot(t, -z, ‘b--’)>> s3 = subplot(1, 3, 3)
>> p3 = plot(T, Z, ‘go’)
IAP 2006 Introduction to MATLAB: Graphics
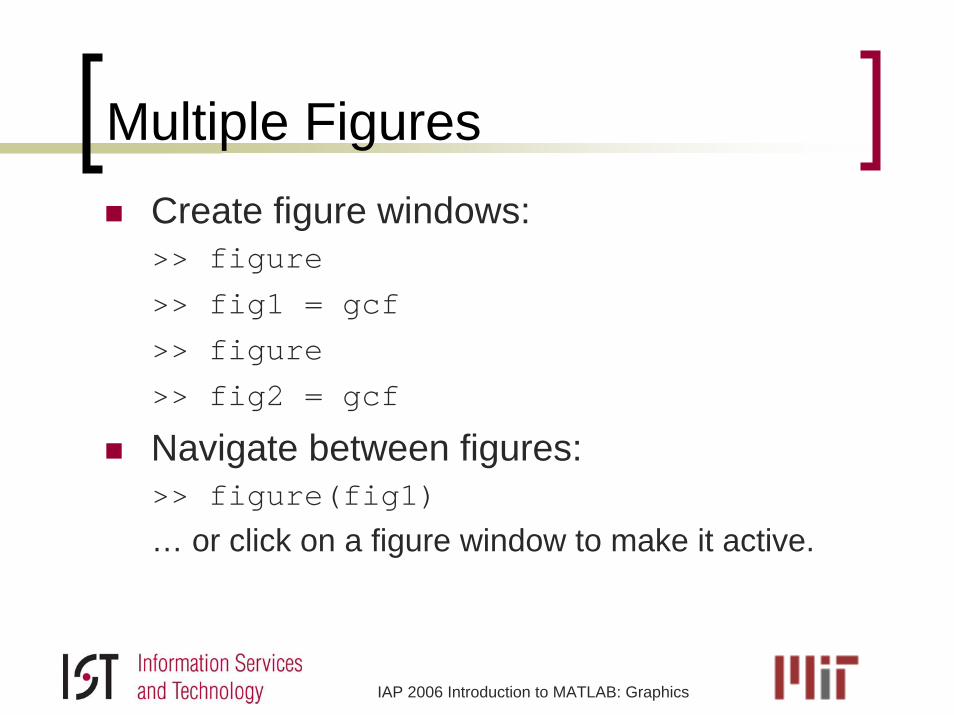
Multiple FiguresCreate figure windows:>> figure>> fig1 = gcf>> figure>> fig2 = gcf
Navigate between figures:>> figure(fig1)
… or click on a figure window to make it active.
IAP 2006 Introduction to MATLAB: Graphics
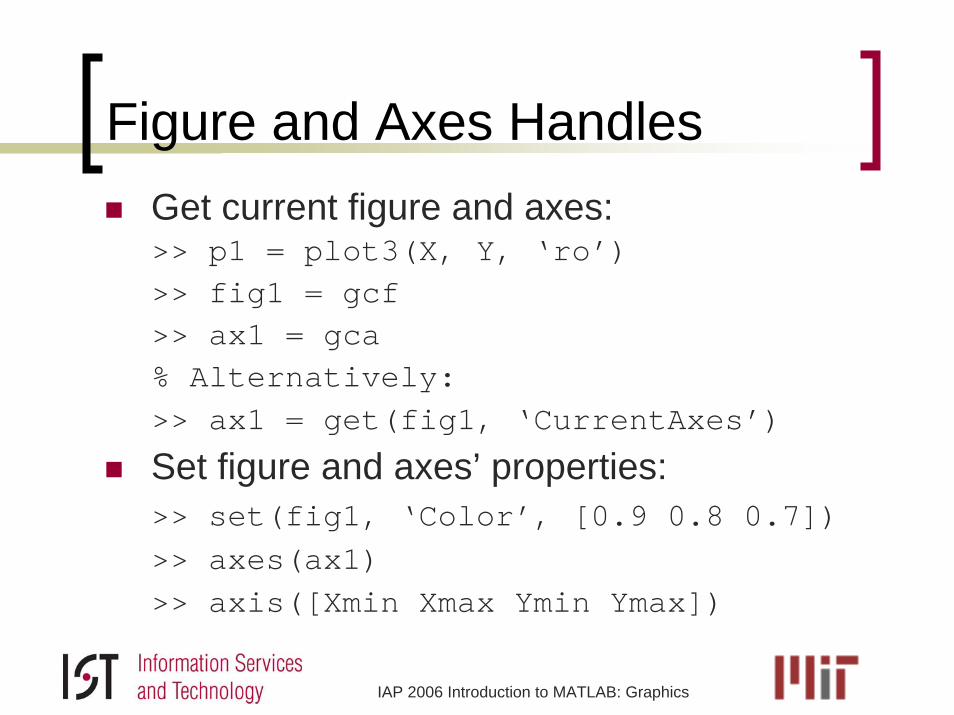
Figure and Axes HandlesGet current figure and axes:>> p1 = plot3(X, Y, ‘ro’)>> fig1 = gcf>> ax1 = gca% Alternatively:>> ax1 = get(fig1, ‘CurrentAxes’)
Set figure and axes’ properties:>> set(fig1, ‘Color’, [0.9 0.8 0.7])>> axes(ax1)>> axis([Xmin Xmax Ymin Ymax])
IAP 2006 Introduction to MATLAB: Graphics
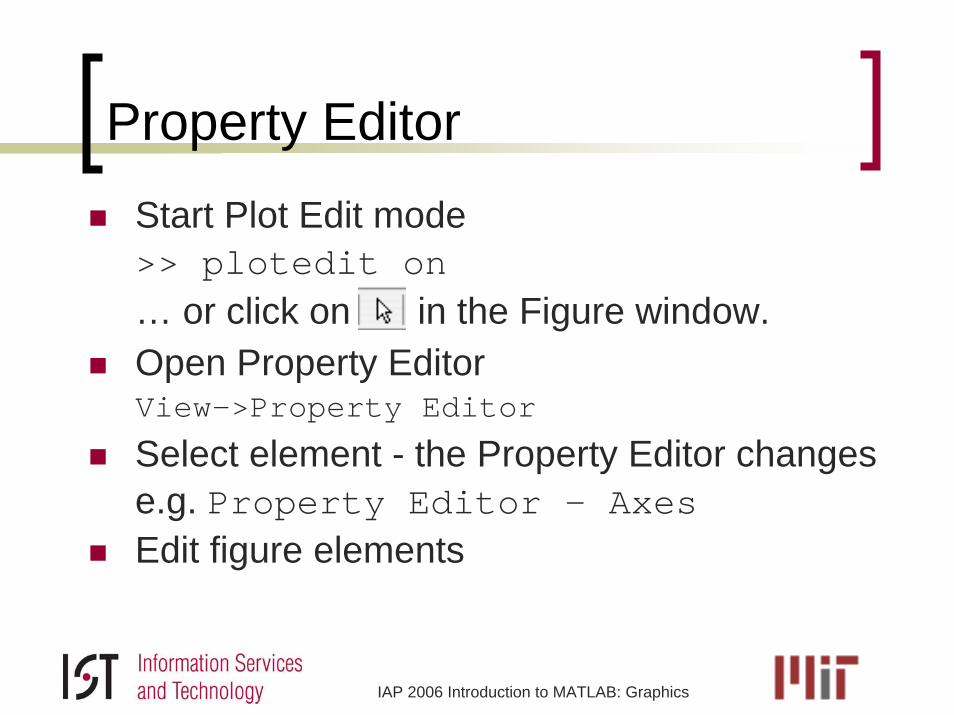
Property EditorStart Plot Edit mode>> plotedit on… or click on in the Figure window.Open Property EditorView->Property Editor
Select element - the Property Editor changes e.g. Property Editor - AxesEdit figure elements
IAP 2006 Introduction to MATLAB: Graphics
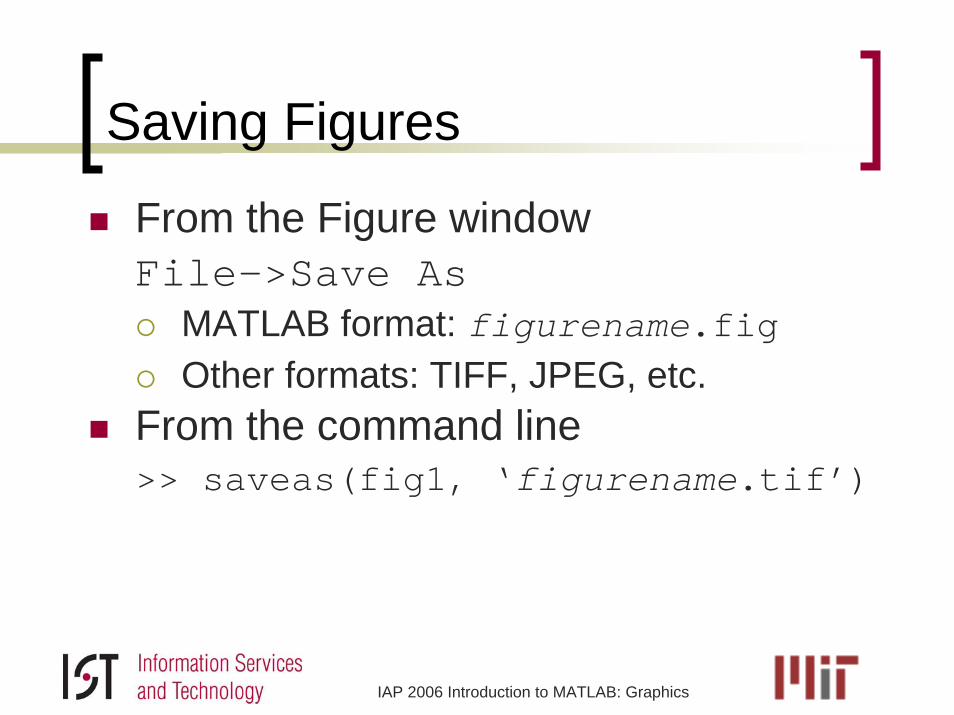
Saving Figures
From the Figure window File->Save As
MATLAB format: figurename.figOther formats: TIFF, JPEG, etc.
From the command line>> saveas(fig1, ‘figurename.tif’)
IAP 2006 Introduction to MATLAB: Graphics
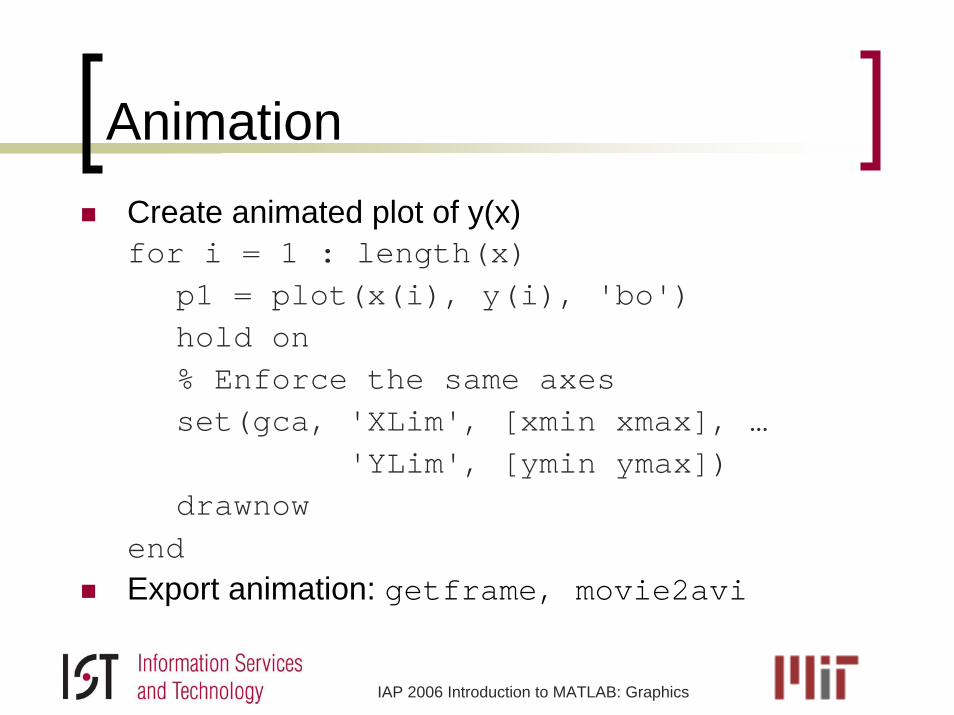
AnimationCreate animated plot of y(x)for i = 1 : length(x)
p1 = plot(x(i), y(i), 'bo')hold on% Enforce the same axesset(gca, 'XLim', [xmin xmax], …
'YLim', [ymin ymax])drawnow
endExport animation: getframe, movie2avi
IAP 2006 Introduction to MATLAB: Graphics
Graphics Exercises
Exercise One: example1.m3D plotting, multiple graphs, multiple figuresFigure editor, annotation, Plot Edit modeFigure and graphics handlesGraphics export
Exercise Two: example2.m2D plotting, subplots on figureProperty Editor, graphics customization
Exercise Three: example3.mAnimation