Embed Size (px)
Citation preview
3
Introduction to Input-Output Framework for Analysis of Tourism as an Industry
Tadayuki (Tad) Hara 1Rosen College of Hospitality Management, University of Central Florida
& Advisory Committee Member on International Trends on Tourism Statistics, Japan Tourism Agency, Ministry of Land, Infrastructure, Transport and Tourism,
1USA 2Japan
1. Introduction
Input-Output (I-O) is an economic framework which was awarded two Nobel Prizes in Economics, one in 1973 to Dr. Wassily Leontief and the other for its extended Social Accounting Matrix (SAM) to Sir Richard Stone in 1984. The I-O/SAM framework remains as a core component for Computable General Equilibrium (CGE), which cannot function without the data of I-O/SAM. Applications of I-O family have been published not only in the broader social science fields including but not limited to economics, regional science, international development, but also in the tourism field. I-O framework is the foundation of System of National Accounts (SNA), which has been used by all the national governments in the world to measure important data such as gross domestic product (GDP), capital formation etc. Need for studying I-O has been increased significantly for tourism researchers because of a simple fact that a global common recording system to measure economic activities of tourism, officially endorsed by United Nations, World Bank, International Monetary Fund, Organization for Economic Cooperation and Development, to name a few, is based on I-O.
There are, however, two serious problems for researchers and students of tourism to study the I-O. First, majority, if not all, of applied tourism researchers have never took formal training of how the I-O works, instead they only carry secondary perception that I-O framework is outdated and offers little value to the tourism field. Second, because of the first challenges, they do not have enough formal opportunities to learn about this extremely important framework, without which you cannot “understand” how the I-O and its extended family, such as SAM, CGE and TSA work. This chapter offers the shortest way to learn the minimum required knowledge of I-O framework for hospitality and tourism researchers and students. Technical explanations followed descriptions by Hara (2008).
1.1 Brief history
Dr. Wassily Leontief succeeded in materializing the concept of “Tableau Economique” presented by the French Economist Francois Quesnay, in 1758. Dr. Leontief published the
www.intechopen.com
Visions for Global Tourism Industry – Creating and Sustaining Competitive Strategies
50
U.S. Input-Output table of 1919 and 1929, in 1936 (Leontief, 1951), followed by a series of publications, resulting in the 1973 award of the Nobel Prize in Economics "For the development of the input-output method and for its application to important economic problems."
Dr. Walter Isard started to focus on regional economic impact analysis in the 1940s and initiated a new academic field entitled “Regional Science”, which is roughly explained as “Applied Geographical Economics.” Regional Science Association International (RSAI) was founded by Dr. Isard in 1954, and many researchers have expanded the depth and width of applied research using quantitative methods to address issues of regional economic analyses. Scholars in this field have contributed a lot towards the development and application of the I-O models, in order to help solve the problems in the world.
Input-Output modeling, “has failed to maintain the interest of academic theorists”. (Duchin 1998) While the popularity of stochastic modeling has been high, the Input-Output modeling did not capture the main-stream momentum due to the perception of researchers regarding the absence of stochastic elements. Knowledge on Input-Output modelling became necessary as prerequisite to understand Tourism Satellite Accounts, which is based on the System of National Accounts (SNA), the product of the Input-Output framework to measure activities of the national economy.
2. Concept of simple input-output modeling
Let’s assume that we want to learn about our society, and let’s assume that our society consists of three industrial sectors only, namely agriculture, manufacturing and services sectors. Model is a simplified version of the complex society.
[Understanding Intermediate Goods and Final Consumption]
Assume that you want to purchase an apple juice in a plastic bottle to quench your thirst. Here is the first important question. What does the apple juice bottle consist of? Is it a manufactured product, or an agricultural product? While the plastic bottle is the manufactured product, namely a product made by the manufacturing sector, one important ingredient came from the agricultural sector, the apples. The manufacturing sector purchased the output – namely, the apples - from the agricultural sector, not to be consumed, but to be used as intermediate goods for producing the final product - the apple juice in the plastic bottles. If the manufacturer is the food processing company, they must have bought the empty bottles from another manufacturing sector, thus the manufacturing sector is selling plastic bottles to the other firms within the same manufacturing sector. When a sector purchases required input from other sectors, in order to produce their own goods, the former are called “intermediate goods” and this type of transaction is called “inter-industry transactions”. This is in clear contrast with the purchase of the apple juice bottle for your own consumption. Your purchase, unless you try to purchase a bulk to sell to your friends for profit, is deemed as “final consumption”, and your purchase is considered as “final demand”.
[Understanding Intermediate Transactions, Final Demands and Total Output]
Imagine now that you are an apple farmer, and that you sell your apples (=output) to two kind of purchasers, only. First of all, you sell some apples (=output) to the manufacturing
www.intechopen.com
Introduction to Input-Output Framework for Analysis of Tourism as an Industry
51
sector, who make apple juice. They purchase your apples (=output) as “intermediate goods” in the inter-industry transactions (agricultural output sold to the manufacturing sector). As for the remaining apples, you decide to take them to the Farmer’s Market, where people can directly purchase them for their own consumption, to satisfy their “final demand”.
To put these sentences in a simple equation, we can say that
Intermediate Goods + Final Demand = Total Output (1)
(Apples sold to other industries) + (Apples sold for final demand) = (All the apples produced)
Since this is one of the key concepts, let’s look at some examples. Imagine you own the Michelin tire factory. Some sales go to Nissan Motors as intermediate goods - so that Nissan Motor can sell their new cars with tires - and some sales go directly to consumers who want to purchase tires for their car, i.e. as a final demand.
Now imagine you are a farmer who grows tomatoes. If Peter, a restaurant owner, wants to
purchase fresh tomatoes for his restaurant, the purchase is considered as a purchase of
intermediate goods, since Peter will not be consuming these tomatoes but will be using them
as a necessary ingredient in preparing his final products - tomato salads, tomato pizzas,
spaghetti with tomato sauce, etc. When you sell your tomatoes to Nina who purchases the
same tomatoes for her own enjoyment, this transaction fulfils her final demand, because she
is purchasing tomatoes to satisfy her own final demand to consume fresh, tasty tomatoes.
What about hard-disk manufacturers? They sell some hard-disks to Dell so that it can create
a personal computer for you, while they can also sell a hard-disk directly to you, so that you
can upgrade the current 20GB disk to, for example, 1TB.
Does this apply to a hotel environment? If you are the general manager of a 800-room hotel with full occupancy on a given night, all the 800 rooms are sold. Does this mean that all 800 rooms are sold to fulfill the final demand? It is indeed possible that all rooms are sold to fulfill final demands of at least 800 people, but there could also be some rooms which are sold as intermediate goods. If a travel agency purchases a block of rooms for the purpose of selling them as a part of package tour to individuals, the rooms sold to the travel agency are sales of intermediate goods, while the final demand would be satisfied as people purchase an all-inclusive package tour from the travel agent, which includes a hotel room. Also online intermediaries (companies which sell hotel rooms and other travel-related commodities through online transactions with customers), purchase hotel rooms as intermediate inputs and sell them to consumers’ final demands. (In the United States, hotel industry’s intermediate sales account for more than 1/3 to 2/5 of the total sales, so you can imagine this concept is highly relevant to understand the current commerce of hotel rooms.)
Now we can look at them in a table format in the next section.
2.1 Introduction to basic structure of input-output transaction table
The Input-Output table is displayed in a two-dimensional matrix format, with rows and columns. Rows show the output for each sector, and columns show the input for each sector. It is time that we read tables with examples shown in proper sequences.
www.intechopen.com

Visions for Global Tourism Industry – Creating and Sustaining Competitive Strategies
52
Table 1 is a simplified basic structure of the Input-Output framework. Table 2 is the same framework with some numbers. While both the MS-Excel sheet and the explanation of the whole tables in this chapter, I will explain the agricultural sector’s numbers both in the row (1st row from top to bottom) and in the column (1st column from left to right), to show you how to read the numbers in Table 2.
Table 1. Input-Output Transaction Table
Table 2. Input-Output Transactions Table with Numbers
[Interpretations of a Row in Transaction Table]
As you can see, the agricultural sector’s row in Table 3-2 runs as follows:
[1 2 1 6 10]
This means that in the course of that year, the agricultural sector’s sales within the same sector were 1, its sales to the manufacturing sector were 2, its sales to the service sector were 1, and its sales to Final Demand (FD) were 6, which amounts to a total output of 10. To put the number in equation,
(1 + 2 + 1) + 6 = 10
Intermediate goods + Final Demand = Total Output
Intermediate goods are sold to the industrial sector as necessary ingredients, or as input for this sector. By looking at the row of the agricultural sector, you can see the destination of this sector’s output. In this case, a total of 4 agricultural goods provided the industrial sectors with intermediate goods and the total of 6 went to final demands. This table is called a “transaction table” as it captured actual amount of transactions between sectors. Each industrial sector may have different methods to record their sales volumes, such as numbers of bushels, cars, barrels, or numbers of visitors, attendees, but in the transaction table, it is more convenient to use common monetary values that reflect the exchange of goods and money. Thus, we use common units such as US$ million or € million.
www.intechopen.com
Introduction to Input-Output Framework for Analysis of Tourism as an Industry
53
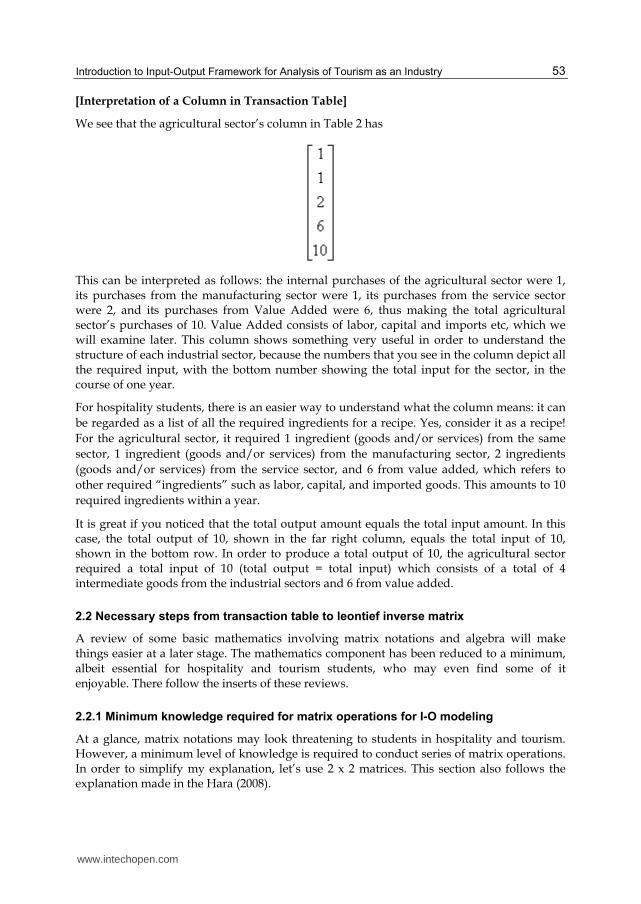
[Interpretation of a Column in Transaction Table]
We see that the agricultural sector’s column in Table 2 has
This can be interpreted as follows: the internal purchases of the agricultural sector were 1, its purchases from the manufacturing sector were 1, its purchases from the service sector were 2, and its purchases from Value Added were 6, thus making the total agricultural sector’s purchases of 10. Value Added consists of labor, capital and imports etc, which we will examine later. This column shows something very useful in order to understand the structure of each industrial sector, because the numbers that you see in the column depict all the required input, with the bottom number showing the total input for the sector, in the course of one year.
For hospitality students, there is an easier way to understand what the column means: it can
be regarded as a list of all the required ingredients for a recipe. Yes, consider it as a recipe!
For the agricultural sector, it required 1 ingredient (goods and/or services) from the same
sector, 1 ingredient (goods and/or services) from the manufacturing sector, 2 ingredients
(goods and/or services) from the service sector, and 6 from value added, which refers to
other required “ingredients” such as labor, capital, and imported goods. This amounts to 10
required ingredients within a year.
It is great if you noticed that the total output amount equals the total input amount. In this case, the total output of 10, shown in the far right column, equals the total input of 10, shown in the bottom row. In order to produce a total output of 10, the agricultural sector required a total input of 10 (total output = total input) which consists of a total of 4 intermediate goods from the industrial sectors and 6 from value added.
2.2 Necessary steps from transaction table to leontief inverse matrix
A review of some basic mathematics involving matrix notations and algebra will make things easier at a later stage. The mathematics component has been reduced to a minimum, albeit essential for hospitality and tourism students, who may even find some of it enjoyable. There follow the inserts of these reviews.
2.2.1 Minimum knowledge required for matrix operations for I-O modeling
At a glance, matrix notations may look threatening to students in hospitality and tourism. However, a minimum level of knowledge is required to conduct series of matrix operations. In order to simplify my explanation, let’s use 2 x 2 matrices. This section also follows the explanation made in the Hara (2008).
www.intechopen.com

Visions for Global Tourism Industry – Creating and Sustaining Competitive Strategies
54
[Matrix addition]
We assume that there are two matrices whose numbers of rows and columns are the same. In our case, we have two matrices of B and C, both of which are square matrices of 2 x 2. You can add or subtract the matrices when the numbers of rows and columns are identical.
,a b e f
B Cc d g h
Then, B + C simply amounts to adding the corresponding elements together.
a e b fB C
c g d h
[Matrix Subtraction]
What about B – C? Similarly to the addition, corresponding elements of C are subtracted
from the elements of B.
a e b fB C
c g d h
So far, matrix operations only look scary but it is not that bad.
[Matrix Multiplication]
Multiplication operation is not as easy as the previous operations. As a basic rule, one can only multiply a matrix when the number of columns of the matrix to be multiplied is the same as the number of rows in the multiplying matrix. The result of the multiplication yields a matrix whose number of rows equals the number of rows of the multiplied matrix, and whose number of columns equals the number of columns of the multiplying matrix. There follow a few examples.
If B is a 3 x 3 square matrix, which of the following matrix can be used with it?
, , , ?
k r s tn o
D h i j E l F G u v wp q
m x y z
The answer can be obtained when you identify the numbers of rows and columns of each
matrix. D = (1 x 3), E = (3 x 1), F = (2 x 2) and G = (3 x 3).
In other words:
B and D would be (3 x 3) x (1 x 3) Unsuitable
B and E would be (3 x 3) x (3 x 1) Suitable (conformable)
B and F would be (3 x 3) x (2 x 2) Unsuitable
B and G would be (3 x 3) x (3 x 3) Suitable (conformable)
www.intechopen.com
Introduction to Input-Output Framework for Analysis of Tourism as an Industry
55
And the result would be
B and E would be (3 x 3) x (3 x 1) a matrix of (3 x 1)
B and G would be (3 x 3) x (3 x 3) a matrix of (3 x 3)
If you understand that the outcome of (n x n) x (n x 1) would yield a matrix of (n x 1), you are in good shape to proceed with minimum knowledge.
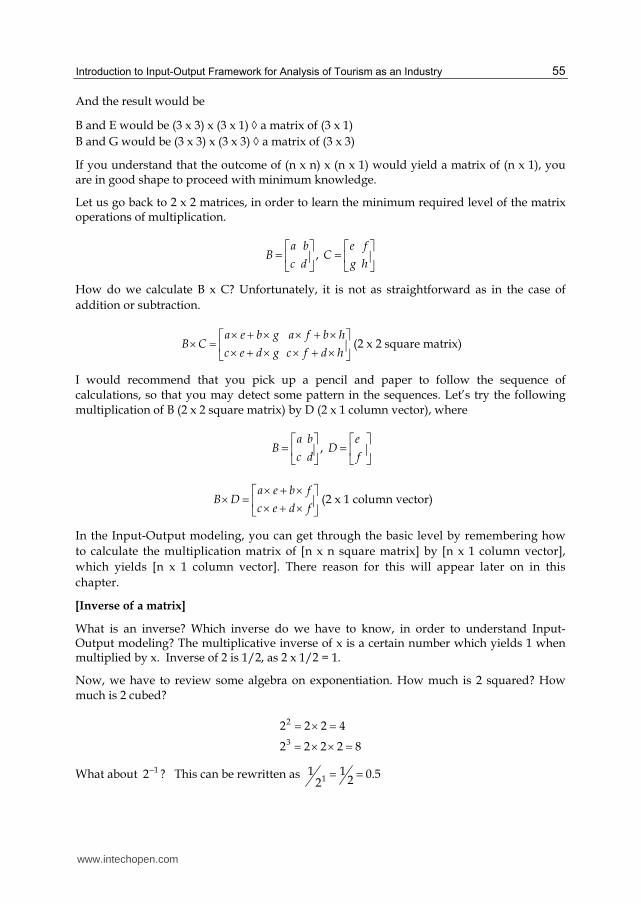
Let us go back to 2 x 2 matrices, in order to learn the minimum required level of the matrix operations of multiplication.
,a b e f
B Cc d g h
How do we calculate B x C? Unfortunately, it is not as straightforward as in the case of
addition or subtraction.
a e b g a f b hB C
c e d g c f d h
(2 x 2 square matrix)
I would recommend that you pick up a pencil and paper to follow the sequence of calculations, so that you may detect some pattern in the sequences. Let’s try the following multiplication of B (2 x 2 square matrix) by D (2 x 1 column vector), where
,a b e
B Dc d f
a e b f
B Dc e d f
(2 x 1 column vector)
In the Input-Output modeling, you can get through the basic level by remembering how
to calculate the multiplication matrix of [n x n square matrix] by [n x 1 column vector],
which yields [n x 1 column vector]. There reason for this will appear later on in this
chapter.
[Inverse of a matrix]
What is an inverse? Which inverse do we have to know, in order to understand Input-Output modeling? The multiplicative inverse of x is a certain number which yields 1 when multiplied by x. Inverse of 2 is 1/2, as 2 x 1/2 = 1.
Now, we have to review some algebra on exponentiation. How much is 2 squared? How much is 2 cubed?
2
3
2 2 2 4
2 2 2 2 8
What about 12 ? This can be rewritten as 11 1 0.522
www.intechopen.com

Visions for Global Tourism Industry – Creating and Sustaining Competitive Strategies
56
If 2 is multiplied by its inverse 0.5, 2 x 0.5 = 1
In the same manner, in a matrix notation, we can say that a square matrix A multiplied by
its inverse 1/A or should yield an “Identity Matrix”, which is the equivalent of 1 in matrix
operations.
The actual calculation of an inverse matrix looks more scary than the multiplication.
1 1, ,
a b d bA then A
c d c aa d b c
As you can see, a square matrix is not invertible if ad – bc = 0 In other words, when (a x d) minus (b x c) equals zero, you cannot calculate the inverse. So, you may want to make sure that ad – bc ≠ 0 before proceeding with other calculations.
Let’s look at one example. If we assume that:
1 4
1 3A
,
what is A-inverse?
1 3 4 3 4 3 41 1 1
1 1 1 1 1 11 3 4 1 3 4
d bA
c aa d b c
ad – bc = -1. In other words, it is possible to calculate the inverse of the A matrix.
By definition, A x A-inverse should yield an Identified Matrix (I-Matrix), which works like 1 in normal algebra, similar to the case where 2 x 1/2 = 1 (If a number is multiplied by its multiplicative inverse, the result will be 1). I-matrix is the matrix whose elements are all zeros, except those along the diagonal line from top left to bottom right. Let us verify this by multiplying A by A-inverse while you still recall how to multiply matrices.
1 1 4 3 4 1 3 4 1 1 4 4 1 1 0
1 3 1 1 1 3 3 1 1 4 3 1 0 1A A
When you calculate everything right with your pen and paper, you feel as if you had pulled out a beautiful pigeon (an I-Matrix) out of a hat. This also tells you that an I-Matrix is just like 1 in algebra. You are now ready for learning the I-O modeling. If you are not certain about what we did, please take the time to review the above section, as it is considered an absolute minimum, in order to understand I-O modeling.
2.2.2 Steps alternatively shown in matrix notations
Based on what we have learned so far, let us put down the process in simple matrix notations.
First of all, we will put down some notations. We use X to represent the total output. Total Output (X) consists of intermediate goods (AX: where 0 < A < 1), and Final Demand (Y). The equation (1) can be expressed as
www.intechopen.com
Introduction to Input-Output Framework for Analysis of Tourism as an Industry
57
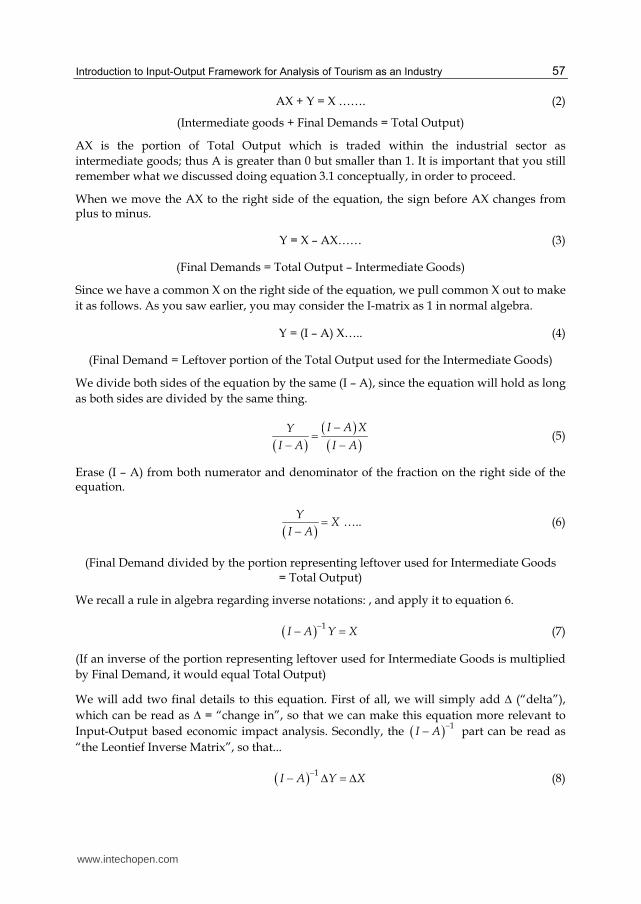
AX + Y = X ……. (2)
(Intermediate goods + Final Demands = Total Output)
AX is the portion of Total Output which is traded within the industrial sector as intermediate goods; thus A is greater than 0 but smaller than 1. It is important that you still remember what we discussed doing equation 3.1 conceptually, in order to proceed.
When we move the AX to the right side of the equation, the sign before AX changes from plus to minus.
Y = X – AX…… (3)
(Final Demands = Total Output – Intermediate Goods)
Since we have a common X on the right side of the equation, we pull common X out to make
it as follows. As you saw earlier, you may consider the I-matrix as 1 in normal algebra.
Y = (I – A) X….. (4)
(Final Demand = Leftover portion of the Total Output used for the Intermediate Goods)
We divide both sides of the equation by the same (I – A), since the equation will hold as long
as both sides are divided by the same thing.
I A XY
I A I A
(5)
Erase (I – A) from both numerator and denominator of the fraction on the right side of the equation.
YX
I A ….. (6)
(Final Demand divided by the portion representing leftover used for Intermediate Goods = Total Output)
We recall a rule in algebra regarding inverse notations: , and apply it to equation 6.
1I A Y X
(7)
(If an inverse of the portion representing leftover used for Intermediate Goods is multiplied
by Final Demand, it would equal Total Output)
We will add two final details to this equation. First of all, we will simply add ∆ (“delta”),
which can be read as ∆ = “change in”, so that we can make this equation more relevant to
Input-Output based economic impact analysis. Secondly, the 1I A
part can be read as
“the Leontief Inverse Matrix”, so that...
1I A Y X
(8)
www.intechopen.com
Visions for Global Tourism Industry – Creating and Sustaining Competitive Strategies
58
(Leontief Inverse Matrix multiplied by a change in Final Demand yields a change in Total Output)
These are the steps that we would take to reach the famous Leontief Inverse Matrix and
subsequent impact analyses.
Recall that the A is (0 < A < 1) and that I is like number 1. So the Leontief Inverse part
would be something bigger than 1. Now look at how the model can be applied to a
tourism setting.
If ∆Y is the growing amount of tourism expenditures in your region, then due to inter-industrial transactions expressed as a Leontief Inverse Matrix, the Total Output of each industrial sector would increase more than the increase in the amount of tourist expenditures. For example, if tourists book hotel rooms, more linen, shampoos, soaps, water, electricity must be purchased by the hotel. Does a tourist spend money only for a hotel room? Tourists use transport services, which means that more gas, oil, and tires will be used, together with gifts, refreshments, and meals. They consume more apple juice, which means that more apples and new empty bottles are required to meet the increased level of Final Demand for various output generated by tourist expenditures.
2.2.3 Simple examples of matrix operations for I-O modeling
Now that we have covered the conceptual and mathematical parts of the Input-Output
modeling, we can resume the matrix presentations of the tables. From the transaction table,
we will move step by step towards the Leontief Inverse Matrix, which will enable you to
calculate series of multipliers.
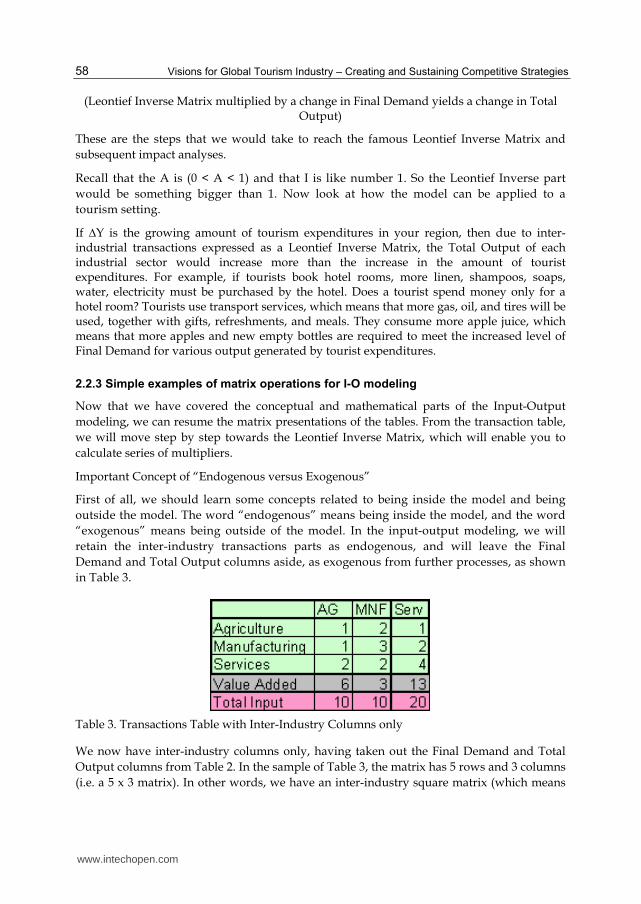
Important Concept of “Endogenous versus Exogenous”
First of all, we should learn some concepts related to being inside the model and being
outside the model. The word “endogenous” means being inside the model, and the word
“exogenous” means being outside of the model. In the input-output modeling, we will
retain the inter-industry transactions parts as endogenous, and will leave the Final
Demand and Total Output columns aside, as exogenous from further processes, as shown
in Table 3.
Table 3. Transactions Table with Inter-Industry Columns only
We now have inter-industry columns only, having taken out the Final Demand and Total
Output columns from Table 2. In the sample of Table 3, the matrix has 5 rows and 3 columns
(i.e. a 5 x 3 matrix). In other words, we have an inter-industry square matrix (which means
www.intechopen.com
Introduction to Input-Output Framework for Analysis of Tourism as an Industry
59
that the numbers of rows and columns are the same, such as a matrix of 3 x 3), the Value
Added row (labor, capital and others such as imports) and the Total Input rows which
consist of the sum of each column.
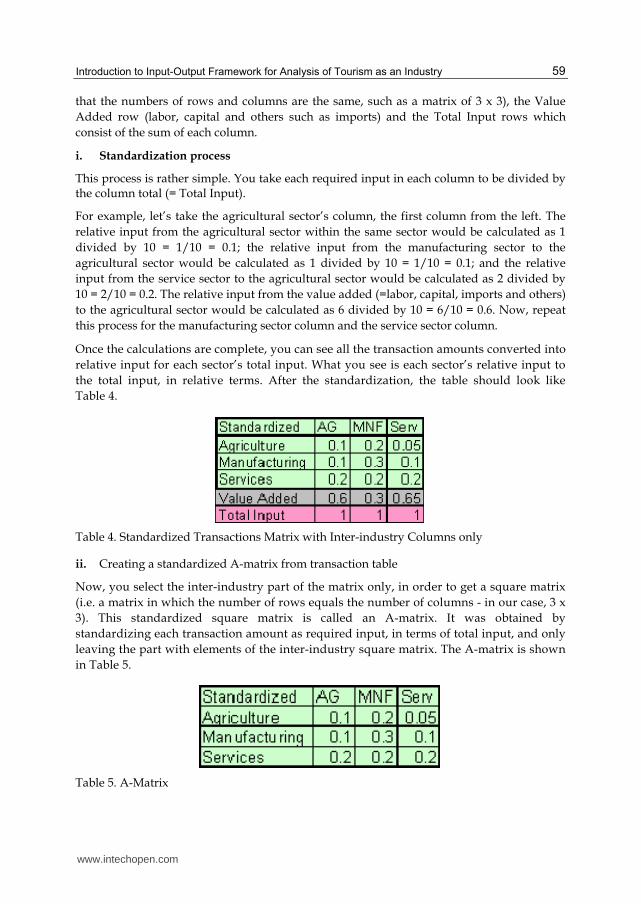
i. Standardization process
This process is rather simple. You take each required input in each column to be divided by the column total (= Total Input).
For example, let’s take the agricultural sector’s column, the first column from the left. The
relative input from the agricultural sector within the same sector would be calculated as 1
divided by 10 = 1/10 = 0.1; the relative input from the manufacturing sector to the
agricultural sector would be calculated as 1 divided by 10 = 1/10 = 0.1; and the relative
input from the service sector to the agricultural sector would be calculated as 2 divided by
10 = 2/10 = 0.2. The relative input from the value added (=labor, capital, imports and others)
to the agricultural sector would be calculated as 6 divided by 10 = 6/10 = 0.6. Now, repeat
this process for the manufacturing sector column and the service sector column.
Once the calculations are complete, you can see all the transaction amounts converted into
relative input for each sector’s total input. What you see is each sector’s relative input to
the total input, in relative terms. After the standardization, the table should look like
Table 4.
Table 4. Standardized Transactions Matrix with Inter-industry Columns only
ii. Creating a standardized A-matrix from transaction table
Now, you select the inter-industry part of the matrix only, in order to get a square matrix
(i.e. a matrix in which the number of rows equals the number of columns - in our case, 3 x
3). This standardized square matrix is called an A-matrix. It was obtained by
standardizing each transaction amount as required input, in terms of total input, and only
leaving the part with elements of the inter-industry square matrix. The A-matrix is shown
in Table 5.
Table 5. A-Matrix
www.intechopen.com
Visions for Global Tourism Industry – Creating and Sustaining Competitive Strategies
60
iii. Reviewing notation for matrix elements
Although we try to minimize the use of mathematical formulas, allow me to introduce a few
which may make our life easier. As you saw in the explanation of the standardization,
indicating the intersection between the agricultural sector row and the manufacturing sector
column, i.e. of 3rd row and 1st column, takes up a lot of space. We can use the small
subscript to be suffixed at the bottom, to display the relevant location in the matrix in the
order of rows and columns. Ideally, r and c as “rc” can be used but it is already common to
use “ij” to represent relative locations in row and column. By using the notation, the
processes of standardization can be expressed as
ijij
j
za
X (9)
This indicates that each standardized element in the A-matrix ija is calculated by having the
corresponding elements in the transaction matrix ijz divided by the column sum (= total
input) of the corresponding column jX . ijz represents each element in the transactions
table, i.e. the actual amount of transactions recorded in the transaction table, as shown in
table 3-2. For example, the cell where the service sector row intersects with the agricultural
sector column in the transaction table, or the element at the 3rd row, 1st column, can be
expressed simply as 31z , which is 2, and the 31a can be calculated by taking the ( = 2)
divided by the sum of the 1st column, which is the Total Input of the agricultural sector 1X
(=10), which is 0.2. Transaction tables are thus sometimes called Z-matrices.
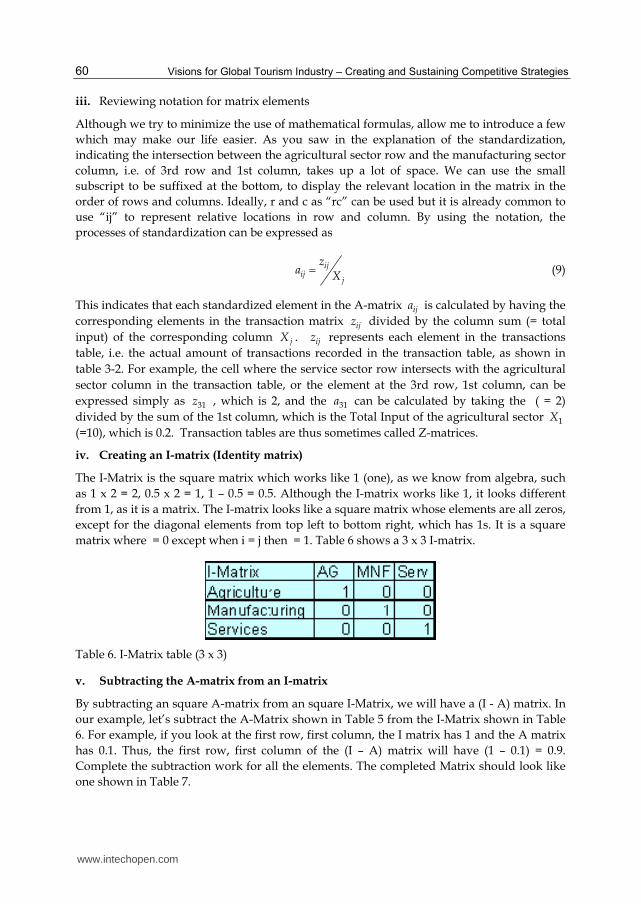
iv. Creating an I-matrix (Identity matrix)
The I-Matrix is the square matrix which works like 1 (one), as we know from algebra, such
as 1 x 2 = 2, 0.5 x 2 = 1, 1 – 0.5 = 0.5. Although the I-matrix works like 1, it looks different
from 1, as it is a matrix. The I-matrix looks like a square matrix whose elements are all zeros,
except for the diagonal elements from top left to bottom right, which has 1s. It is a square
matrix where = 0 except when i = j then = 1. Table 6 shows a 3 x 3 I-matrix.
Table 6. I-Matrix table (3 x 3)
v. Subtracting the A-matrix from an I-matrix
By subtracting an square A-matrix from an square I-Matrix, we will have a (I - A) matrix. In
our example, let’s subtract the A-Matrix shown in Table 5 from the I-Matrix shown in Table
6. For example, if you look at the first row, first column, the I matrix has 1 and the A matrix
has 0.1. Thus, the first row, first column of the (I – A) matrix will have (1 – 0.1) = 0.9.
Complete the subtraction work for all the elements. The completed Matrix should look like
one shown in Table 7.
www.intechopen.com

Introduction to Input-Output Framework for Analysis of Tourism as an Industry
61
Since this part is quite dense, even for a relatively small matrix (3 x 3), you are
recommended to refer to step 7 in the example shown in Figure 2, where you will learn how
to calculate the inverse matrix in MS-Excel. What you will be calculating here is the famous
Leontief Inverse Matrix, as shown in Table 8. For those who still wish to calculate the
inverse matrix of 3 x 3 by hand, or who did not suffer too much going through point 3.4.1,
the process can be found in any matrix algebra textbook, linear algebra textbook, or through
online resources such as Google, Yahoo etc. I will also post one possible calculation process
of 3 x 3 matrix inverse at the end of this chapter, as an appendix.
Table 7. (I –A)-Matrix
vi. Calculating an inverse of the (I – A) matrix to create Leontief inverse matrix
Table 8. Inverse of the (I – A) Matrix (Leontief Inverse Matrix)
vii. Using the Leontief Inverse Matrix: Simple Output Multiplier Analyses
Let’s put the Leontief Inverse Matrix into action. Recall the multiplication rule in matrix
algebra that when you have a (n x n) square matrix: it can only be multiplied by a suitable
matrix, i.e. one whose number of rows equals n. Also recall equation 3.8, according to which
a Leontief Inverse Matrix multiplied by a change in Final Demand yields a change in Total
Output. We can put the combined knowledge into action, as follows:
1I A Y X
(10)
(3 x 3) x (3 x 1) = (3 x 1)
(Leontief Inverse Matrix x Change in Final Demand = Change in Total Output)
By introducing the concept of incremental change, we can feed the model with the change in
final demand, to see how the economy responds with its total output. The change in final
demand is also called a shock, an initial shock, a direct shock, direct effect or direct impact.
Using the same industrial sectors in a row as in the Leontief Inverse Matrix, you have a (3 x
1) matrix. Since there is only one column, we can call this matrix as “a column-vector” or,
more specifically, “a final demand column vector”.
www.intechopen.com

Visions for Global Tourism Industry – Creating and Sustaining Competitive Strategies
62
Let’s conduct three cases in which we give a positive increase of 1 to each of the three
industrial sectors, one by one. In this case, the final demand column vector (numbers will be
shown as a column) would be as follows:
In Case 1, we assume that the final demand for the agricultural sector’s output is increased by 1 (if you prefer to put some meaning, say US$ 1 million, assuming the I-O transaction table was shown in US$ million units). In Case 2, we assume that the final demand for the manufacturing sector’s output is increased by 1, and in Case 3, we assume that the final demand for the services sector’s output is increased by 1.
Following this process, you can calculate the Leontief Inverse Matrix, and the last calculation in which you multiply the Leontief Inverse Matrix by a certain change in final demand , expressed in the column vector, will give you the change in total output.
Figure 1 Output Multipliers Calculations (Type-I)
We will learn how to interpret the results.
1I A Y X
(11)
(3 x 3) x (3 x 1) = (3 x 1)
(Leontief Inverse Matrix x change in Final Demand = change in Total Output)
The correct calculations would show the result as if you had just extracted each column of the three sectors, one by one. There was a special reason for using the positive 1 as change in Final Demand. Now, take the total output column vectors of each sector and sum up the numbers in the columns. The agricultural sector has 1.75, which means that a change in total output of the industrial sector will be of 1.75, if there is an increase in final demand for the agricultural sector for 1, thanks to your mastery of the required minimum level of matrix operations and series of rigorous calculations. You have an Output Multiplier of 1.75 for the agricultural sector. Repeat the same calculations for the manufacturing sector and the service sector, and you will have 2.40 and 1.66 respectively.
viii. Utilization of MS-Excel
All the process we conducted in this section can be reconstructed by using a spreadsheet
program, such as MS-Excel.
I have two recommendations to make in order to turn your newly acquired knowledge into
useful skills. First of all, practice basic sets of matrix operations in MS-Excel sheet called
“Minimum Knowledge of Matrix Operations for Tourism Industry Analysis” which I have
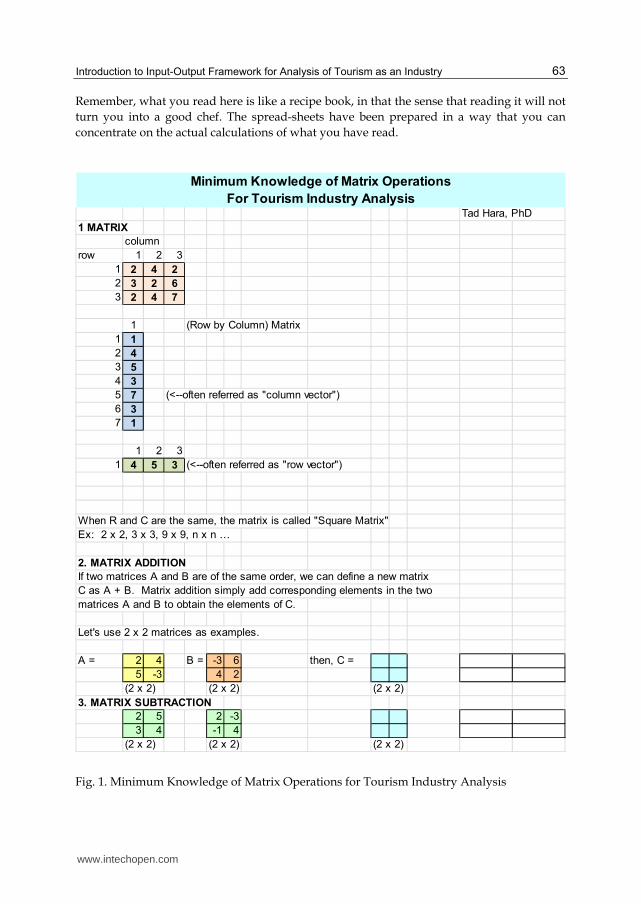
been using for the last 8 years in the classroom. The sheet is shown as Figure 1, but it is
important that you work with these sheets on your PC.
www.intechopen.com
Introduction to Input-Output Framework for Analysis of Tourism as an Industry
63
Remember, what you read here is like a recipe book, in that the sense that reading it will not
turn you into a good chef. The spread-sheets have been prepared in a way that you can
concentrate on the actual calculations of what you have read.
Tad Hara, PhD
1 MATRIX
column
row 1 2 3
1 2 4 2
2 3 2 6
3 2 4 7
1 (Row by Column) Matrix
1 1
2 4
3 5
4 3
5 7 (<--often referred as "column vector")
6 3
7 1
1 2 3
1 4 5 3 (<--often referred as "row vector")
When R and C are the same, the matrix is called "Square Matrix"
Ex: 2 x 2, 3 x 3, 9 x 9, n x n …
2. MATRIX ADDITION
If two matrices A and B are of the same order, we can define a new matrix
C as A + B. Matrix addition simply add corresponding elements in the two
matrices A and B to obtain the elements of C.
Let's use 2 x 2 matrices as examples.
A = 2 4 B = -3 6 then, C =
5 -3 4 2
(2 x 2) (2 x 2) (2 x 2)
3. MATRIX SUBTRACTION
2 5 2 -3
3 4 -1 4
(2 x 2) (2 x 2) (2 x 2)
Minimum Knowledge of Matrix Operations
For Tourism Industry Analysis
Fig. 1. Minimum Knowledge of Matrix Operations for Tourism Industry Analysis
www.intechopen.com

Visions for Global Tourism Industry – Creating and Sustaining Competitive Strategies
64
4. MATRIX MULTIPLICATION
A= 1 3 B= 2 4
2 0 1 3
(2 x 2) (2 x 2) (2 x 2)
(1x2)+(3x1) (1x4)+(3x3)
(2x2)+(0x1) (2x4)+(0x3)
UseExcel
1 Hightlight the target matrix space (2X2)
2 type formula [=mmult()], and move the cursor within the ( ).
3 click "array1" in the formula, highlight the first matrix, and type ",".
4 then click "array2" in the formula, highlight the second matrix.
5 WAIT!, before hitting enter, HOLD DOWN "CTRL" &
"SHIFT" KEYS TOGETHER, then hit the "ENTER" KEY.
Try with 3x3 square matrices!
Excel helps you greatly!
4 2 -4
A= 0 1 3
1 -1 2
(3x3)
1 3 2 How about A x B ?
B= -2 -2 2 (follow the procedures above)
1 2 -1
(3 x 3)
C =AxB=
(3 x 3)
One Rule: Matrix A is conformable to another matrix B only when the number
of columns of A is equal to the number of rows of B. Then the product AB has
the same number of rows as A and the same number of columns as B.
How about this way?--> (m x n) (n x p) are comformable (you can multiply them) when n = n.
Then the target matrix will be (m x p)
Ex: (3 x 3), (3 x 1) matrices--> yes they are comformable, and the answer will be (3 x 1)
(27 x 1) (1 x 3) matrices --> yes they are comformable, and the answer will be (27 x 3)
How about some examples?
2 4 2
A = 1 2 1
2 5 1
(3 x 3)
Fig. 1. Minimum Knowledge of Matrix Operations for Tourism Industry Analysis (continued)
www.intechopen.com
Introduction to Input-Output Framework for Analysis of Tourism as an Industry
65
1
B= 2 C = AB = ?
4 (3 x 3) (3 x 1) -->comformable, and the answer should be (3 x 1)
(3 x 1)
Again, let Excel help us.
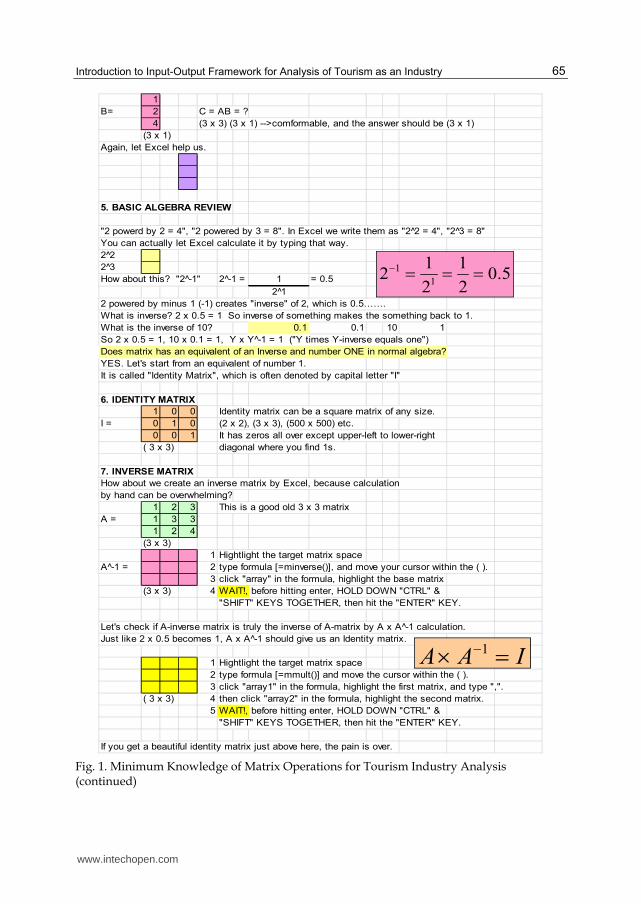
5. BASIC ALGEBRA REVIEW
"2 powerd by 2 = 4", "2 powered by 3 = 8". In Excel we write them as "2 2̂ = 4", "2 3̂ = 8"
You can actually let Excel calculate it by typing that way.
2^2
2^3
How about this? "2 -̂1" 2 -̂1 = 1 = 0.5
2 1̂
2 powered by minus 1 (-1) creates "inverse" of 2, which is 0.5…….
What is inverse? 2 x 0.5 = 1 So inverse of something makes the something back to 1.
What is the inverse of 10? 0.1 0.1 10 1
So 2 x 0.5 = 1, 10 x 0.1 = 1, Y x Y -̂1 = 1 ("Y times Y-inverse equals one")
Does matrix has an equivalent of an Inverse and number ONE in normal algebra?
YES. Let's start from an equivalent of number 1.
It is called "Identity Matrix", which is often denoted by capital letter "I"
6. IDENTITY MATRIX
1 0 0 Identity matrix can be a square matrix of any size.
I = 0 1 0 (2 x 2), (3 x 3), (500 x 500) etc.
0 0 1 It has zeros all over except upper-left to lower-right
( 3 x 3) diagonal where you find 1s.
7. INVERSE MATRIX
How about we create an inverse matrix by Excel, because calculation
by hand can be overwhelming?
1 2 3 This is a good old 3 x 3 matrix
A = 1 3 3
1 2 4
(3 x 3)
1 Hightlight the target matrix space
A -̂1 = 2 type formula [=minverse()], and move your cursor within the ( ).
3 click "array" in the formula, highlight the base matrix
(3 x 3) 4 WAIT!, before hitting enter, HOLD DOWN "CTRL" &
"SHIFT" KEYS TOGETHER, then hit the "ENTER" KEY.
Let's check if A-inverse matrix is truly the inverse of A-matrix by A x A -̂1 calculation.
Just like 2 x 0.5 becomes 1, A x A -̂1 should give us an Identity matrix.
1 Hightlight the target matrix space
2 type formula [=mmult()] and move the cursor within the ( ).
3 click "array1" in the formula, highlight the first matrix, and type ",".
( 3 x 3) 4 then click "array2" in the formula, highlight the second matrix.
5 WAIT!, before hitting enter, HOLD DOWN "CTRL" &
"SHIFT" KEYS TOGETHER, then hit the "ENTER" KEY.
If you get a beautiful identity matrix just above here, the pain is over.
5.02
1
2
12
1
1
IAA 1
Fig. 1. Minimum Knowledge of Matrix Operations for Tourism Industry Analysis (continued)
www.intechopen.com
Visions for Global Tourism Industry – Creating and Sustaining Competitive Strategies
66
2.4 Multiplier calculations in the I-O framework
While the popularity of an economic impact study and the proliferation of its jargon seems
to require no further marketing, there are by far fewer people who can actually calculate the
necessary process of impact studies than people who talk about them. It would benefit you
to understand the process of calculations in order to become a better consumer. In the
future, you may work for a tourism organization which outsources such studies to outside
consultants; however, if you are familiar with the process, you are likely to ask the right
questions on various assumptions hidden behind fancy reports, based on your knowledge
of I-O modeling.
2.4.1 Multiplier calculations
You may have heard of the word “multiplier”. However, this calls for a word of caution, as
there are various types of multipliers. Unless you calculate them by yourself, or know
precisely which multiplier is being discussed, a mere comparison of extracted multipliers
across results of different impact studies carried out by different researchers will be
misleading. In this section we look at some of the various multipliers.
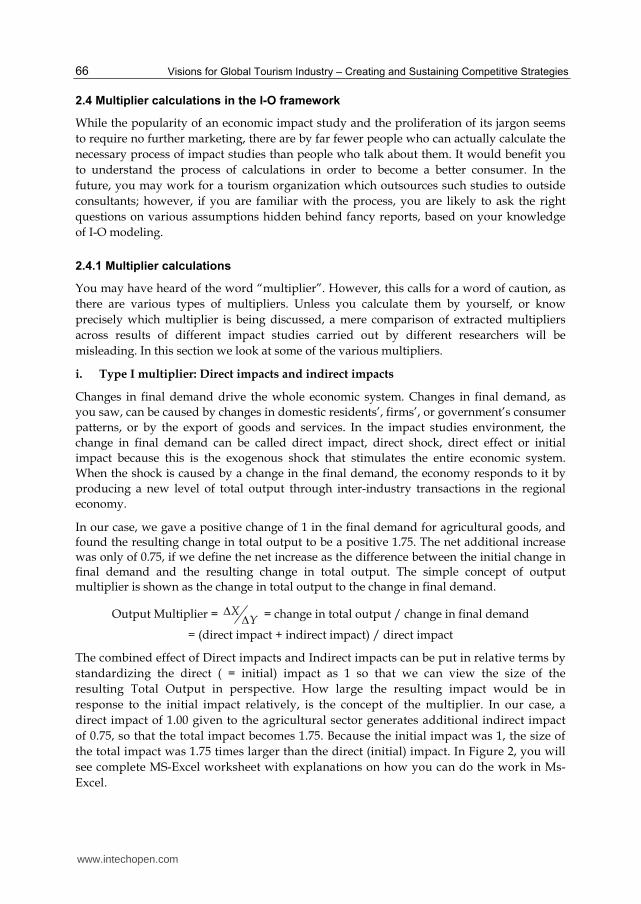
i. Type I multiplier: Direct impacts and indirect impacts
Changes in final demand drive the whole economic system. Changes in final demand, as you saw, can be caused by changes in domestic residents’, firms’, or government’s consumer patterns, or by the export of goods and services. In the impact studies environment, the change in final demand can be called direct impact, direct shock, direct effect or initial impact because this is the exogenous shock that stimulates the entire economic system. When the shock is caused by a change in the final demand, the economy responds to it by producing a new level of total output through inter-industry transactions in the regional economy.
In our case, we gave a positive change of 1 in the final demand for agricultural goods, and found the resulting change in total output to be a positive 1.75. The net additional increase was only of 0.75, if we define the net increase as the difference between the initial change in final demand and the resulting change in total output. The simple concept of output multiplier is shown as the change in total output to the change in final demand.
Output Multiplier = XY
= change in total output / change in final demand
= (direct impact + indirect impact) / direct impact
The combined effect of Direct impacts and Indirect impacts can be put in relative terms by
standardizing the direct ( = initial) impact as 1 so that we can view the size of the
resulting Total Output in perspective. How large the resulting impact would be in
response to the initial impact relatively, is the concept of the multiplier. In our case, a
direct impact of 1.00 given to the agricultural sector generates additional indirect impact
of 0.75, so that the total impact becomes 1.75. Because the initial impact was 1, the size of
the total impact was 1.75 times larger than the direct (initial) impact. In Figure 2, you will
see complete MS-Excel worksheet with explanations on how you can do the work in Ms-
Excel.
www.intechopen.com

Introduction to Input-Output Framework for Analysis of Tourism as an Industry
67
AG MNF Serv FD
Total
Output
Agriculture
1 Manufacturing
Services
Value Added
Total Input
AG MNF Serv FD
Total
Output
Agriculture 1 2 1 6 10
2 Manufacturing 1 3 2 4 10
Services 2 2 4 12 20
Value Added 6 3 13
Total Input 10 10 20
AG MNF Serv
Agriculture 1 2 1
3 Manufacturing 1 3 2
Services 2 2 4
Value Added 6 3 13
Total Input 10 10 20
Standardized AG MNF Serv
Agriculture 0.1 0.2 0.05
Manufacturing 0.1 0.3 0.1
4 Services 0.2 0.2 0.2
Value Added 0.6 0.3 0.65
Total Input 1 1 1
Standardized AG MNF Serv
Agriculture 0.1 0.2 0.05 =A-Matrix
5 Manufacturing 0.1 0.3 0.1
Services 0.2 0.2 0.2
I-Matrix AG MNF Serv
6 Agriculture 1 0 0 =I-matrix
Manufacturing 0 1 0
Services 0 0 1
(I-A) AG MNF Serv
7 Agriculture 0.9 -0.2 -0.1 =(I-A)
Manufacturing -0.1 0.7 -0.1
Services -0.2 -0.2 0.8
Introduction to "Input-Output Model" for Tourism Industry Analysis
1. This is the basic
structure of I-O.
2. We fill in the data based on the macro-
economic data. Often the statistics
office of the regional/ state/ national
government publish these data, even
the I-O itself.
3. Here, we pick up the whole column under industry columns.
Now you see 3 x 3 inter-industry matrix, and below it, Value-
added (labor,capital & others) and the Total Input. At this
stage, you may forget about Value Added. (We will study
them when we move to SAM)
4. Here, look at the table above. You take each entry
within the inter-industry matrix and divide them by the
column sum. Repeat for all cells in the inter-industry
matrix Then the calculation will look like this.
5. Take out the Inter-Industry matrix.
This is called "A-matrix". You are now
ready to start your magic step by step!
6. This matrix, with all zeros except along the
upper-left~lower-right diagonal line with 1s, is
called "I-matrix" (sounds "eye"-matrix). Do not
worry, this matrix has the same role as 1 (one) in
normal algebra.
7. Follow the formula and let's work on (I-A).
Simply subtract A-matrix from our newly
created I-matrix.
Fig. 2. MS-Excel Practice Sheet for I-O Modeling
www.intechopen.com
Visions for Global Tourism Industry – Creating and Sustaining Competitive Strategies
68
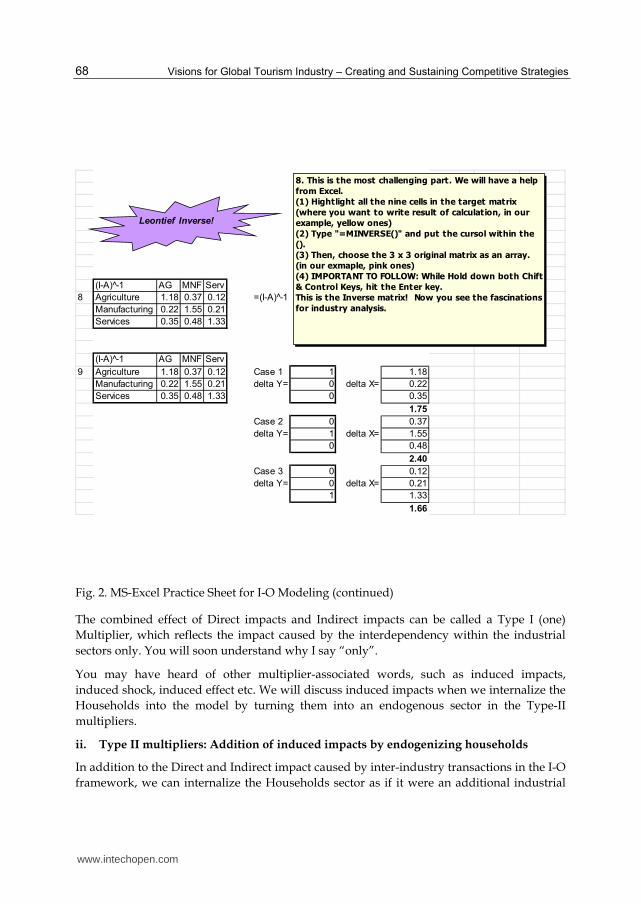
(I-A) -̂1 AG MNF Serv
8 Agriculture 1.18 0.37 0.12 =(I-A) -̂1
Manufacturing 0.22 1.55 0.21
Services 0.35 0.48 1.33
(I-A) -̂1 AG MNF Serv
9 Agriculture 1.18 0.37 0.12 Case 1 1 1.18
Manufacturing 0.22 1.55 0.21 delta Y= 0 delta X= 0.22
Services 0.35 0.48 1.33 0 0.35
1.75
Case 2 0 0.37
delta Y= 1 delta X= 1.55
0 0.48
2.40
Case 3 0 0.12
delta Y= 0 delta X= 0.21
1 1.33
1.66
Leontief Inverse!
8. This is the most challenging part. We will have a help
from Excel.
(1) Hightlight all the nine cells in the target matrix
(where you want to write result of calculation, in our
example, yellow ones)
(2) Type "=MINVERSE()" and put the cursol within the
().
(3) Then, choose the 3 x 3 original matrix as an array.
(in our exmaple, pink ones)
(4) IMPORTANT TO FOLLOW: While Hold down both Chift
& Control Keys, hit the Enter key.
This is the Inverse matrix! Now you see the fascinations
for industry analysis.
Fig. 2. MS-Excel Practice Sheet for I-O Modeling (continued)
The combined effect of Direct impacts and Indirect impacts can be called a Type I (one)
Multiplier, which reflects the impact caused by the interdependency within the industrial
sectors only. You will soon understand why I say “only”.
You may have heard of other multiplier-associated words, such as induced impacts,
induced shock, induced effect etc. We will discuss induced impacts when we internalize the
Households into the model by turning them into an endogenous sector in the Type-II
multipliers.
ii. Type II multipliers: Addition of induced impacts by endogenizing households
In addition to the Direct and Indirect impact caused by inter-industry transactions in the I-O
framework, we can internalize the Households sector as if it were an additional industrial
www.intechopen.com

Introduction to Input-Output Framework for Analysis of Tourism as an Industry
69
sector, at the bottom of the rows and at the end of the columns of the I-O table. The
Households’ row will then provide their goods and services (such as labor) into each
industrial sector, in exchange for receipt of money (income), and the Households’ sector in
the column will spend some part of its income to purchase output from industrial sector, as
necessary input to ensure its existence. This will generate additional monetary flow towards
the inter-industry table. While this still falls short of a complete inclusion of all economic
transactions within a region or nation, including Households in the I-O structure will yield
extra impact, thanks to their additional purchasing activities. An example of the structure is
shown in Table 9.
Table 9. A-matrix with Households as an additional industrial sector
If you look at the rows, you see the Household row at the bottom as if it were another
industrial sector. If you look at the columns, you can see Households (PCE). PCE stands for
personal consumption expenditures, which means that Households will spend some portion
of their received income to purchase other industrial sector’s output. Because of the addition
of another sector, the Output Multiplier would be higher.
Type I multipliers are group of multipliers which are based on the usage of the generic
structure of the I-O model, without any other non-industrial sector, while Type II
multipliers are group of multipliers which utilize the I-O, while including Households as an
additional quasi-industrial sector. Type I and Type II distinguish the structure of the I-O
being used to calculate several multipliers, as follows. Besides Output Multipliers, which
can be calculated in a Type I or Type II environment (using the typical I-O or the I-O
including Households), there are other multipliers which can be calculated along Type-I and
Type-II structures.
2.5 Structural limitations of the I-O modeling
As it is the case with any other quantitative modeling, the I-O modeling has its limitations
due to its structural design. Knowing its limitations will keep your study within reasonable
limits and make you prepared to a series of possible criticism of its limitations, which are as
follows:
Homogeneous sector output
If the sector produces more than one commodity, the proportion of such multiple
commodities productions will remain the same as in the study period. As an example of the
www.intechopen.com
Visions for Global Tourism Industry – Creating and Sustaining Competitive Strategies
70
hospitality industry, let’s look at a full-service hotel. They have rooms department and food
and beverage department as core department to generate their products, clean rooms and
tasty meals. The proportion of those products is not assumed to change, which means that if
the proportion was 70% and 30%, then when the total revenue at the hotel increased from $100
million to $150 million, the sales of two departments are assumed to increase from $70
million and $30 million to $105 million to $45 million as the relative ratio of proportions are
fixed.
Fixed commodity input structure
Similar to Constant Returns to Scale, the ratio of inputs is assumed to remain the same as it
was observed in the study period, irrespective of changes in price of some items. In the real
world, if the price of furniture from China becomes so attractive, a general manger of a hotel
in the Unites States may switch to purchase those instead of those from domestic
manufacturing industry in Illinois. If the price of turkey skyrockets for some reason, you
may find less turkey dishes at the restaurant. Increase in prices would not cause a huge
technical problem for the I-O modelers if the change in prices of goods and services are
equally distributed all across the society. That is often not the case, such as the surge of
crude oil prices. In the I-O world, exact mixture of intermediate goods will remain fixed
despite short-term price fluctuations.
Constant return to scale
The required input can be put in relative terms as ratios, as we did when transforming the
transaction table into the standardized A-Matrix table. That relationship is assumed to
continue. If the apple juice factory’s input from the agricultural sector is 0.12, when the total
output increases by $1 million, there should be an additional purchase of $0.12 million of
agricultural product (apples). If the increase in total output is of $100, there should be a $12
additional purchase of apples. The relationship is assumed to remain linear.
No assumption on supply constraints
The I-O modeling assumes that the required input is always available without constraints in
supply. You can, for example conduct a study of what would happen to a local economy if
the number of customers to a popular tourist destination - an ice-cream factory - were to
triple in the following year. The model calculates that the required input of sugar, milk, and
electricity will increase dramatically, which would stimulate the local economy through
industrial interdependency. The model will not ask you whether there will be enough
machines in the factory or enough parking spaces and seats for the tourists in that situation,
because it will not make any assumption about capacity constraints.
In general, a shock of relatively small changes to the economy in question would have less
of a problem, and a shock to relatively larger economic region would create fewer problems
in the impact analysis using the I-O framework. Being aware of those structural limitations,
mainly deriving from being linear-modeling techniques, you may as well present your
arguments in perspective without misleading audiences and readers. It goes without saying
that these are not the all limitations of your particular study, as there may be errors that are
more specific and applicable to your research in question.
www.intechopen.com

Introduction to Input-Output Framework for Analysis of Tourism as an Industry
71
2.6 Final remarks
We covered the basic of how the Input-Output model works. The knowledge of how it works will help you understand how the extended models such as Social Accounting Matrix (SAM) functions, and helps you to understand Tourism Satellite Accounts.
The very basic concept you should understand can be depicted in simple visible figure, as shown in figure 3.
When you deal with tourism related economic impact studies, the final demand column
vector should represent “all the money tourists spent in the study region” in the form of
column vector (n x 1), where n is the number of industrial sectors in the study region’s
Input-Output data. Because of the tourists’ expenditure over multiple industrial outputs, the
final demand column vector will typically have numbers in multiple cells, implying that the
tourists’ expenditure stimulates various industrial sectors in the economy in question. Now
we are prepared to proceed to study about Tourism Satellite Accounts.
Fig. 3. Basic Concept of the Simplified Economic Impact Studies
3. References
Duchin, Faye. Structural Economics. Washington D.C.: Island Press, 1998.
Hara, Tadayuki. Quantitative Tourism Industry Analysis: Elsevier, London, ISBN 978-0-
7506-8499-6, 2008
Isard, Walter, and Robert Kuenne. "The Impact of Steel Upon the Greater New York-
Philadelphia Industrial Region." The Review of Economics and Statistics XXXV, no.
November (1953): 289-301.
Leontief, Wassily. The Structure of American Economy 1919-1939 New York: Oxford
University Press, 1951
LOCAL ECONOMY (FIXED) x EXOGENOUS SHOCK = RESPONSE OF THE TOTAL OUTPUT
(change in final demand) (change in total output)
(I-A) -̂1 AG MNF Serv ∆Y (FD) ∆X (TO)
Agriculture 1.179 0.371 0.120 1 1.18
Manufacturing 0.218 1.550 0.207 x delta Y= 0 = delta X= 0.22
Services 0.349 0.480 1.332 0 0.35
(Leontief Inverse Matrix) (FD column vector) 1.751 became 1.75, so the multiplier = 1.75
BASIC CONCEPT OF THE ECONOMIC IMPACT STUDIES
www.intechopen.com

Visions for Global Tourism Industry – Creating and Sustaining Competitive Strategies
72
Quesnay, F. ""Tableau Economique" 1758, in Appendix Of "The Disaggregation of the
Household Sector in the National Accounts" By Sir Richard Stone in 1985." In Social
Accounting Matrices a Basis for Planning, edited by Graham Pyatt and Jefferey I.
Round, 281. Washington D.C.: The World Bank,
www.intechopen.com

Visions for Global Tourism Industry - Creating and SustainingCompetitive StrategiesEdited by Dr. Murat Kasimoglu
ISBN 978-953-51-0520-6Hard cover, 478 pagesPublisher InTechPublished online 18, April, 2012Published in print edition April, 2012
InTech EuropeUniversity Campus STeP Ri Slavka Krautzeka 83/A 51000 Rijeka, Croatia Phone: +385 (51) 770 447 Fax: +385 (51) 686 166www.intechopen.com
InTech ChinaUnit 405, Office Block, Hotel Equatorial Shanghai No.65, Yan An Road (West), Shanghai, 200040, China
Phone: +86-21-62489820 Fax: +86-21-62489821
We have been witnessing huge competition among the organisations in the business world. Companies,NGO's and governments are looking for innovative ways to compete in the global tourism market. In theclassical literature of business the main purpose is to make a profit. However, if purpose only focus on theprofit it will not to be easy for them to achieve. Nowadays, it is more important for organisations to discoverhow to create a strong strategy in order to be more competitive in the marketplace. Increasingly, organisationshave been using innovative approaches to strengthen their position. Innovative working enables organisationsto make their position much more competitive and being much more value-orientated in the global tourismindustry. In this book, we are pleased to present many papers from all over the world that discuss the impactof tourism business strategies from innovative perspectives. This book also will help practitioners andacademician to extend their vision in the light of scientific approaches.
How to referenceIn order to correctly reference this scholarly work, feel free to copy and paste the following:
Tadayuki (Tad) Hara (2012). Introduction to Input-Output Framework for Analysis of Tourism as an Industry,Visions for Global Tourism Industry - Creating and Sustaining Competitive Strategies, Dr. Murat Kasimoglu(Ed.), ISBN: 978-953-51-0520-6, InTech, Available from: http://www.intechopen.com/books/visions-for-global-tourism-industry-creating-and-sustaining-competitive-strategies/input-output-modeling-as-a-tool-for-measurement-of-economic-impacts-of-tourism-as-an-industry

© 2012 The Author(s). Licensee IntechOpen. This is an open access articledistributed under the terms of the Creative Commons Attribution 3.0License, which permits unrestricted use, distribution, and reproduction inany medium, provided the original work is properly cited.