Embed Size (px)
DESCRIPTION
Introduction to Economics. Macroeconomics The US Economy. Quiz: Median = 32. Outline. Economics in the News Review of Chapters 20, 21, and 24 The banking system and the Federal Reserve Monetary Policy: Does the Fed get the timing right?. Conference Board. - PowerPoint PPT Presentation
Citation preview
Llad Phillips 1
Introduction to EconomicsIntroduction to Economics
MacroeconomicsMacroeconomics
The US EconomyThe US Economy
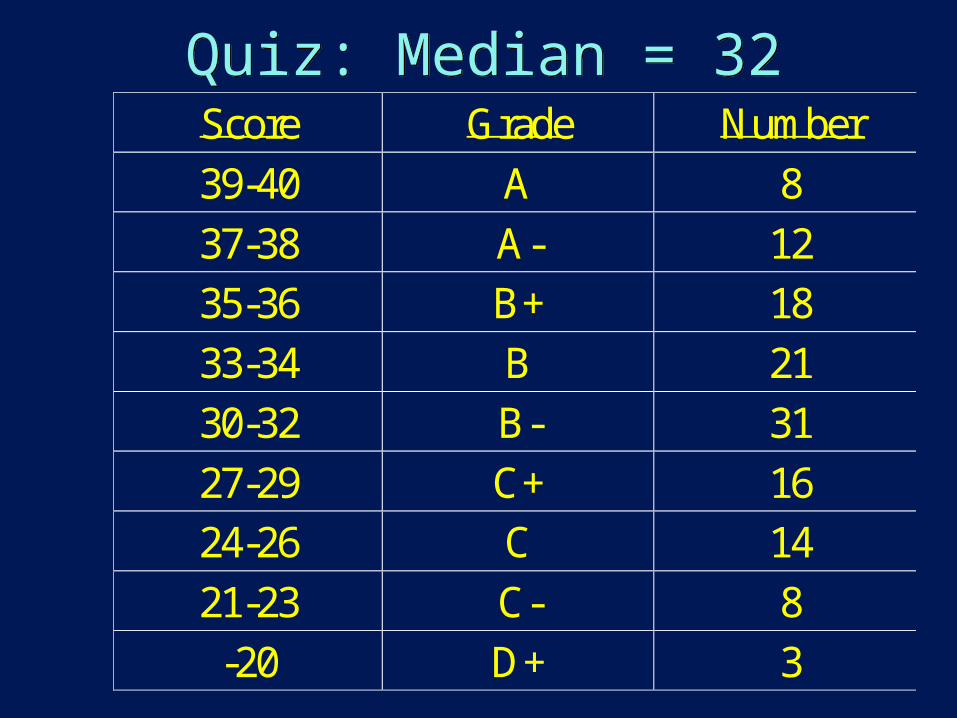
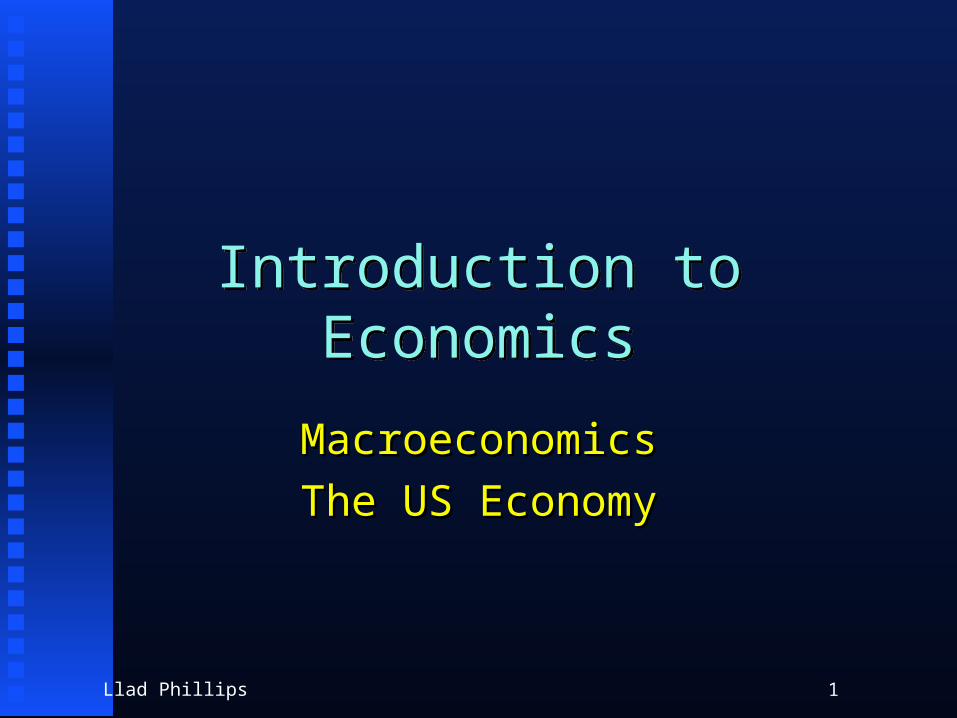
Quiz: Median = 32Quiz: Median = 32Score Grade Number
39-40 A 8
37-38 A- 12
35-36 B+ 18
33-34 B 21
30-32 B- 31
27-29 C+ 16
24-26 C 14
21-23 C- 8
-20 D+ 3
Llad Phillips 3
OutlineOutline Economics in the NewsEconomics in the News Review of Chapters 20, 21, and 24Review of Chapters 20, 21, and 24 The banking system and the Federal ReserveThe banking system and the Federal Reserve Monetary Policy: Does the Fed get the timing Monetary Policy: Does the Fed get the timing
right?right?
Llad Phillips 4
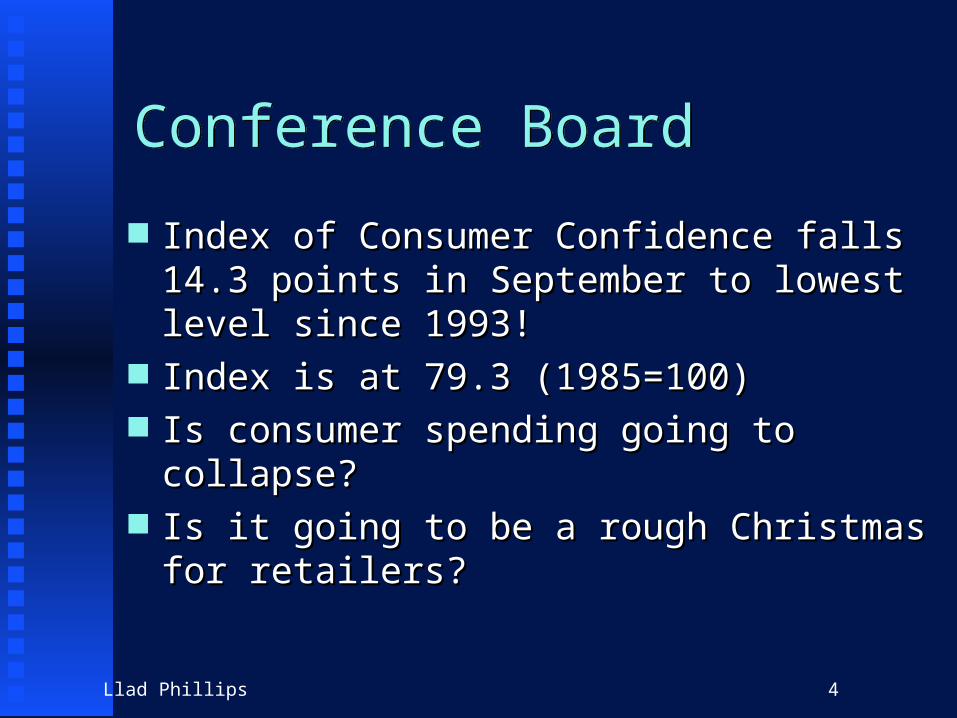
Conference BoardConference Board
Index of Consumer Confidence falls 14.3 Index of Consumer Confidence falls 14.3 points in September to lowest level since points in September to lowest level since 1993!1993!
Index is at 79.3 (1985=100)Index is at 79.3 (1985=100) Is consumer spending going to collapse?Is consumer spending going to collapse? Is it going to be a rough Christmas for Is it going to be a rough Christmas for
retailers?retailers?
Llad Phillips 5
Impact of the Business Cycle on the Public Sector
Impact of the Business Cycle on the Public Sector
The University of CaliforniaThe University of California
Llad Phillips 6
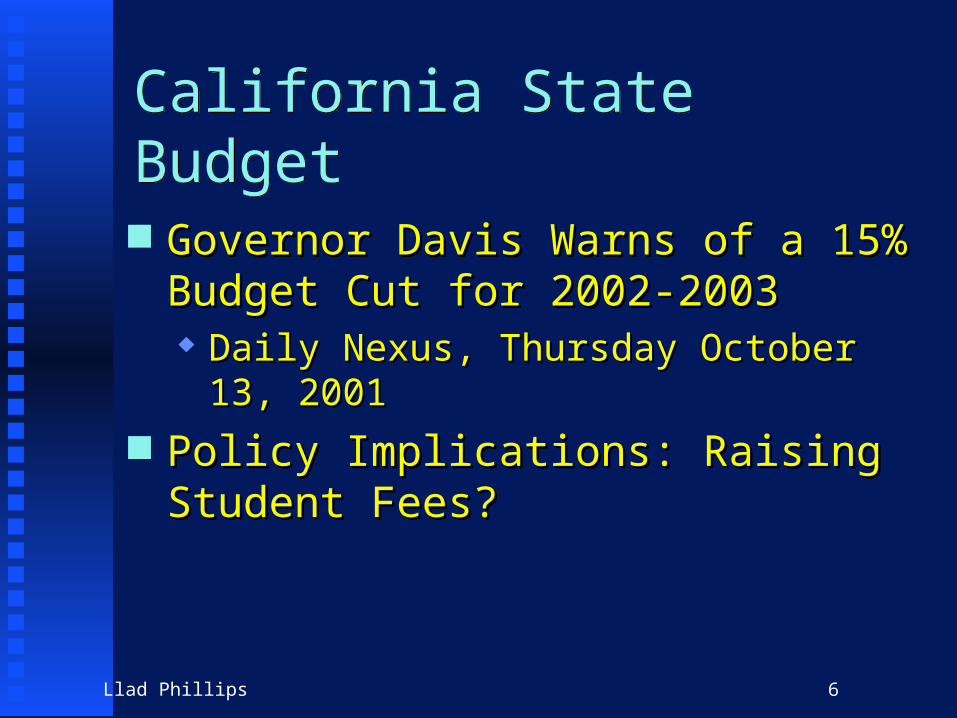
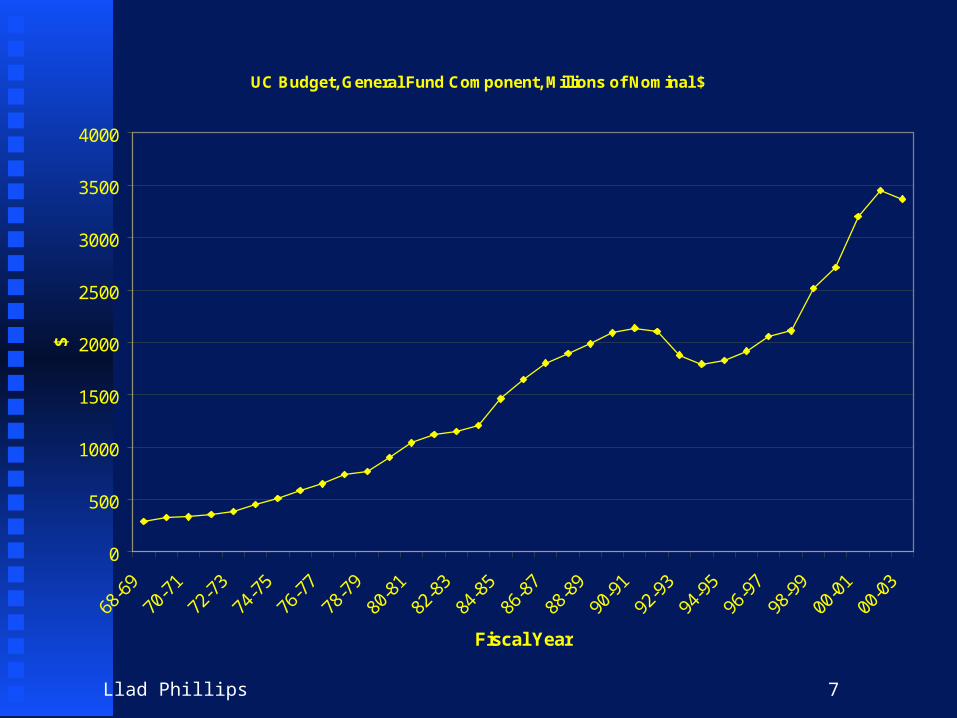
California State BudgetCalifornia State Budget
Governor Davis Warns of a 15% Budget Governor Davis Warns of a 15% Budget Cut for 2002-2003Cut for 2002-2003 Daily Nexus, Thursday October 13, 2001Daily Nexus, Thursday October 13, 2001
Policy Implications: Raising Student Fees?Policy Implications: Raising Student Fees?
Llad Phillips 7
UC Budget, General Fund Component, Millions of Nominal $
0
500
1000
1500
2000
2500
3000
3500
4000
68-6
9
70-7
1
72-7
3
74-7
5
76-7
7
78-7
9
80-8
1
82-8
3
84-8
5
86-8
7
88-8
9
90-9
1
92-9
3
94-9
5
96-9
7
98-9
9
00-0
1
00-0
3
Fiscal Year
$
Llad Phillips 8
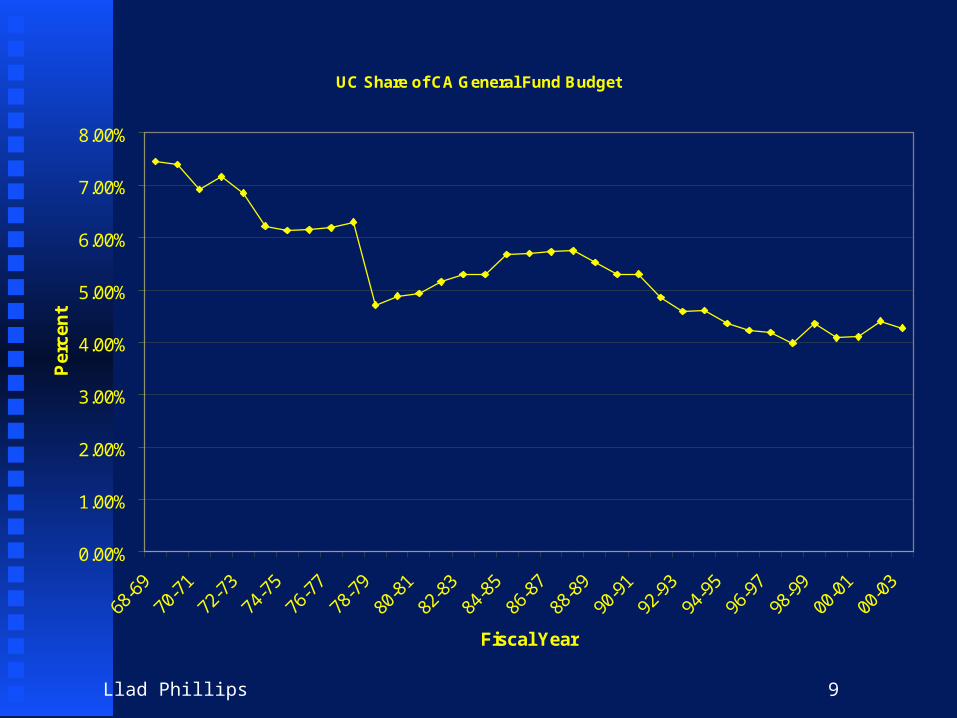
How has UC Fared Over Time?How has UC Fared Over Time?
Does UC get a fair share of state money?Does UC get a fair share of state money? UC Budget Share = UC Budget/CA Gen FundUC Budget Share = UC Budget/CA Gen Fund
Llad Phillips 9
UC Share of CA General Fund Budget
0.00%
1.00%
2.00%
3.00%
4.00%
5.00%
6.00%
7.00%
8.00%
68-6
9
70-7
1
72-7
3
74-7
5
76-7
7
78-7
9
80-8
1
82-8
3
84-8
5
86-8
7
88-8
9
90-9
1
92-9
3
94-9
5
96-9
7
98-9
9
00-0
1
00-0
3
Fiscal Year
Per
cen
t
Llad Phillips 10
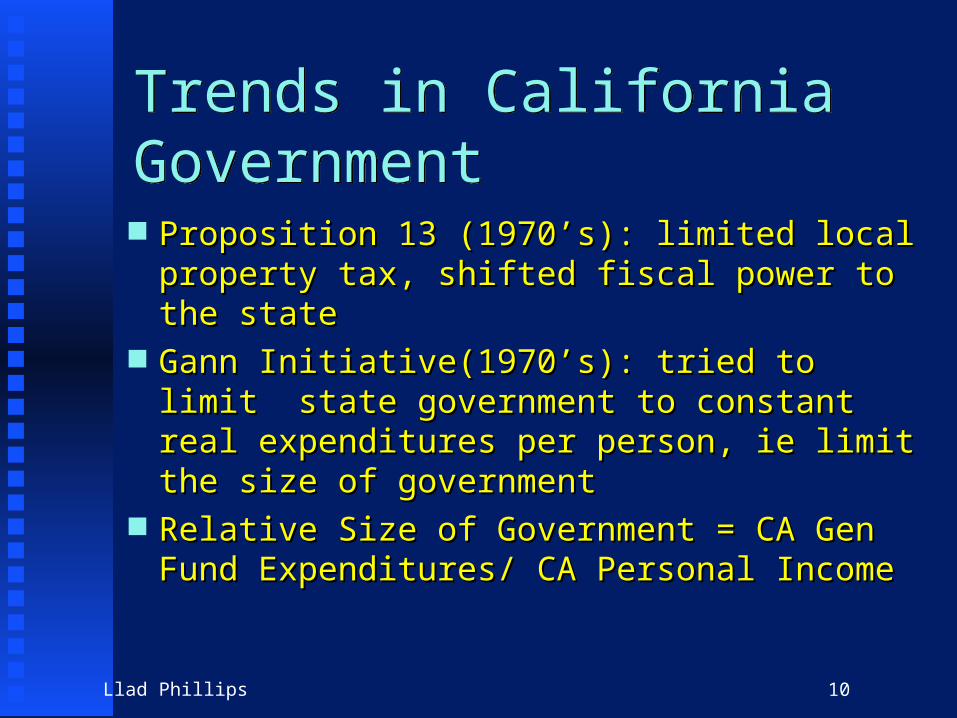
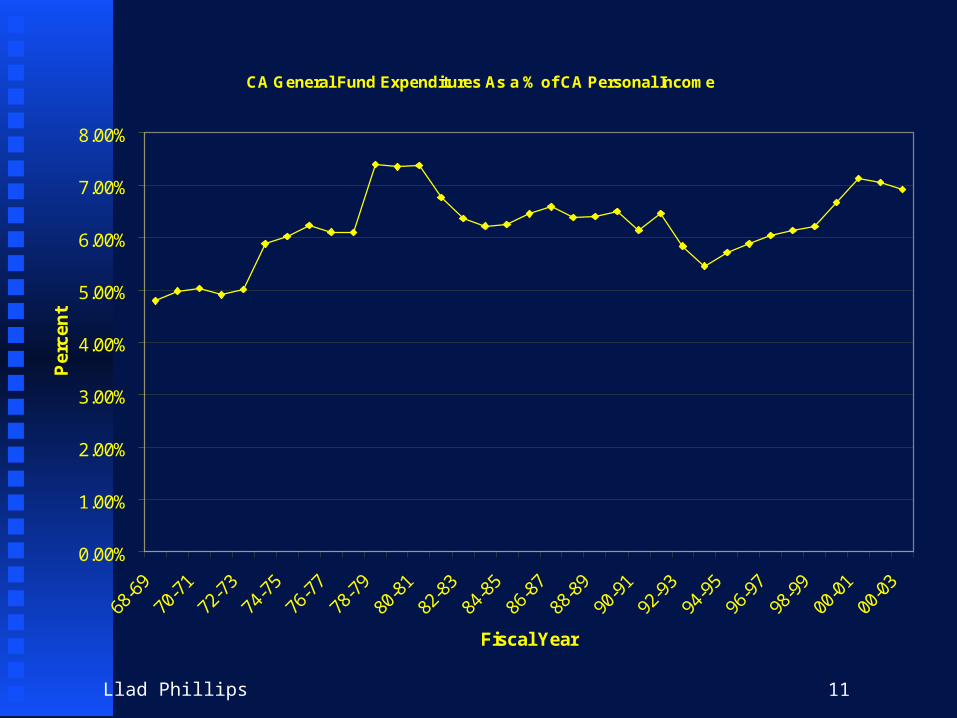
Trends in California GovernmentTrends in California Government
Proposition 13 (1970’s): limited local Proposition 13 (1970’s): limited local property tax, shifted fiscal power to the stateproperty tax, shifted fiscal power to the state
Gann Initiative(1970’s): tried to limit state Gann Initiative(1970’s): tried to limit state government to constant real expenditures government to constant real expenditures per person, ie limit the size of governmentper person, ie limit the size of government
Relative Size of Government = CA Gen Relative Size of Government = CA Gen Fund Expenditures/ CA Personal IncomeFund Expenditures/ CA Personal Income
Llad Phillips 11
CA General Fund Expenditures As a % of CA Personal Income
0.00%
1.00%
2.00%
3.00%
4.00%
5.00%
6.00%
7.00%
8.00%
68-6
9
70-7
1
72-7
3
74-7
5
76-7
7
78-7
9
80-8
1
82-8
3
84-8
5
86-8
7
88-8
9
90-9
1
92-9
3
94-9
5
96-9
7
98-9
9
00-0
1
00-0
3
Fiscal Year
Per
cen
t
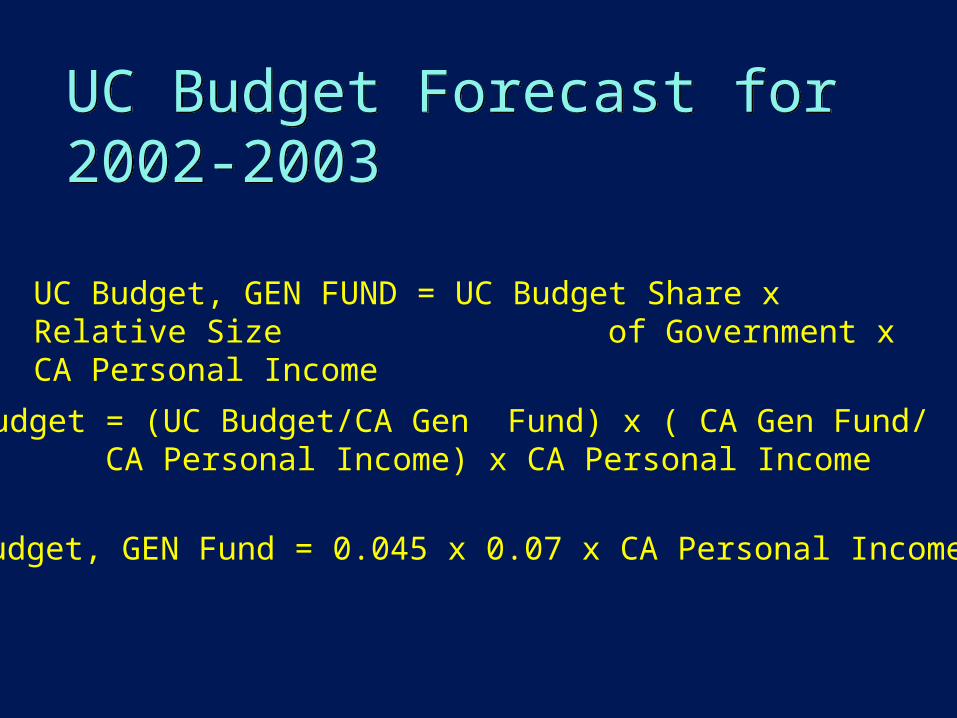
UC Budget Forecast for 2002-2003UC Budget Forecast for 2002-2003
UC Budget, GEN FUND = UC Budget Share x Relative Size of Government x CA Personal Income
UC Budget = (UC Budget/CA Gen Fund) x ( CA Gen Fund/CA Personal Income) x CA Personal Income
UC Budget, GEN Fund = 0.045 x 0.07 x CA Personal Income
Llad Phillips 13
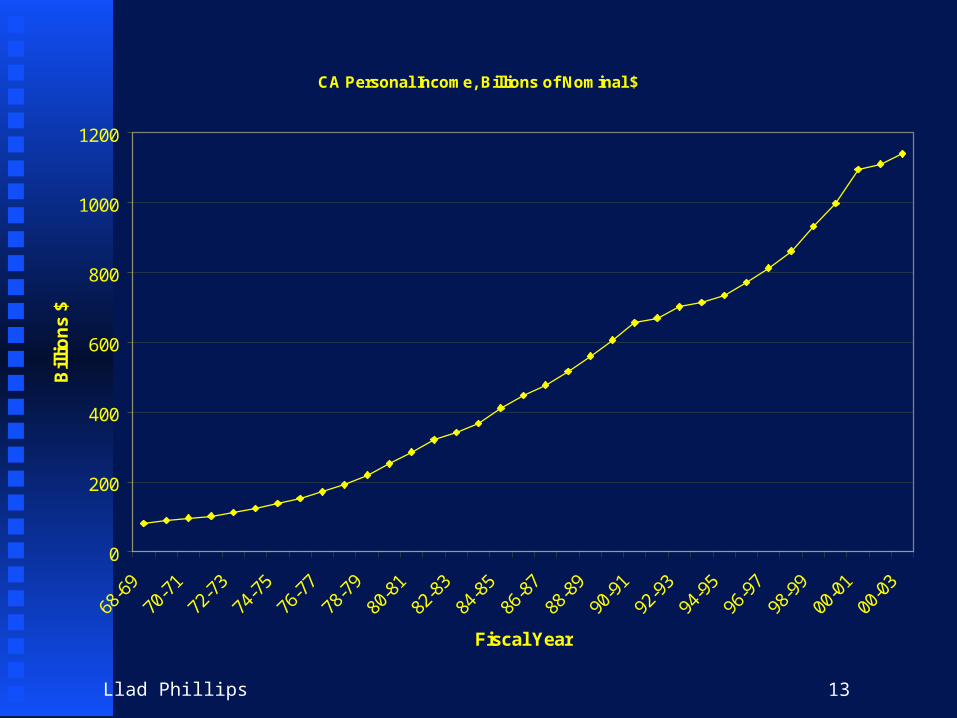
CA Personal Income, Billions of Nominal $
0
200
400
600
800
1000
1200
68-6
9
70-7
1
72-7
3
74-7
5
76-7
7
78-7
9
80-8
1
82-8
3
84-8
5
86-8
7
88-8
9
90-9
1
92-9
3
94-9
5
96-9
7
98-9
9
00-0
1
00-0
3
Fiscal Year
Bill
ion
s $
Llad Phillips 14
Chapter 20Chapter 20
Llad Phillips 15
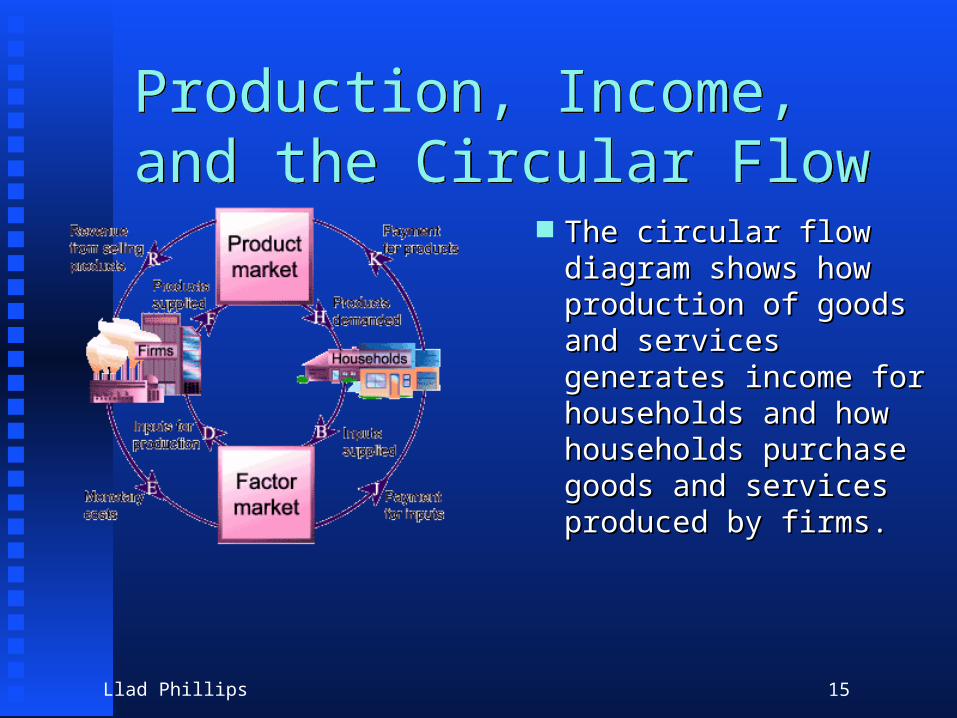
Production, Income,and the Circular FlowProduction, Income,and the Circular Flow
The circular flow diagram The circular flow diagram shows how production of shows how production of goods and services goods and services generates income for generates income for households and how households and how households purchase households purchase goods and services goods and services produced by firms.produced by firms.
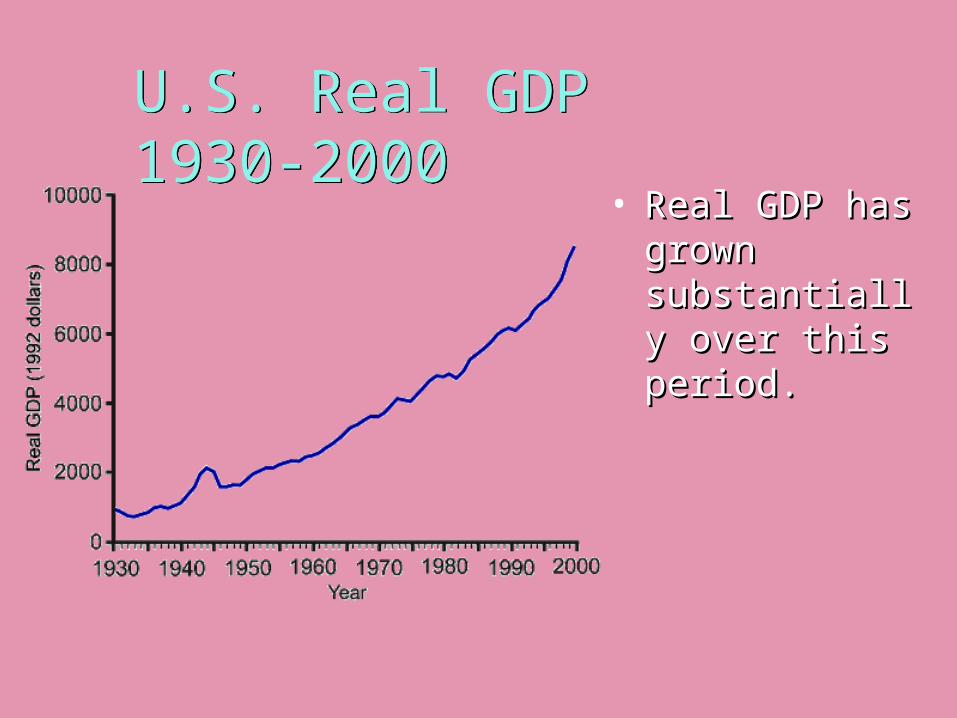
U.S. Real GDP1930-2000U.S. Real GDP1930-2000
• Real GDP has Real GDP has grown grown substantially substantially over this period.over this period.
Llad Phillips 17
Consumption ExpendituresConsumption Expenditures Consumption expenditures are purchases of newly Consumption expenditures are purchases of newly
produced goods and services by households. produced goods and services by households. Consumption is broken down into:Consumption is broken down into:
• Durable goodsDurable goods that last for a long time. that last for a long time.
• Nondurable goodsNondurable goods that last for a short time. that last for a short time.
• Services Services that reflect work done in which that reflect work done in which people play a prominent role in the delivery. people play a prominent role in the delivery.
• Consumption comprises 67% of total purchases.Consumption comprises 67% of total purchases.
Llad Phillips 18
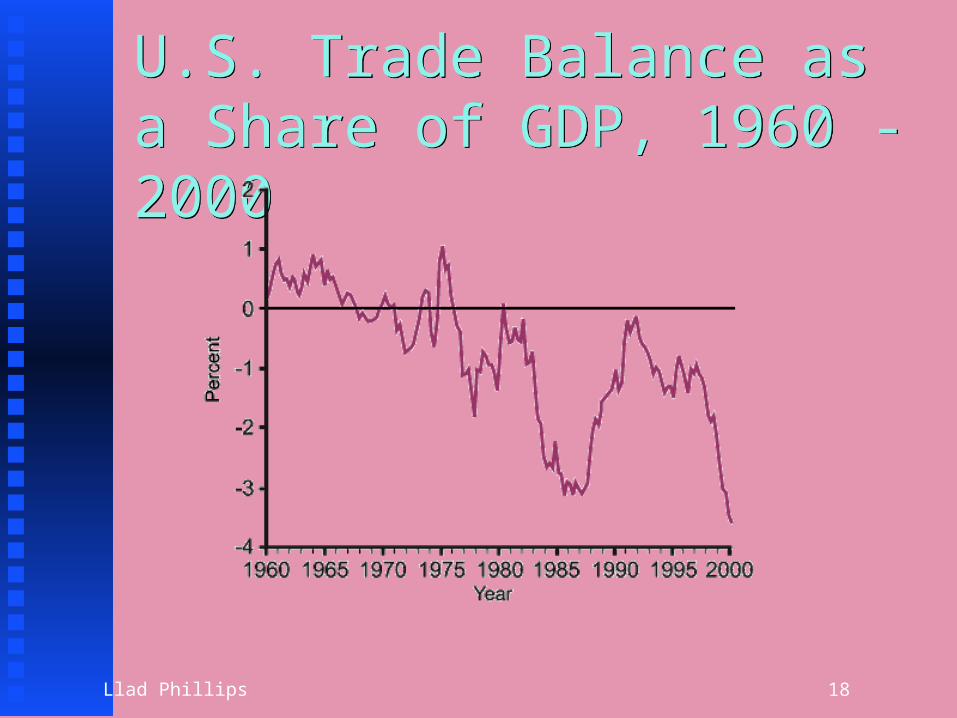
U.S. Trade Balance as a Share of GDP, 1960 - 2000U.S. Trade Balance as a Share of GDP, 1960 - 2000
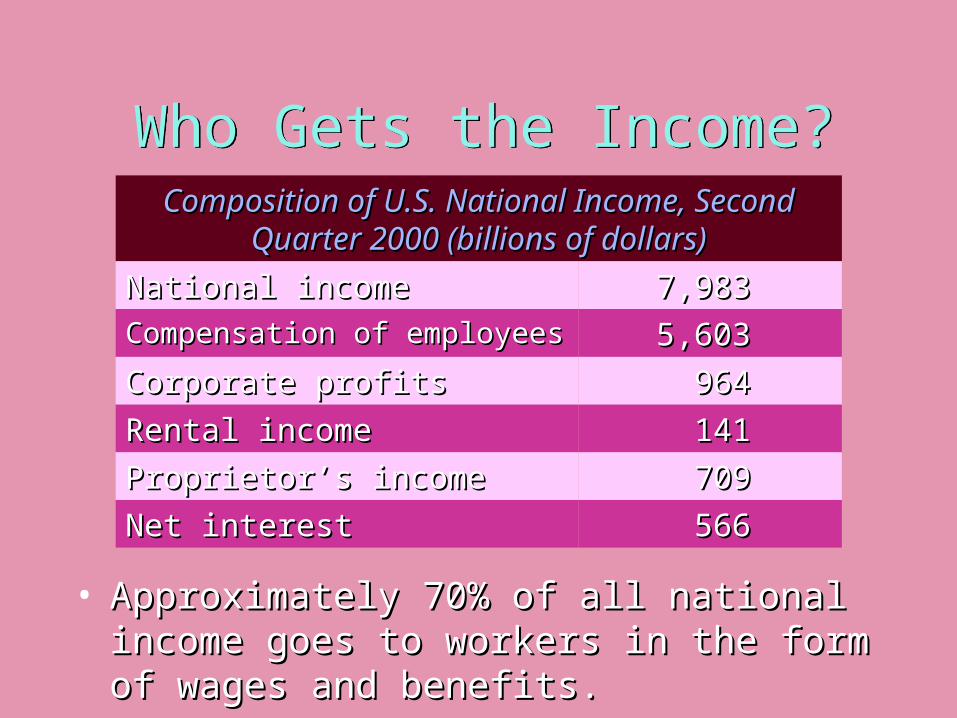
Who Gets the Income?Who Gets the Income?
• Approximately 70% of all national income goes Approximately 70% of all national income goes to workers in the form of wages and benefits.to workers in the form of wages and benefits.
Composition of U.S. National Income, Second Composition of U.S. National Income, Second Quarter 2000 (billions of dollars)Quarter 2000 (billions of dollars)
566566Net interestNet interest
709709Proprietor’s incomeProprietor’s income
141141Rental incomeRental income
964964Corporate profitsCorporate profits
5,6035,603Compensation of employeesCompensation of employees
7,9837,983National incomeNational income
Llad Phillips 20
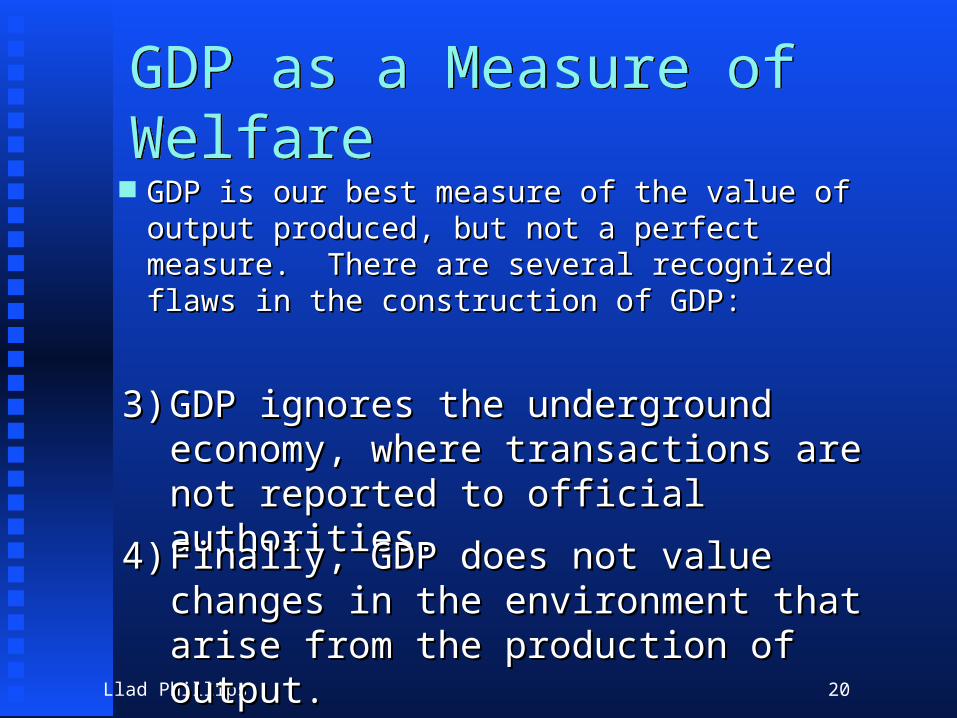
GDP as a Measure of WelfareGDP as a Measure of Welfare GDP is our best measure of the value of output GDP is our best measure of the value of output
produced, but not a perfect measure. There are several produced, but not a perfect measure. There are several recognized flaws in the construction of GDP:recognized flaws in the construction of GDP:
3)3) GDP ignores the underground economy, GDP ignores the underground economy, where transactions are not reported to where transactions are not reported to official authorities.official authorities.
4)4) Finally, GDP does not value changes in Finally, GDP does not value changes in the environment that arise from the the environment that arise from the production of output.production of output.

Llad Phillips 21
Chapter 21Chapter 21
Llad Phillips 22
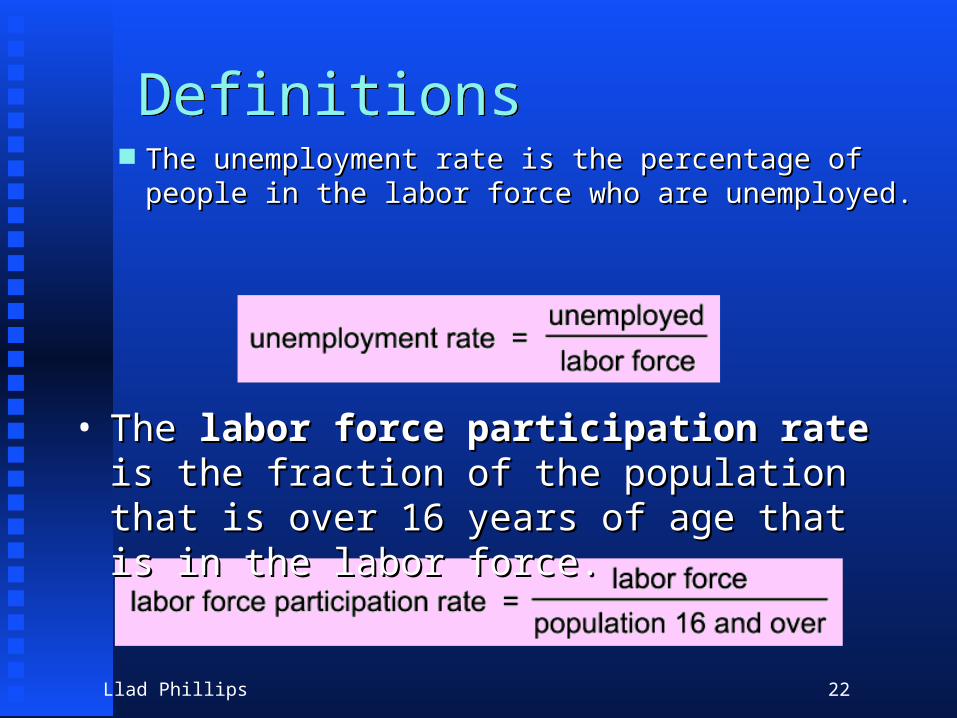
DefinitionsDefinitions The unemployment rate is the percentage of people in the labor The unemployment rate is the percentage of people in the labor
force who are unemployed.force who are unemployed.
• The The labor force participation ratelabor force participation rate is the is the fraction of the population that is over 16 years fraction of the population that is over 16 years of age that is in the labor force.of age that is in the labor force.
Llad Phillips 23
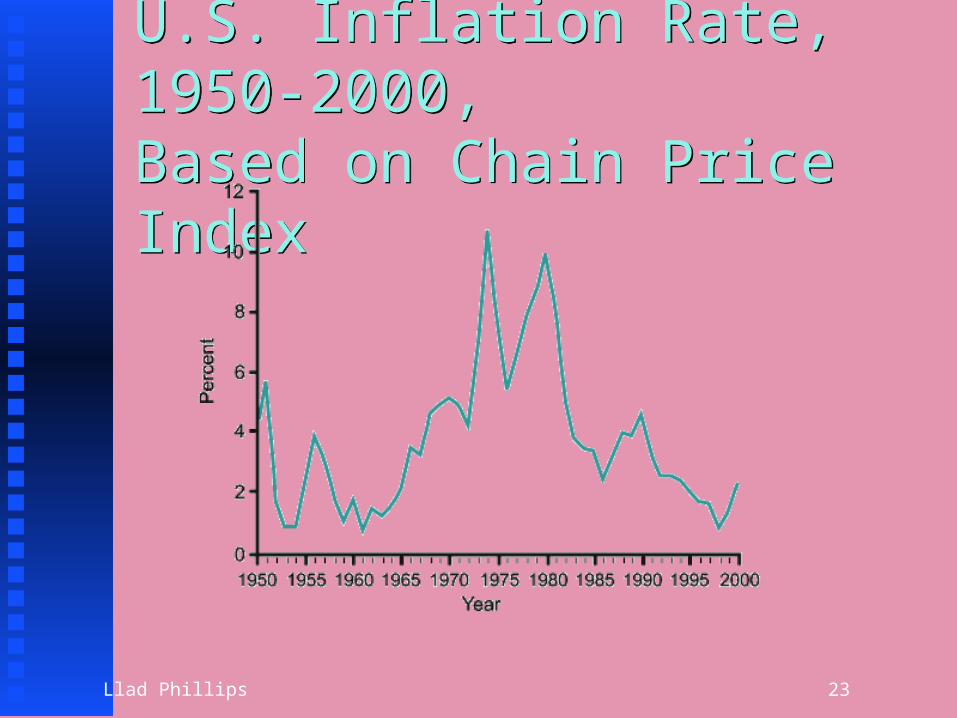
U.S. Inflation Rate, 1950-2000,Based on Chain Price IndexU.S. Inflation Rate, 1950-2000,Based on Chain Price Index
Llad Phillips 24
Chapter 24Chapter 24
Llad Phillips 25
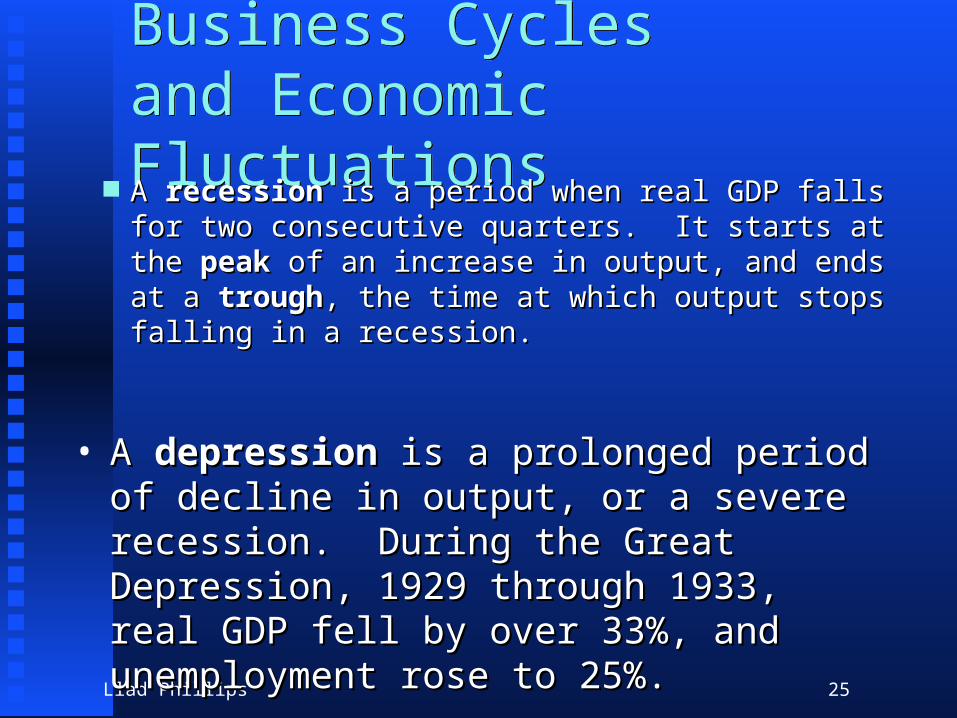
Business Cyclesand Economic FluctuationsBusiness Cyclesand Economic Fluctuations
A A recessionrecession is a period when real GDP falls for is a period when real GDP falls for two consecutive quarters. It starts at the two consecutive quarters. It starts at the peakpeak of of an increase in output, and ends at a an increase in output, and ends at a troughtrough, the , the time at which output stops falling in a recession.time at which output stops falling in a recession.
• A A depressiondepression is a prolonged period of decline is a prolonged period of decline in output, or a severe recession. During the in output, or a severe recession. During the Great Depression, 1929 through 1933, real Great Depression, 1929 through 1933, real GDP fell by over 33%, and unemployment GDP fell by over 33%, and unemployment rose to 25%.rose to 25%.
Llad Phillips 26
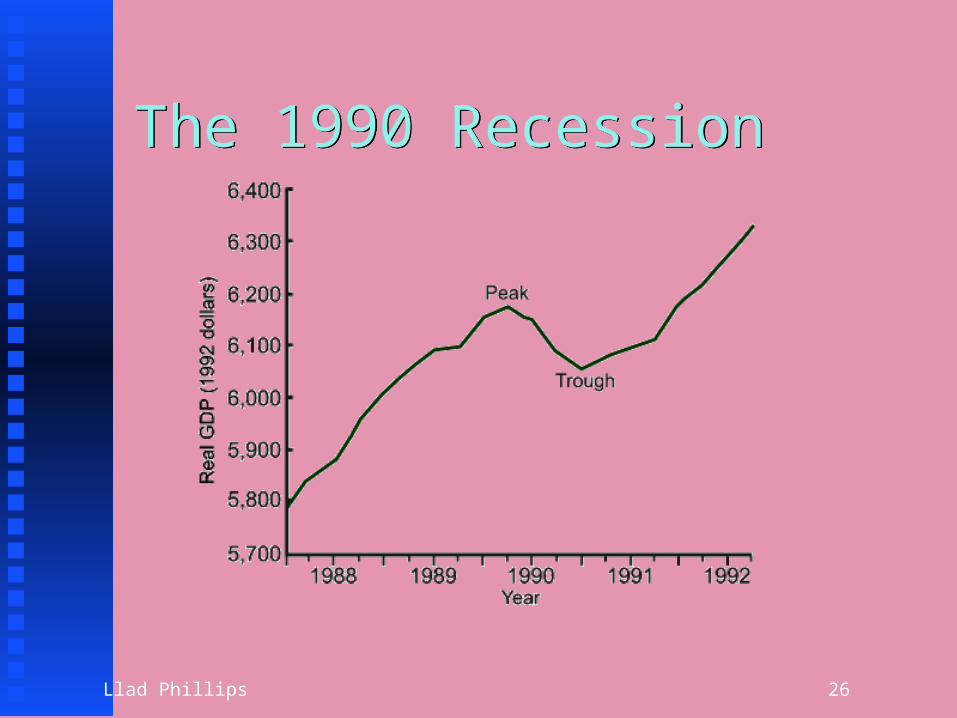
The 1990 RecessionThe 1990 Recession
Llad Phillips 27
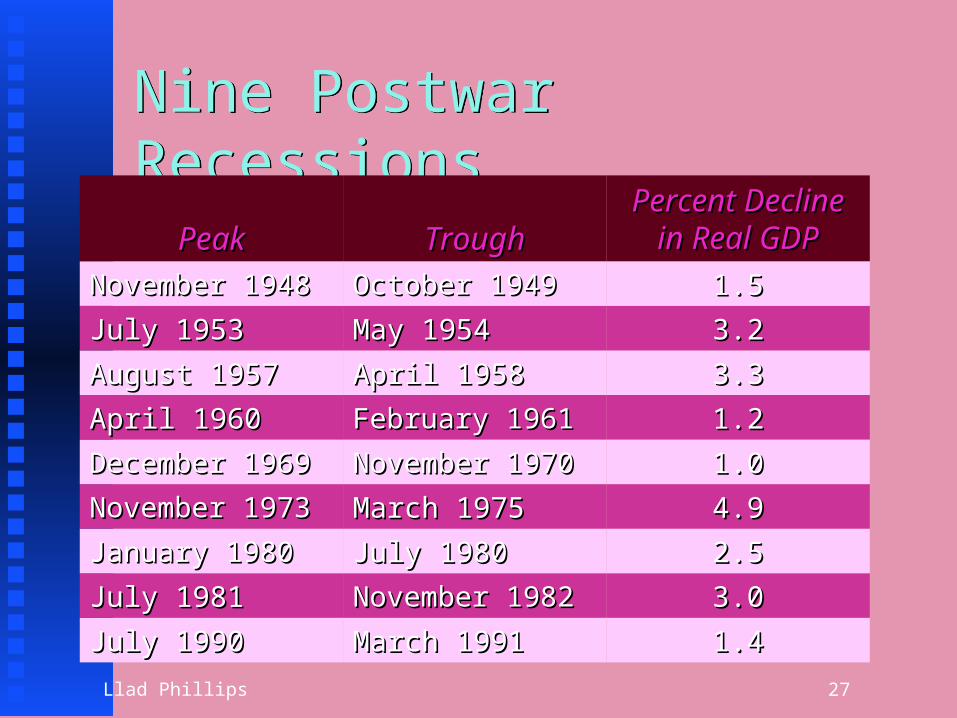
Nine Postwar RecessionsNine Postwar Recessions
1.41.4March 1991March 1991July 1990July 1990
3.03.0November 1982November 1982July 1981July 1981
2.52.5July 1980July 1980January 1980January 1980
4.94.9March 1975March 1975November 1973November 1973
1.01.0November 1970November 1970December 1969December 1969
1.21.2February 1961February 1961April 1960April 1960
3.33.3April 1958April 1958August 1957August 1957
3.23.2May 1954May 1954July 1953July 1953
1.51.5October 1949October 1949November 1948November 1948
Percent Decline Percent Decline in Real GDPin Real GDPTroughTroughPeakPeak
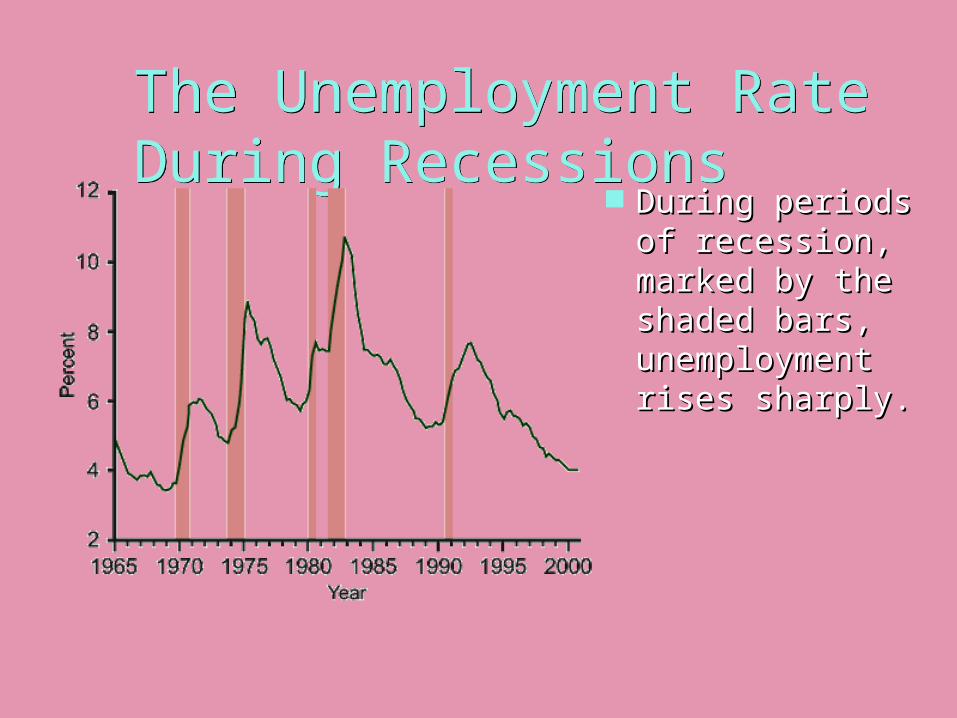
The Unemployment RateDuring RecessionsThe Unemployment RateDuring Recessions
During periods During periods of recession, of recession, marked by the marked by the shaded bars, shaded bars, unemployment unemployment rises sharply.rises sharply.
Llad Phillips 29
Money, the Banking System and the Federal ReserveMoney, the Banking System and the Federal Reserve What is money?What is money?
Llad Phillips 30
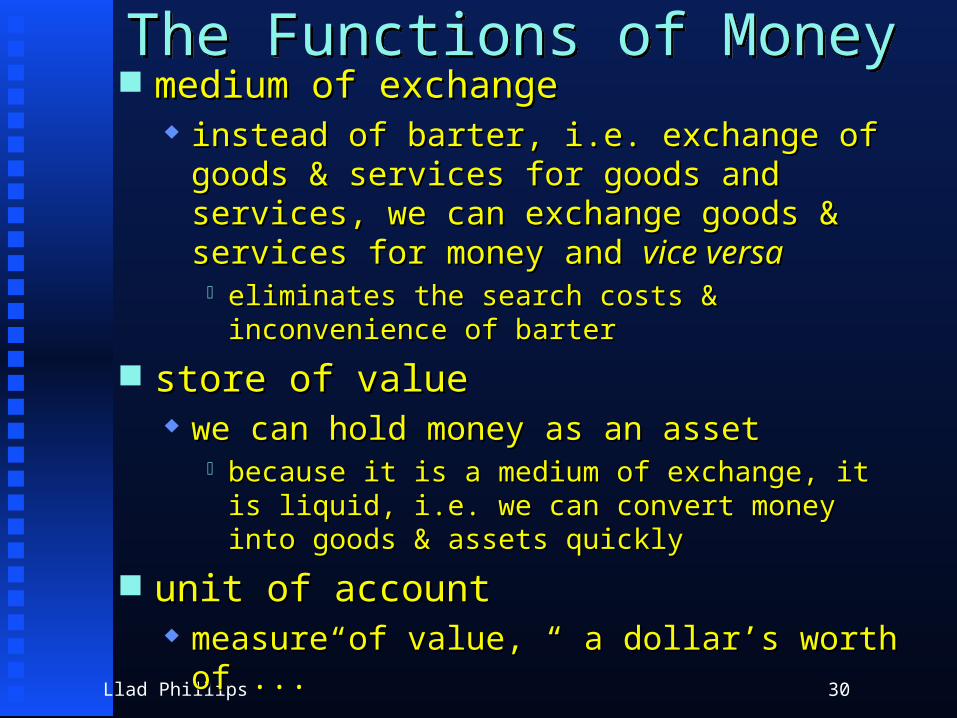
The Functions of MoneyThe Functions of Money medium of exchangemedium of exchange
instead of barter, i.e. exchange of goods & instead of barter, i.e. exchange of goods & services for goods and services, we can services for goods and services, we can exchange goods & services for money and exchange goods & services for money and vice vice versaversa
eliminates the search costs & inconvenience of eliminates the search costs & inconvenience of barterbarter
store of valuestore of value we can hold money as an assetwe can hold money as an asset
because it is a medium of exchange, it is liquid, i.e. because it is a medium of exchange, it is liquid, i.e. we can convert money into goods & assets quicklywe can convert money into goods & assets quickly
unit of accountunit of account measure of value, “ a dollar’s worth of ...”measure of value, “ a dollar’s worth of ...”
Llad Phillips 31
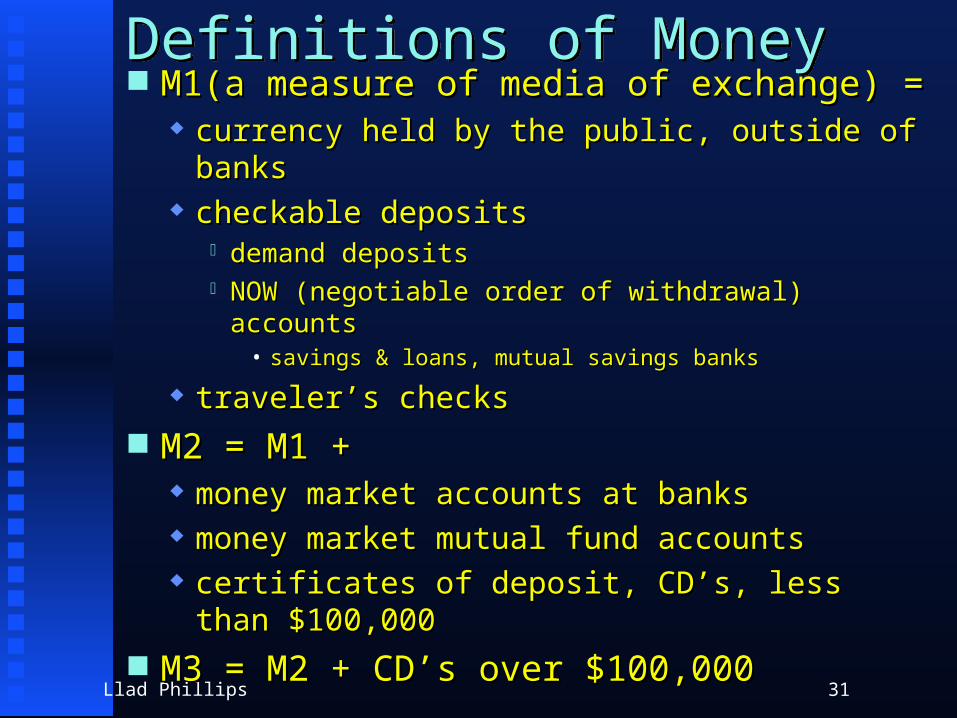
Definitions of MoneyDefinitions of Money M1(a measure of media of exchange) =M1(a measure of media of exchange) =
currency held by the public, outside of bankscurrency held by the public, outside of banks checkable depositscheckable deposits
demand depositsdemand deposits NOW (negotiable order of withdrawal) accountsNOW (negotiable order of withdrawal) accounts
• savings & loans, mutual savings bankssavings & loans, mutual savings banks
traveler’s checkstraveler’s checks M2 = M1 +M2 = M1 +
money market accounts at banksmoney market accounts at banks money market mutual fund accountsmoney market mutual fund accounts certificates of deposit, CD’s, less than $100,000certificates of deposit, CD’s, less than $100,000
M3 = M2 + CD’s over $100,000M3 = M2 + CD’s over $100,000
Llad Phillips 32
Summary of Monetary PolicySummary of Monetary Policy
Llad Phillips 33
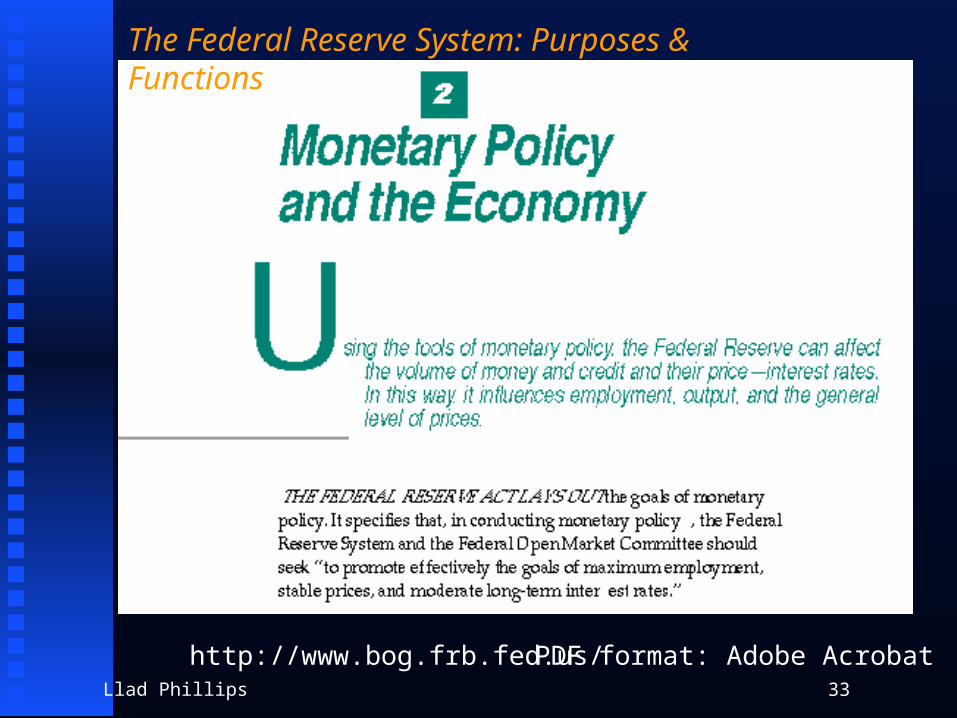
The Federal Reserve System: Purposes & Functions
http://www.bog.frb.fed.us/ PDF format: Adobe Acrobat
Llad Phillips 34
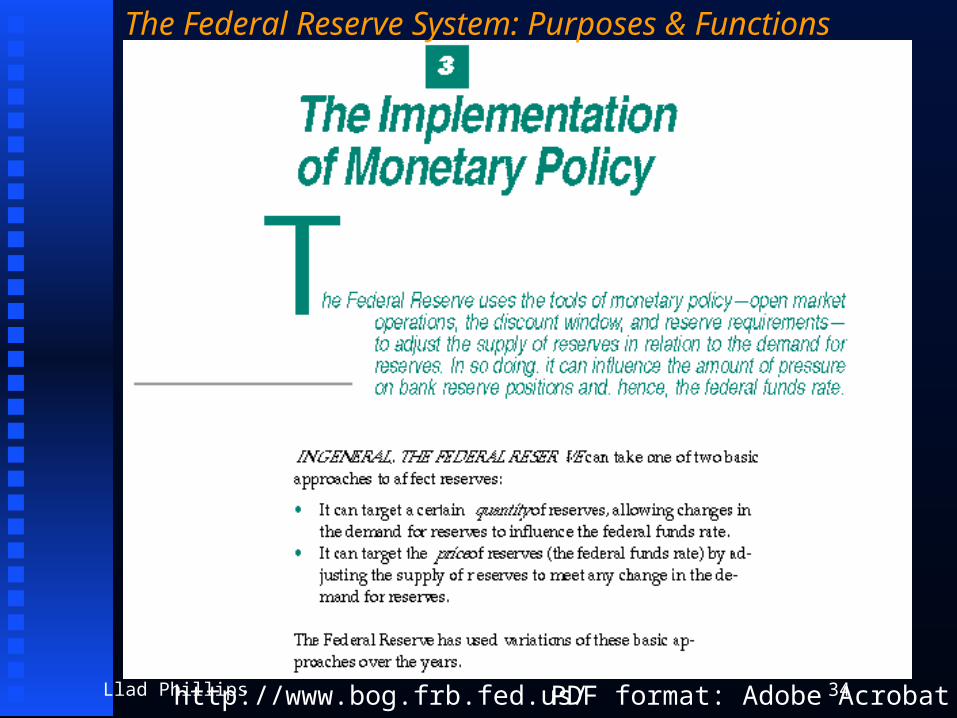
The Federal Reserve System: Purposes & Functions
http://www.bog.frb.fed.us/ PDF format: Adobe Acrobat
Llad Phillips 35
How Effective Has the Fed Been?How Effective Has the Fed Been? Fed Goals: A Stable EconomyFed Goals: A Stable Economy
maximum employmentmaximum employment stable pricesstable prices moderate long-term interest ratesmoderate long-term interest rates
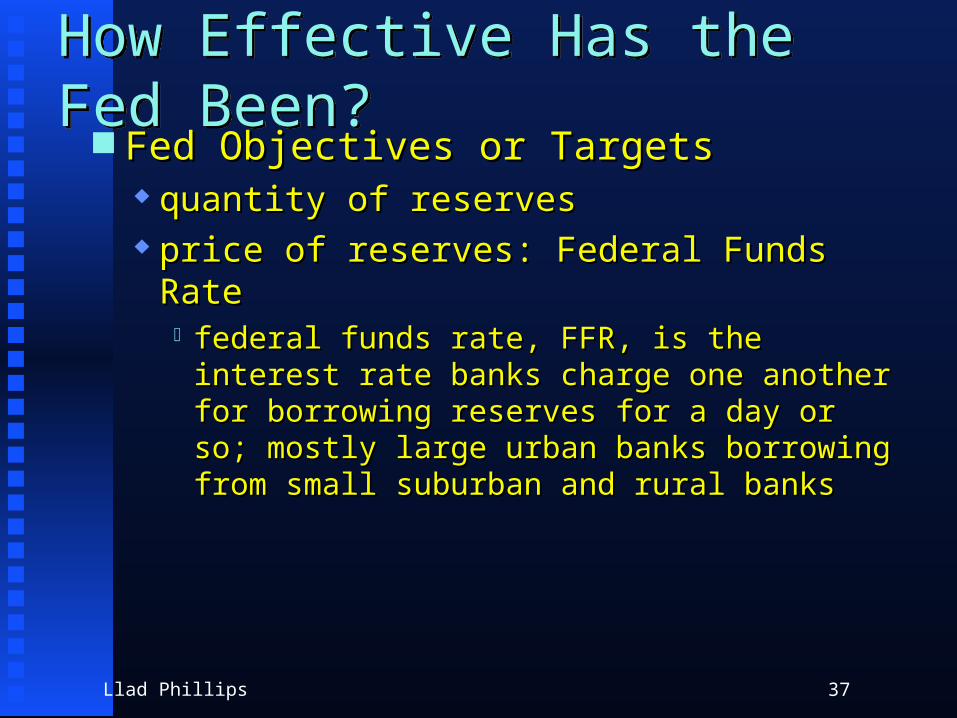
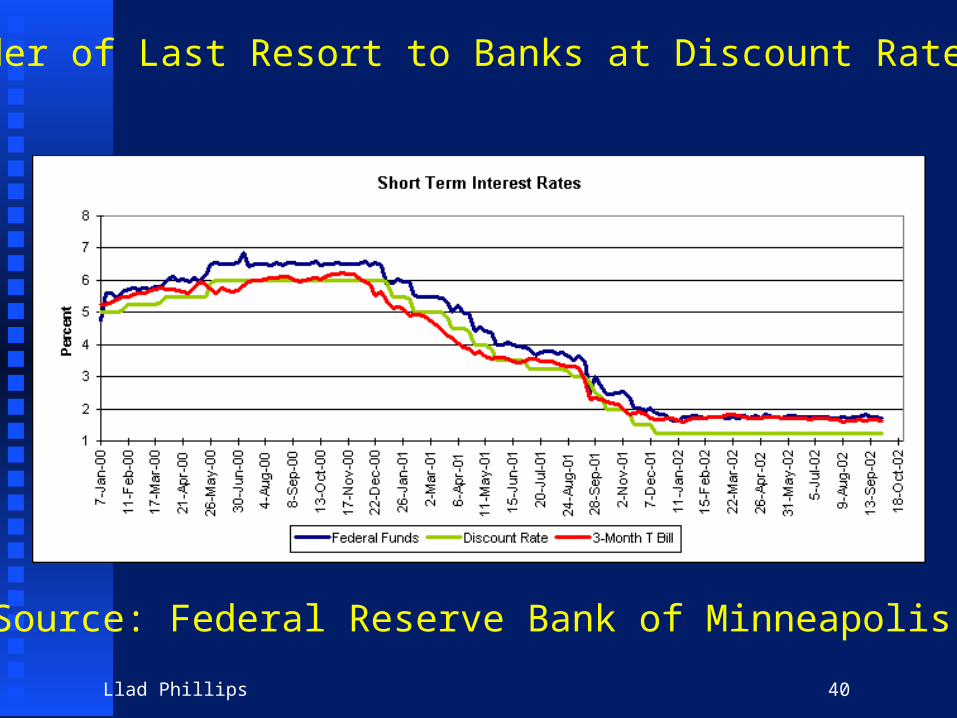
Fed Objectives or TargetsFed Objectives or Targets quantity of reservesquantity of reserves price of reserves: Federal Funds Rateprice of reserves: Federal Funds Rate
federal funds rate, FFR, is the interest rate banks federal funds rate, FFR, is the interest rate banks charge one another for borrowing reserves for a day charge one another for borrowing reserves for a day or so; mostly large urban banks borrowing from or so; mostly large urban banks borrowing from small suburban and rural bankssmall suburban and rural banks
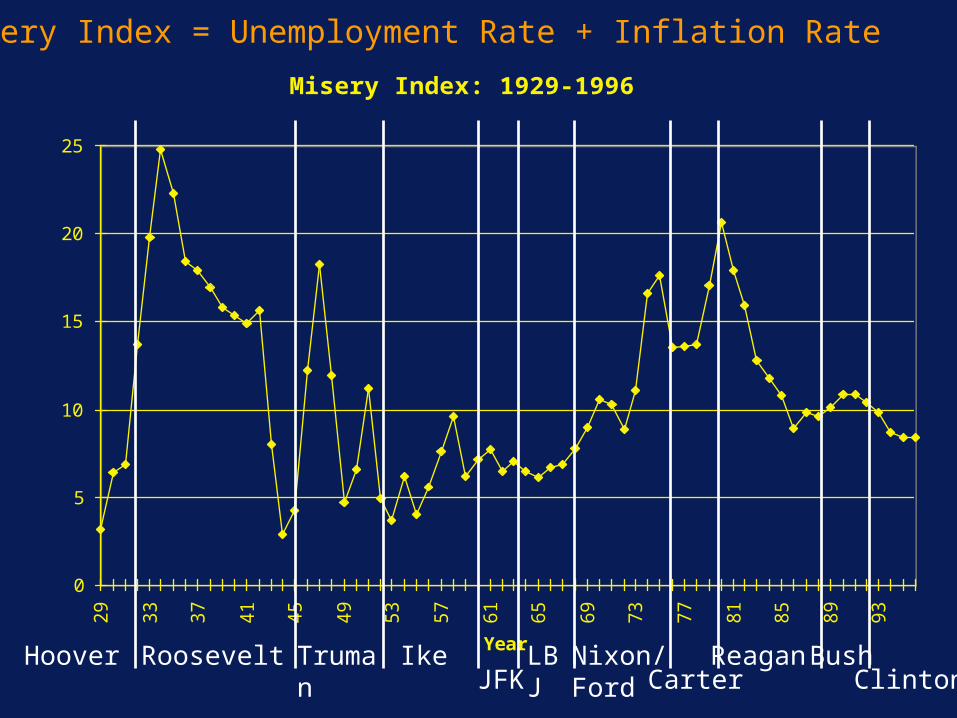
Misery Index: 1929-1996 .
0
5
10
15
20
25
29
33
37
41
45
49
53
57
61
65
69
73
77
81
85
89
93
Year
Ind
ex
Hoover Roosevelt Truman IkeJFK
LBJ Nixon/Ford Carter
Reagan BushClinton
Misery Index = Unemployment Rate + Inflation Rate
Llad Phillips 37
How Effective Has the Fed Been?How Effective Has the Fed Been? Fed Objectives or TargetsFed Objectives or Targets
quantity of reservesquantity of reserves price of reserves: Federal Funds Rateprice of reserves: Federal Funds Rate
federal funds rate, FFR, is the interest rate federal funds rate, FFR, is the interest rate banks charge one another for borrowing banks charge one another for borrowing reserves for a day or so; mostly large urban reserves for a day or so; mostly large urban banks borrowing from small suburban and rural banks borrowing from small suburban and rural banksbanks
Llad Phillips 38
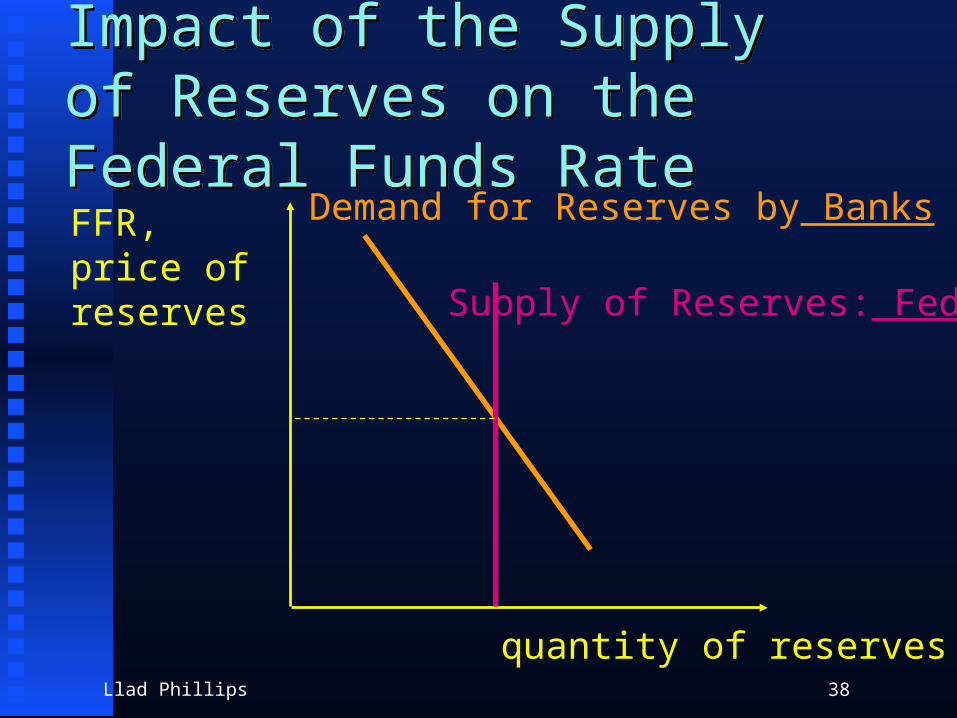
Impact of the Supply of Reserves on the Federal Funds RateImpact of the Supply of Reserves on the Federal Funds Rate
FFR,price ofreserves
quantity of reserves
Demand for Reserves by Banks
Supply of Reserves: Fed
Llad Phillips 39
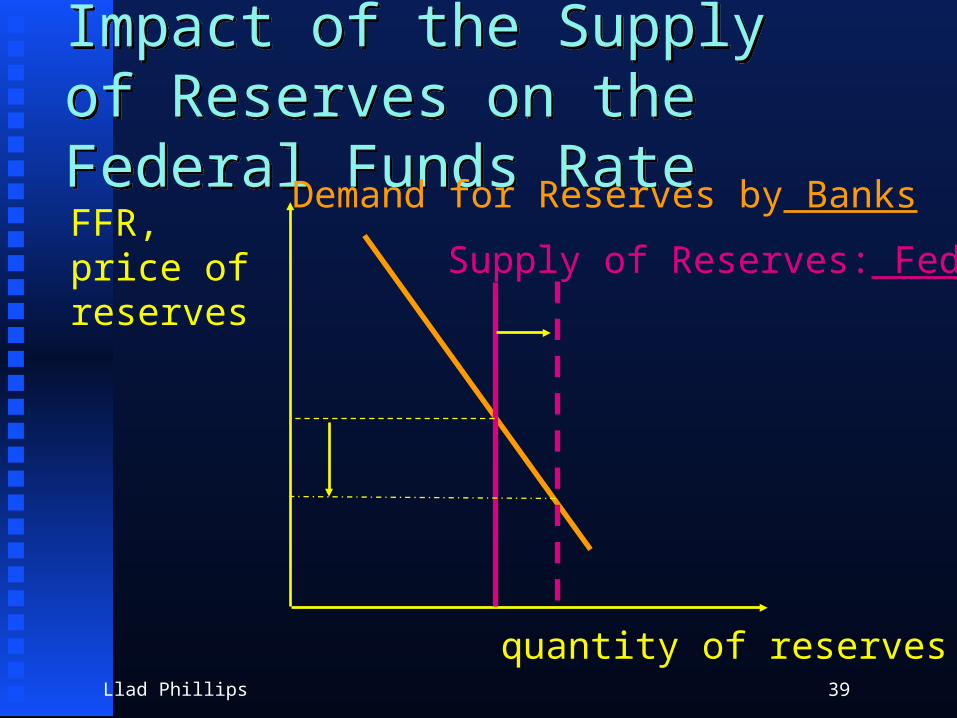
Impact of the Supply of Reserves on the Federal Funds RateImpact of the Supply of Reserves on the Federal Funds Rate
FFR,price ofreserves
quantity of reserves
Demand for Reserves by Banks
Supply of Reserves: Fed
Llad Phillips 40
Fed: Lender of Last Resort to Banks at Discount Rate, 00-02
Source: Federal Reserve Bank of Minneapolis
Llad Phillips 41
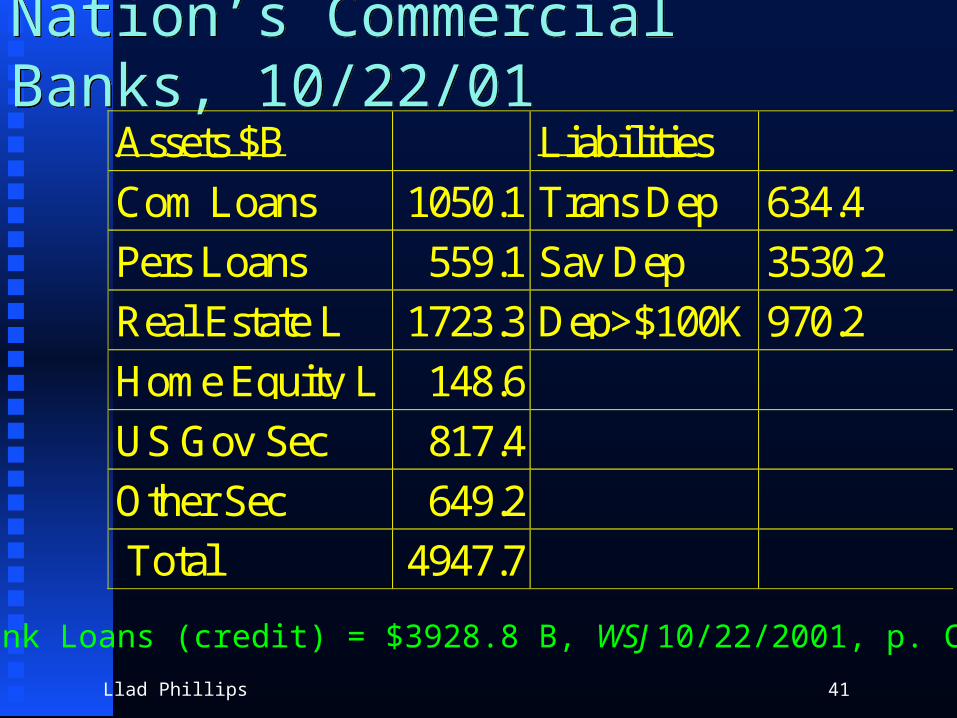
Nation’s Commercial Banks, 10/22/01Nation’s Commercial Banks, 10/22/01Assets $B Liabilities
Com Loans 1050.1 Trans Dep 634.4
Pers Loans 559.1 Sav Dep 3530.2
Real Estate L 1723.3 Dep>$100K 970.2
Home Equity L 148.6
US Gov Sec 817.4
Other Sec 649.2
Total 4947.7
Bank Loans (credit) = $3928.8 B, WSJ 10/22/2001, p. C 2
Llad Phillips 42
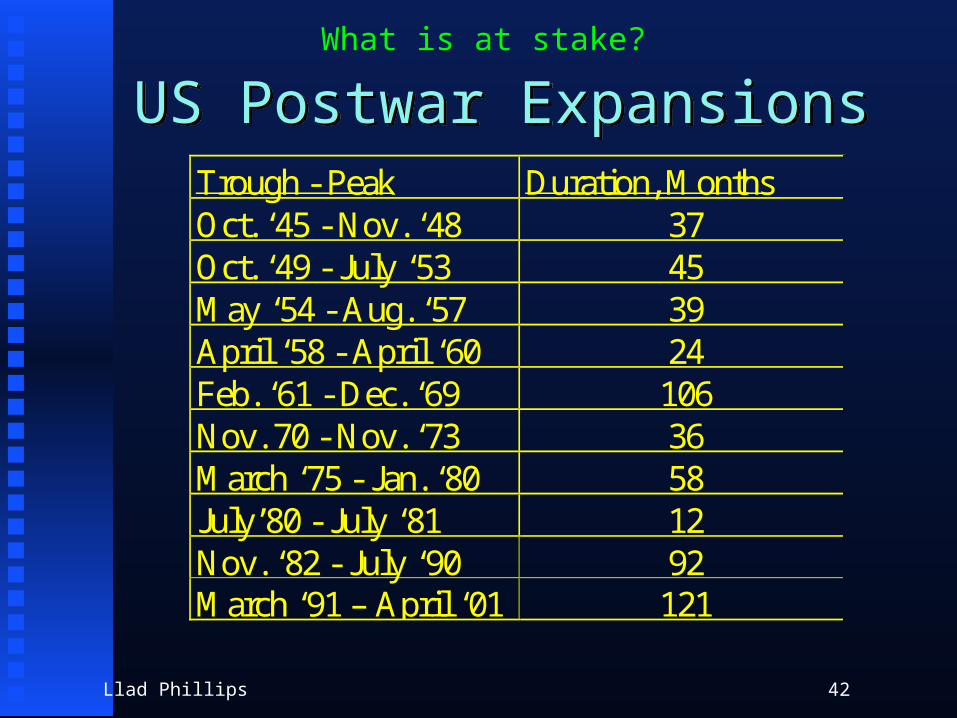
US Postwar ExpansionsUS Postwar ExpansionsTrough - Peak Duration, MonthsOct. ‘45 - Nov. ‘48 37Oct. ‘49 - July ‘53 45May ‘54 - Aug. ‘57 39April ‘58 - April ‘60 24Feb. ‘61 - Dec. ‘69 106Nov. 70 - Nov. ‘73 36March ‘75 - Jan. ‘80 58July’80 - July ‘81 12Nov. ‘82 - July ‘90 92March ‘91 – April ‘01 121
What is at stake?
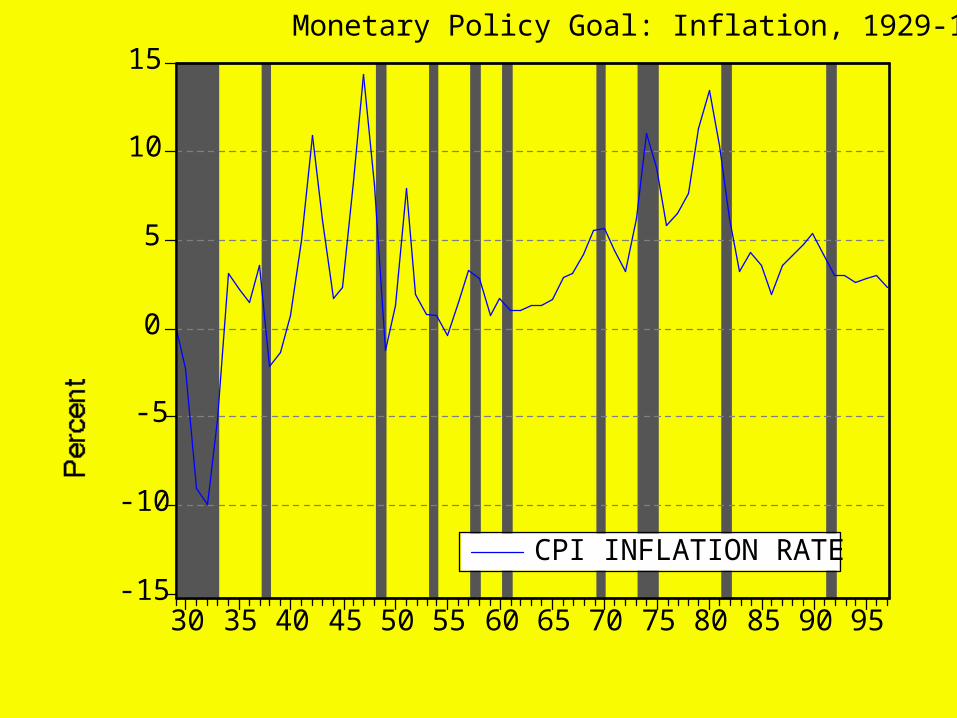
-15
-10
-5
0
5
10
15
30 35 40 45 50 55 60 65 70 75 80 85 90 95
CPI INFLATION RATE
Monetary Policy Goal: Inflation, 1929-1997
0
5
10
15
20
25
30
30 35 40 45 50 55 60 65 70 75 80 85 90 95
UNEMPLOYMENT RATE
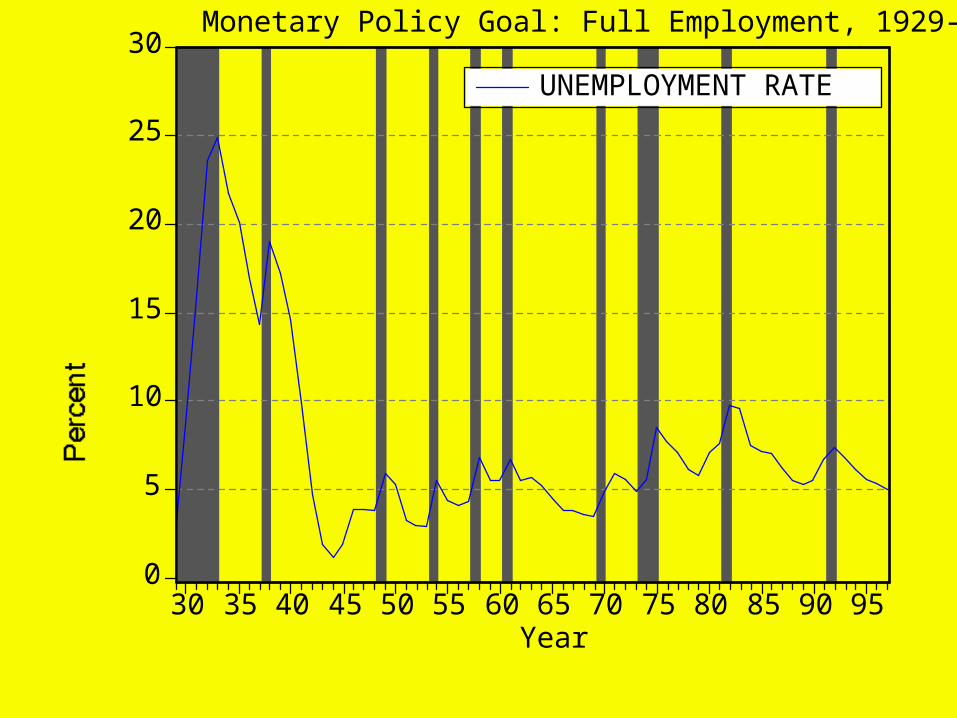
Monetary Policy Goal: Full Employment, 1929-1997
Year
Llad Phillips 45
Monetary Policy TradeoffMonetary Policy Tradeoff Is the Fed Is the Fed tootoo Inflation Oriented? Inflation Oriented? Note: the CPI inflation rate tends to Note: the CPI inflation rate tends to
decrease during and after recessionsdecrease during and after recessions to control inflation, the Fed may be tempted to control inflation, the Fed may be tempted
into policies that precipitate recessions and/or into policies that precipitate recessions and/or make them more severemake them more severe
Note: the unemployment rate tends to Note: the unemployment rate tends to increase during and after recessionsincrease during and after recessions some critics in Congress think the Fed is too some critics in Congress think the Fed is too
restrictive, i.e. not sufficiently expansionary in restrictive, i.e. not sufficiently expansionary in policypolicy
Llad Phillips 46
Other Measures of Fed EffectivenessOther Measures of Fed Effectiveness Reserve AggregatesReserve Aggregates
Excess ReservesExcess Reserves Free ReservesFree Reserves
Llad Phillips 47
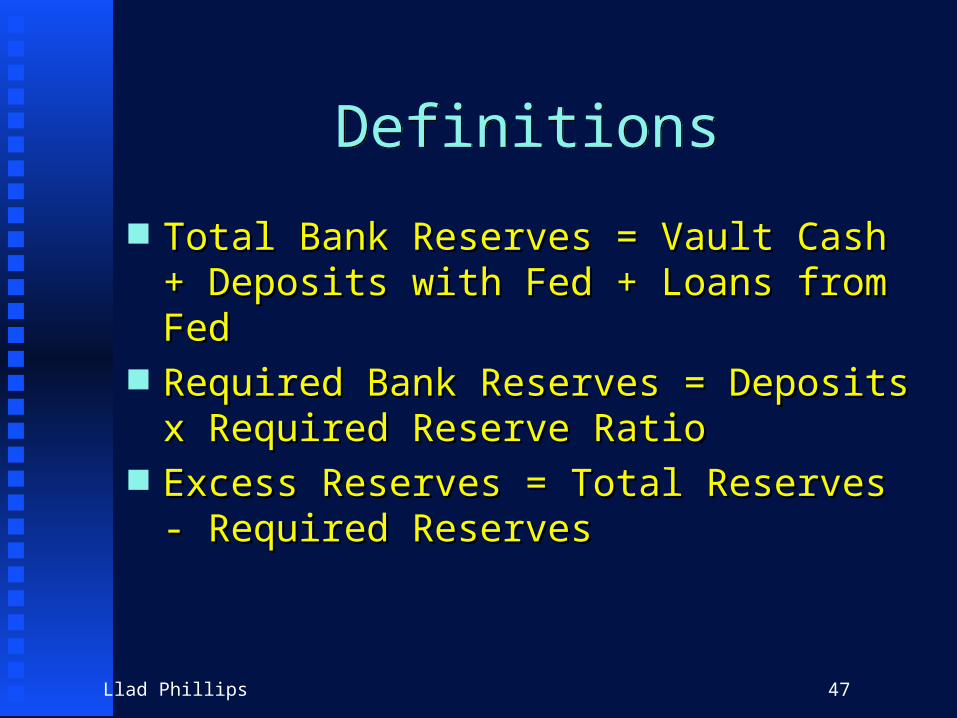
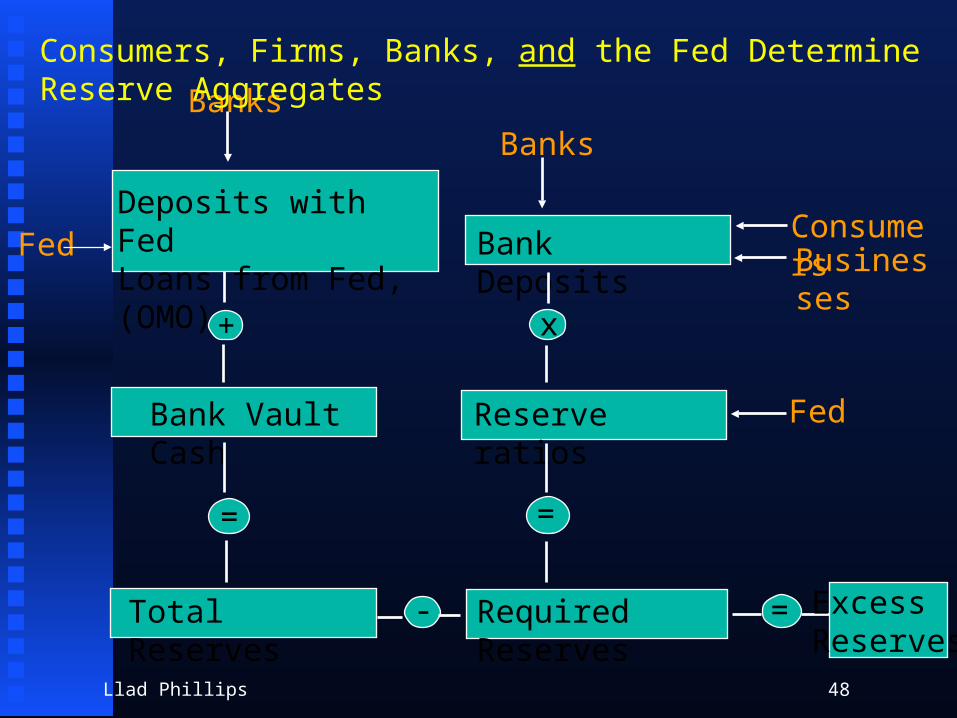
DefinitionsDefinitions
Total Bank Reserves = Vault Cash + Total Bank Reserves = Vault Cash + Deposits with Fed + Loans from FedDeposits with Fed + Loans from Fed
Required Bank Reserves = Deposits x Required Bank Reserves = Deposits x Required Reserve RatioRequired Reserve Ratio
Excess Reserves = Total Reserves - Excess Reserves = Total Reserves - Required ReservesRequired Reserves
Llad Phillips 48
Deposits with FedLoans from Fed,(OMO)Fed
Banks
+
Bank Vault Cash
=
Total Reserves
Banks
Bank Deposits ConsumersBusinesses
x
Reserve ratios
==
Required Reserves- = ExcessReserves
Consumers, Firms, Banks, and the Fed Determine Reserve Aggregates
Fed
Llad Phillips 49
Llad Phillips 50
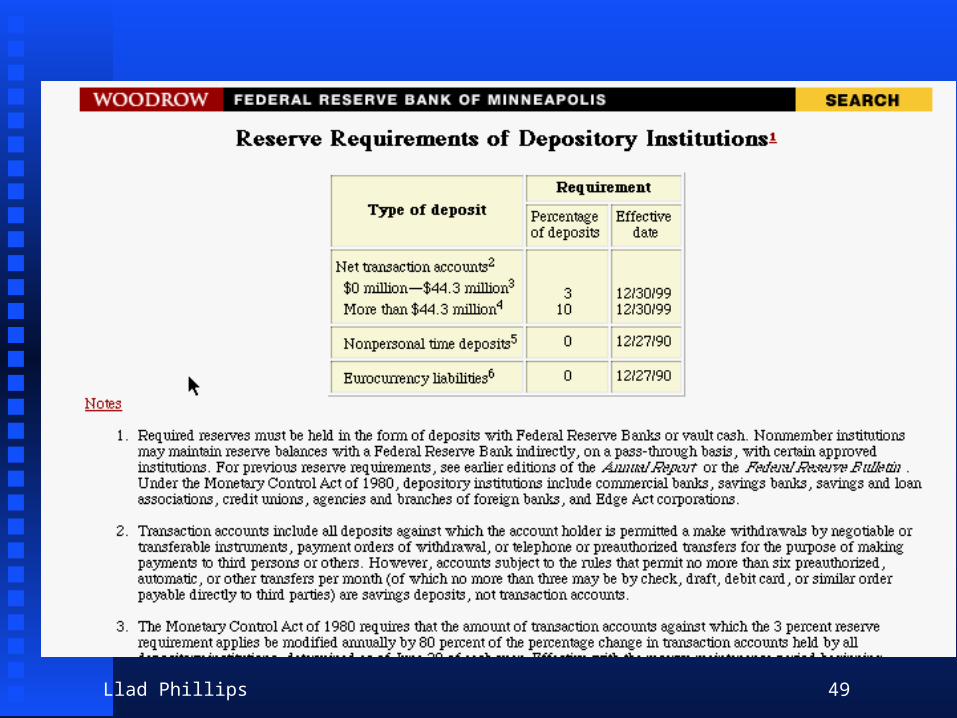
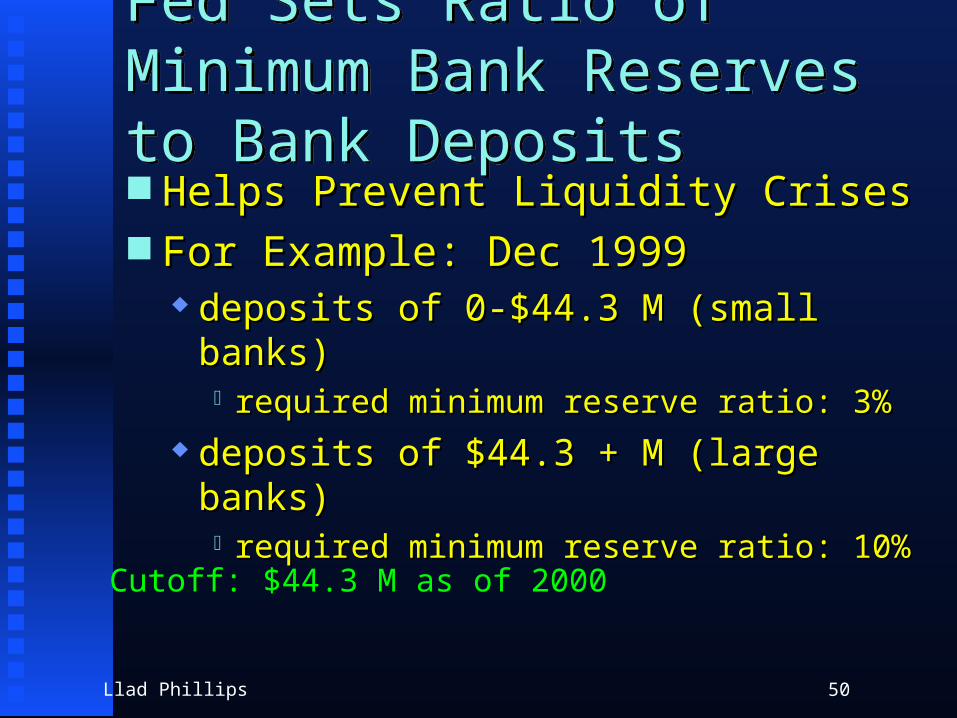
Fed Sets Ratio of Minimum Bank Reserves to Bank DepositsFed Sets Ratio of Minimum Bank Reserves to Bank Deposits Helps Prevent Liquidity CrisesHelps Prevent Liquidity Crises For Example: Dec 1999For Example: Dec 1999
deposits of 0-$44.3 M (small banks)deposits of 0-$44.3 M (small banks) required minimum reserve ratio: 3%required minimum reserve ratio: 3%
deposits of $44.3 + M (large banks)deposits of $44.3 + M (large banks) required minimum reserve ratio: 10%required minimum reserve ratio: 10%
Cutoff: $44.3 M as of 2000
Llad Phillips 51
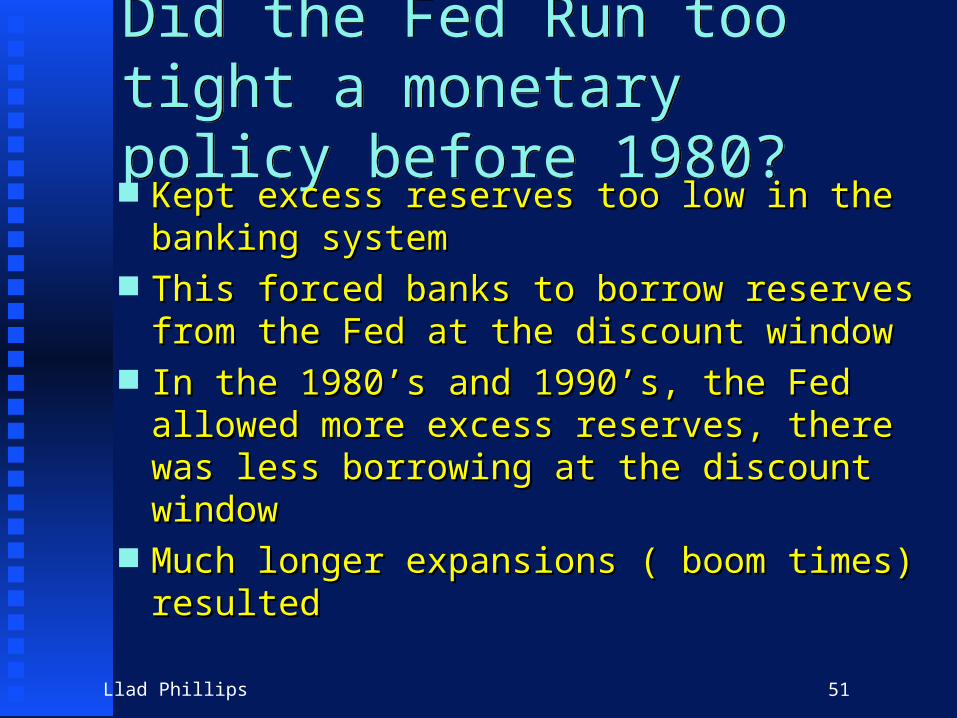
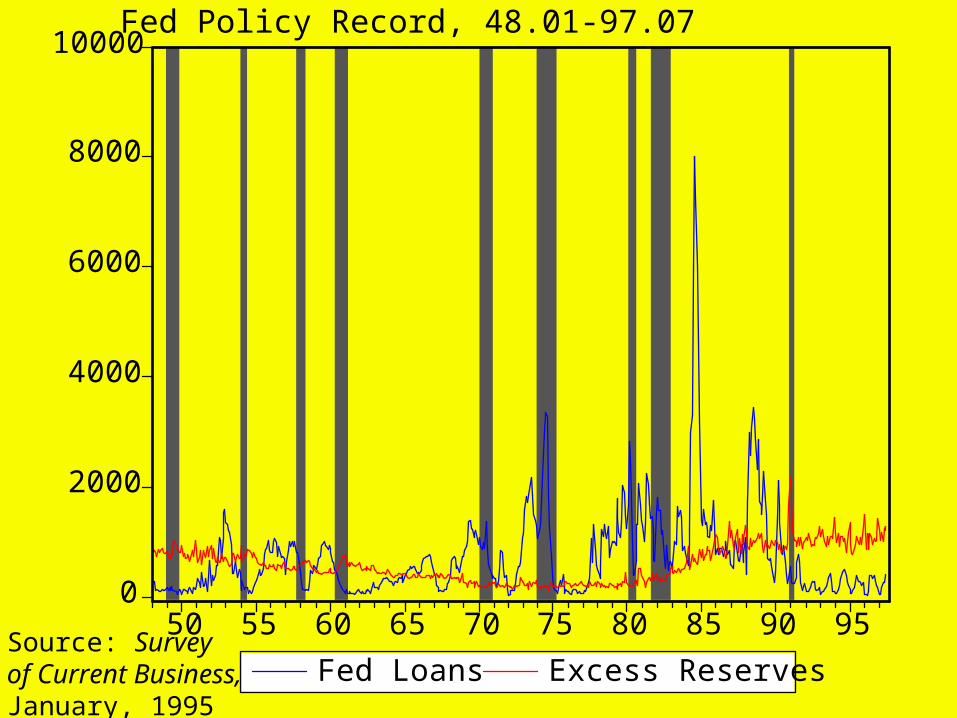
Did the Fed Run too tight a monetary policy before 1980?Did the Fed Run too tight a monetary policy before 1980? Kept excess reserves too low in the banking Kept excess reserves too low in the banking
systemsystem This forced banks to borrow reserves from This forced banks to borrow reserves from
the Fed at the discount windowthe Fed at the discount window In the 1980’s and 1990’s, the Fed allowed In the 1980’s and 1990’s, the Fed allowed
more excess reserves, there was less more excess reserves, there was less borrowing at the discount windowborrowing at the discount window
Much longer expansions ( boom times) Much longer expansions ( boom times) resultedresulted
0
2000
4000
6000
8000
10000
50 55 60 65 70 75 80 85 90 95
Fed Loans Excess Reserves
Fed Policy Record, 48.01-97.07
Source: Surveyof Current Business,January, 1995
Llad Phillips 53
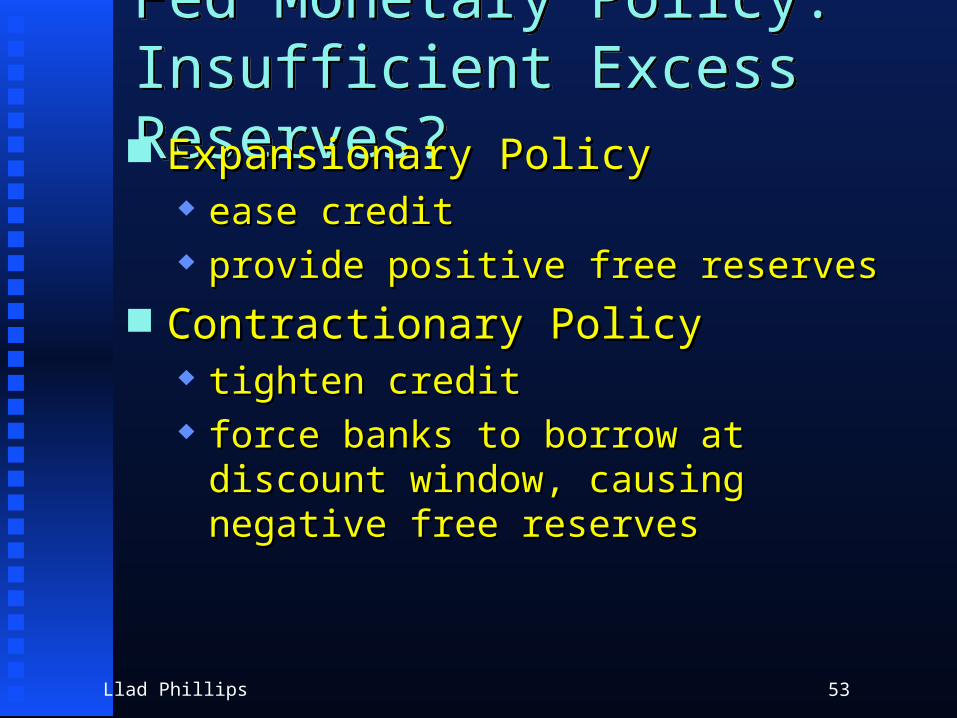
Fed Monetary Policy: Insufficient Excess Reserves?Fed Monetary Policy: Insufficient Excess Reserves? Expansionary PolicyExpansionary Policy
ease creditease credit provide positive free reservesprovide positive free reserves
Contractionary PolicyContractionary Policy tighten credittighten credit force banks to borrow at discount window, force banks to borrow at discount window,
causing negative free reservescausing negative free reserves
Llad Phillips 54
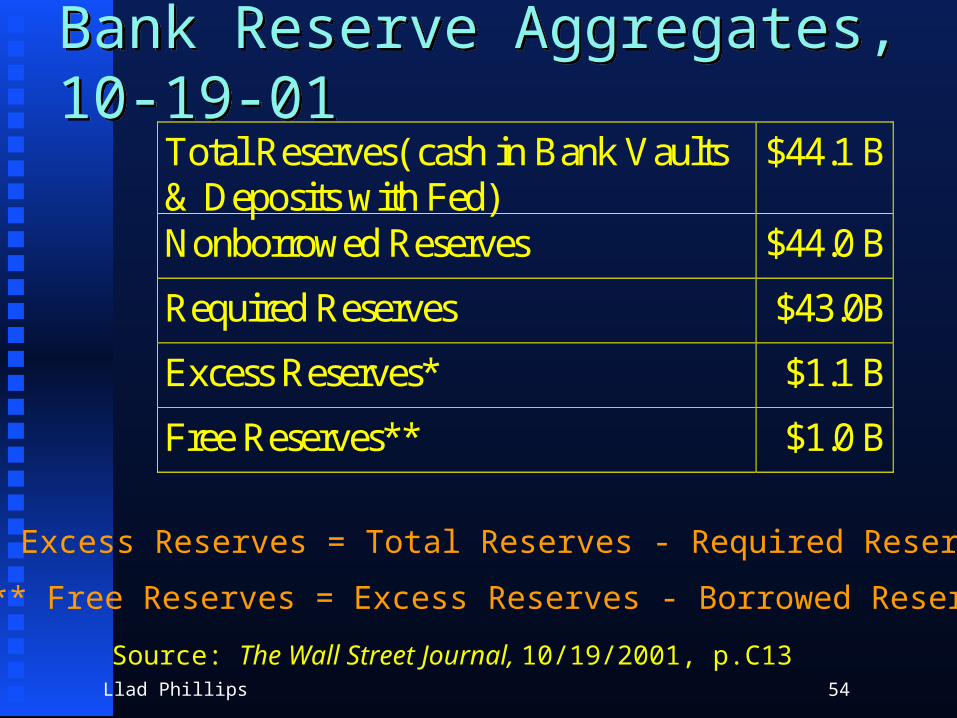
Bank Reserve Aggregates, 10-19-01Bank Reserve Aggregates, 10-19-01Total Reserves( cash in Bank Vaults& Deposits with Fed)
$44.1 B
Nonborrowed Reserves $44.0 B
Required Reserves $43.0B
Excess Reserves* $1.1 B
Free Reserves** $1.0 B
* Excess Reserves = Total Reserves - Required Reserves
** Free Reserves = Excess Reserves - Borrowed Reserves
Source: The Wall Street Journal, 10/19/2001, p.C13
Llad Phillips 55
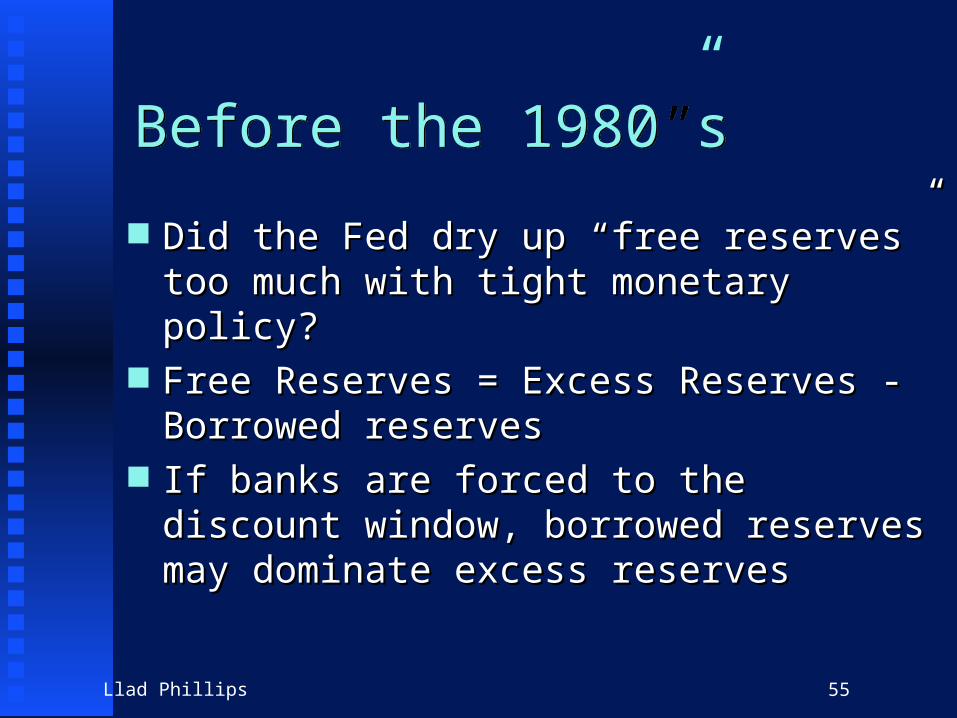
Before the 1980”sBefore the 1980”s
Did the Fed dry up “free reserves” too much Did the Fed dry up “free reserves” too much with tight monetary policy?with tight monetary policy?
Free Reserves = Excess Reserves - Free Reserves = Excess Reserves - Borrowed reservesBorrowed reserves
If banks are forced to the discount window, If banks are forced to the discount window, borrowed reserves may dominate excess borrowed reserves may dominate excess reservesreserves

0
2000
4000
6000
8000
10000
50 55 60 65 70 75 80 85 90 95
Fed Loans Excess Reserves
Fed Policy Record, 48.01-97.07
Source: Surveyof Current Business,January, 1995
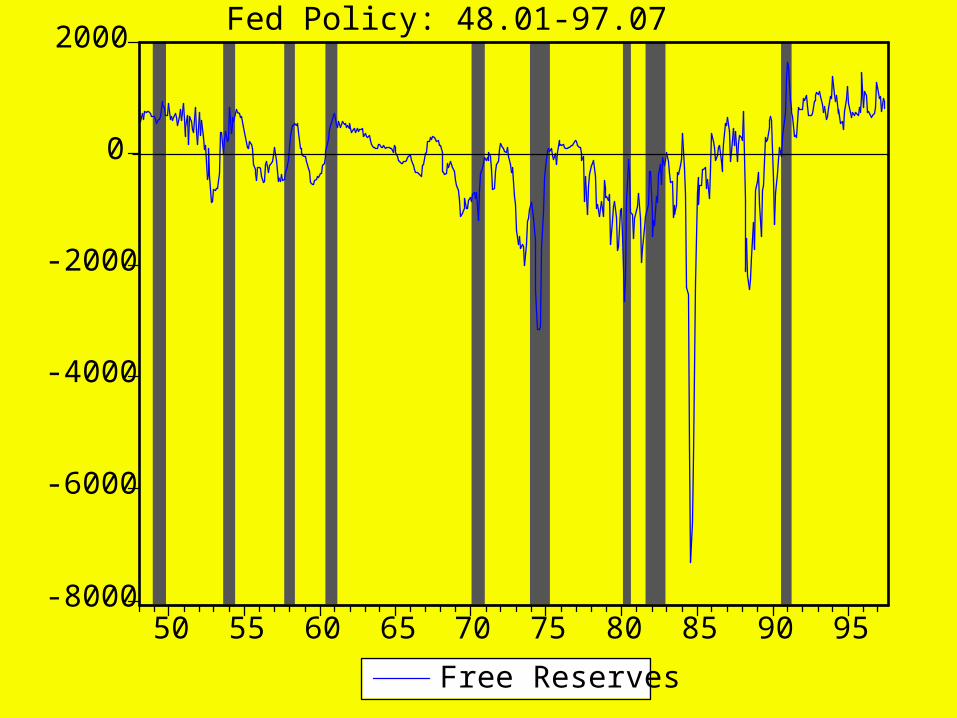
-8000
-6000
-4000
-2000
0
2000
50 55 60 65 70 75 80 85 90 95
Free Reserves
Fed Policy: 48.01-97.07
Llad Phillips 58
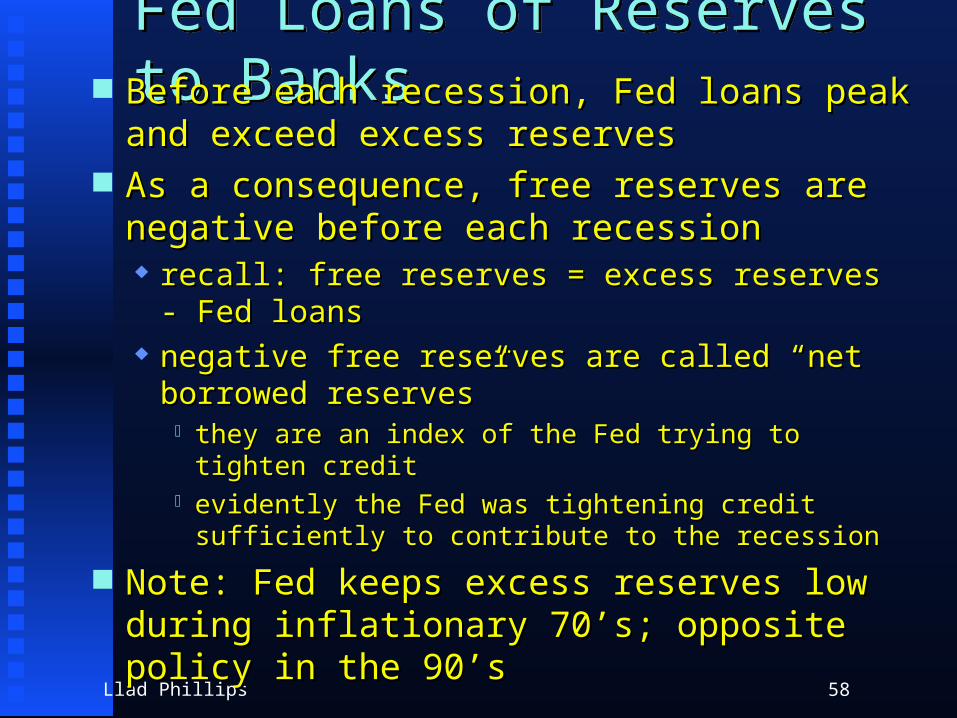
Fed Loans of Reserves to BanksFed Loans of Reserves to Banks Before each recession, Fed loans peak and Before each recession, Fed loans peak and
exceed excess reservesexceed excess reserves As a consequence, free reserves are negative As a consequence, free reserves are negative
before each recessionbefore each recession recall: free reserves = excess reserves - Fed loansrecall: free reserves = excess reserves - Fed loans negative free reserves are called “net borrowed negative free reserves are called “net borrowed
reserves”reserves” they are an index of the Fed trying to tighten creditthey are an index of the Fed trying to tighten credit evidently the Fed was tightening credit sufficiently to evidently the Fed was tightening credit sufficiently to
contribute to the recessioncontribute to the recession
Note: Fed keeps excess reserves low during Note: Fed keeps excess reserves low during inflationary 70’s; opposite policy in the 90’sinflationary 70’s; opposite policy in the 90’s
Llad Phillips 59
Summary of Monetary PolicySummary of Monetary Policy Federal Reserve Needs to Avoid Bank Federal Reserve Needs to Avoid Bank
Panics and Bank FailurePanics and Bank Failure tool: FDICtool: FDIC tool: Bank Supervision & Educationtool: Bank Supervision & Education
Federal Reserve Needs to Keep the Federal Reserve Needs to Keep the Economy Healthy: Low Unemployment & Economy Healthy: Low Unemployment & Inflation RatesInflation Rates tool: Open Market Policy: Fed Sells Securities tool: Open Market Policy: Fed Sells Securities
to Decrease Commercial Bank Deposits and to Decrease Commercial Bank Deposits and Tighten CreditTighten Credit
Llad Phillips 60
More Review MaterialMore Review Material
Llad Phillips 61
Review: Lecture NineReview: Lecture Nine
Macroeconomic PolicyMacroeconomic Policy fiscal policyfiscal policy
Llad Phillips 62
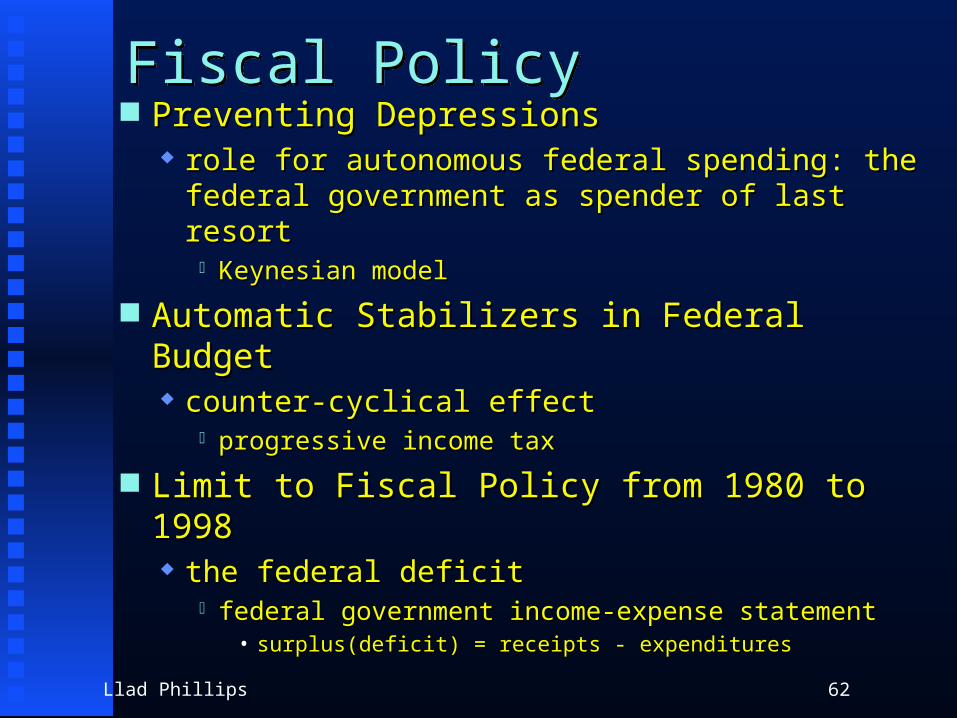
Fiscal PolicyFiscal Policy Preventing DepressionsPreventing Depressions
role for autonomous federal spending: the role for autonomous federal spending: the federal government as spender of last resortfederal government as spender of last resort
Keynesian modelKeynesian model
Automatic Stabilizers in Federal BudgetAutomatic Stabilizers in Federal Budget counter-cyclical effectcounter-cyclical effect
progressive income taxprogressive income tax
Limit to Fiscal Policy from 1980 to 1998Limit to Fiscal Policy from 1980 to 1998 the federal deficitthe federal deficit
federal government income-expense statementfederal government income-expense statement• surplus(deficit) = receipts - expendituressurplus(deficit) = receipts - expenditures
Llad Phillips 63
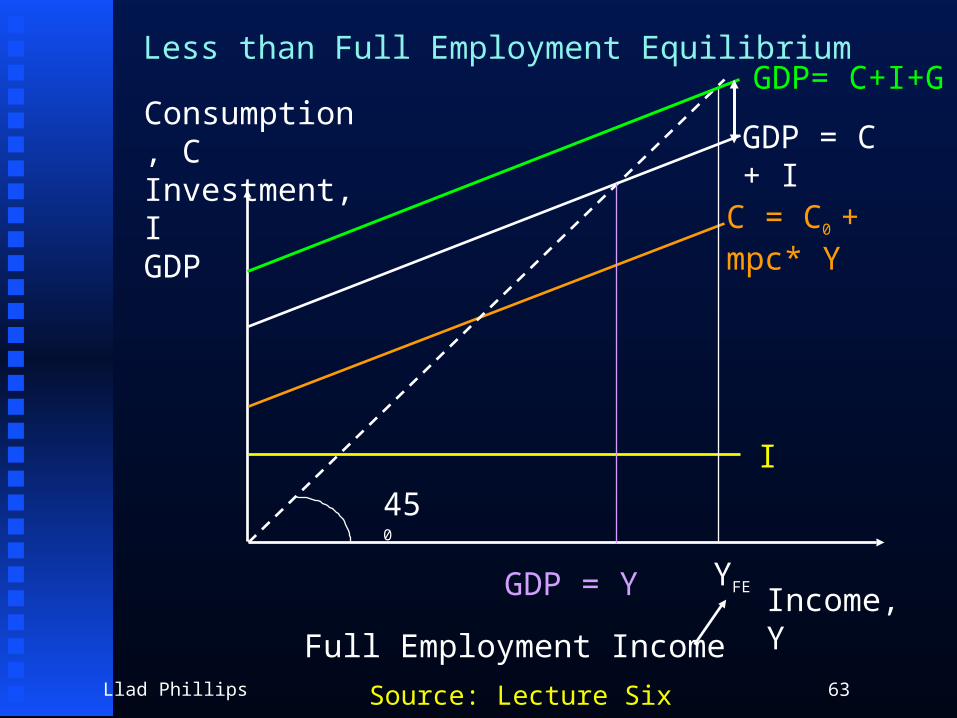
Consumption, CInvestment, IGDP
Income, Y
Less than Full Employment Equilibrium
C = C0 + mpc* Y
I
GDP = C + I
450
GDP = Y YFE
Full Employment Income
Source: Lecture Six
GDP= C+I+G
Llad Phillips 64
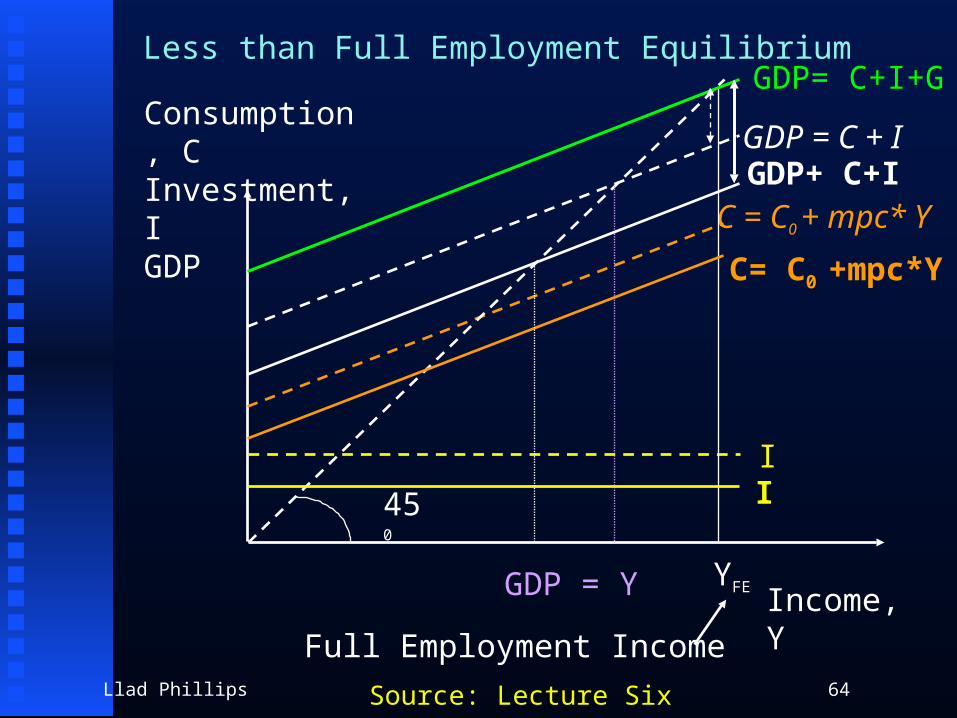
Consumption, CInvestment, IGDP
Income, Y
Less than Full Employment Equilibrium
C = C0 + mpc* Y
I
GDP = C + I
450
GDP = Y YFE
Full Employment Income
Source: Lecture Six
GDP= C+I+G
I
C= C0 +mpc*Y
GDP+ C+I
Llad Phillips 65
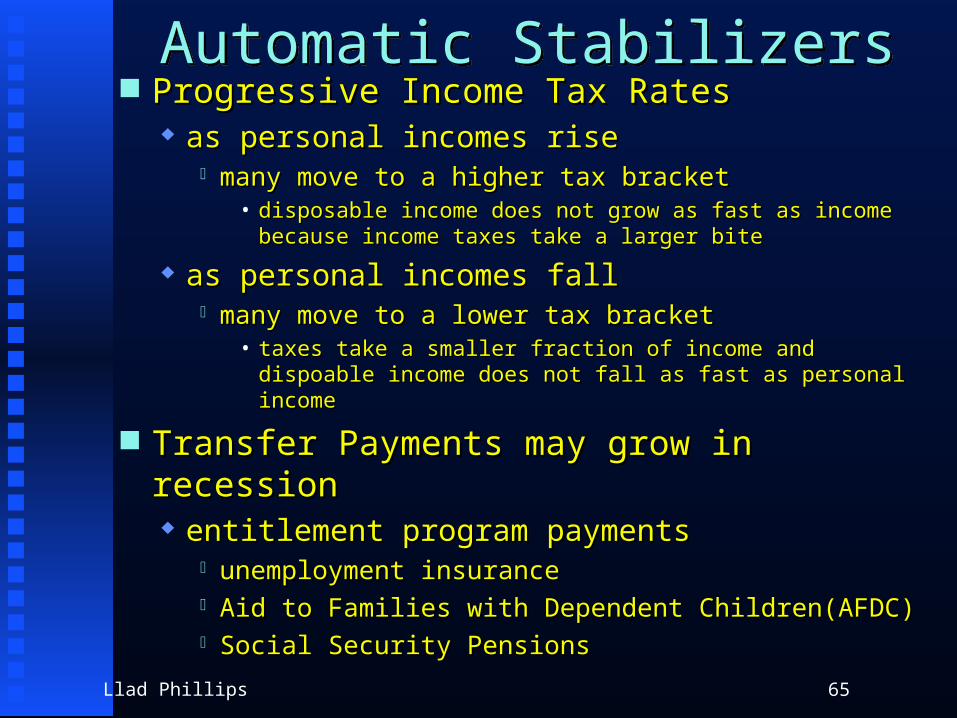
Automatic StabilizersAutomatic Stabilizers Progressive Income Tax RatesProgressive Income Tax Rates
as personal incomes riseas personal incomes rise many move to a higher tax bracketmany move to a higher tax bracket
• disposable income does not grow as fast as income disposable income does not grow as fast as income because income taxes take a larger bitebecause income taxes take a larger bite
as personal incomes fallas personal incomes fall many move to a lower tax bracketmany move to a lower tax bracket
• taxes take a smaller fraction of income and dispoable taxes take a smaller fraction of income and dispoable income does not fall as fast as personal incomeincome does not fall as fast as personal income
Transfer Payments may grow in recessionTransfer Payments may grow in recession entitlement program paymentsentitlement program payments
unemployment insuranceunemployment insurance Aid to Families with Dependent Children(AFDC)Aid to Families with Dependent Children(AFDC) Social Security PensionsSocial Security Pensions

Llad Phillips 66
Federal Surplus (Deficit) $ Millions
-350000
-300000
-250000
-200000
-150000
-100000
-50000
0
50000
100000
150000
1880 1900 1920 1940 1960 1980 2000 2020
Fiscal Year
Mil
lio
ns
Llad Phillips 67
Perspective:Is the economy growing less rapidly in the decade of the Nineties?Perspective:Is the economy growing less rapidly in the decade of the Nineties?
Growth in real GDP over timeGrowth in real GDP over time

Llad Phillips 68
Real GDP Billions 96$, 1929-1999
y = 8E-29e0.0369x
R2 = 0.9767
0
2000
4000
6000
8000
10000
12000
1920 1930 1940 1950 1960 1970 1980 1990 2000 2010
year
GD
P
Real GDP Billions 96$exponential trendline
Llad Phillips 69
Midterm ReviewMidterm Review O’Sullivan and SheffrinO’Sullivan and Sheffrin
Ch. 20, 21, 24, 25 , 27, 28, 30Ch. 20, 21, 24, 25 , 27, 28, 30
Llad Phillips 70
20: The Big Ideas in Macro20: The Big Ideas in Macro Circular FlowCircular Flow
Labor MarketLabor Market Goods MarketGoods Market
Measuring the Output of the EconomyMeasuring the Output of the Economy GDPGDP National IncomeNational Income
GDP: Is it a measure of welfare?GDP: Is it a measure of welfare?
Llad Phillips 71
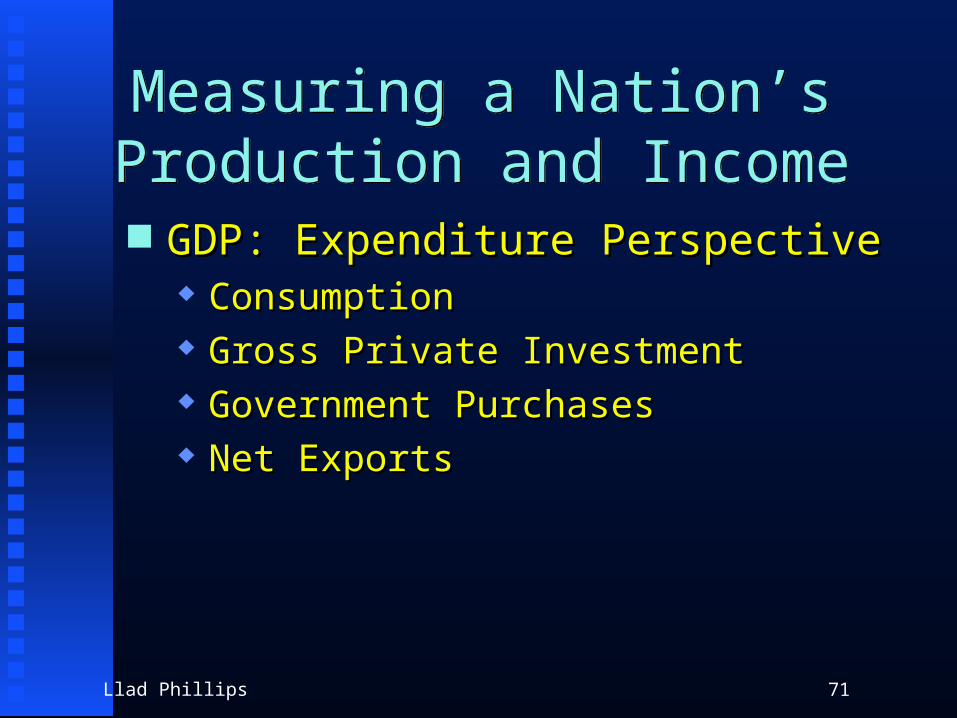
Measuring a Nation’s Production and Income
Measuring a Nation’s Production and Income
GDP: Expenditure PerspectiveGDP: Expenditure Perspective ConsumptionConsumption Gross Private InvestmentGross Private Investment Government PurchasesGovernment Purchases Net ExportsNet Exports
Llad Phillips 72
21: Unemployment and Inflation21: Unemployment and Inflation What is UnemploymentWhat is Unemployment Consumer Price Index (CPI)Consumer Price Index (CPI) Percentage Rate of Change of CPI: InflationPercentage Rate of Change of CPI: Inflation
Llad Phillips 73
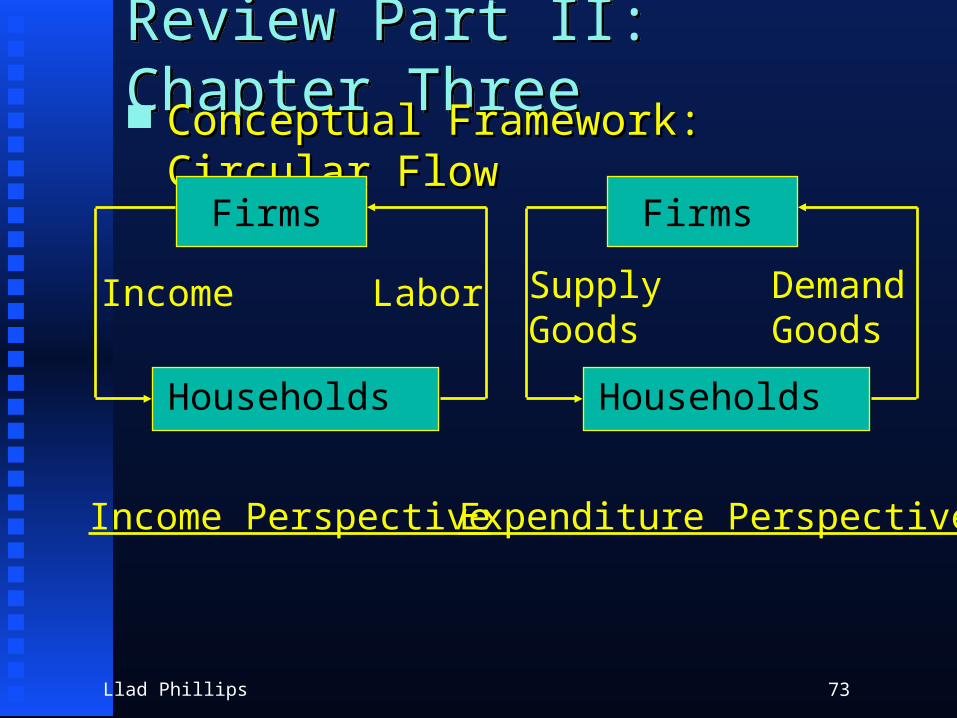
Review Part II: Chapter ThreeReview Part II: Chapter Three Conceptual Framework: Circular FlowConceptual Framework: Circular Flow
Firms
Households
Income Labor
Firms
Households
SupplyGoods
Demand Goods
Income Perspective Expenditure Perspective
Llad Phillips 74
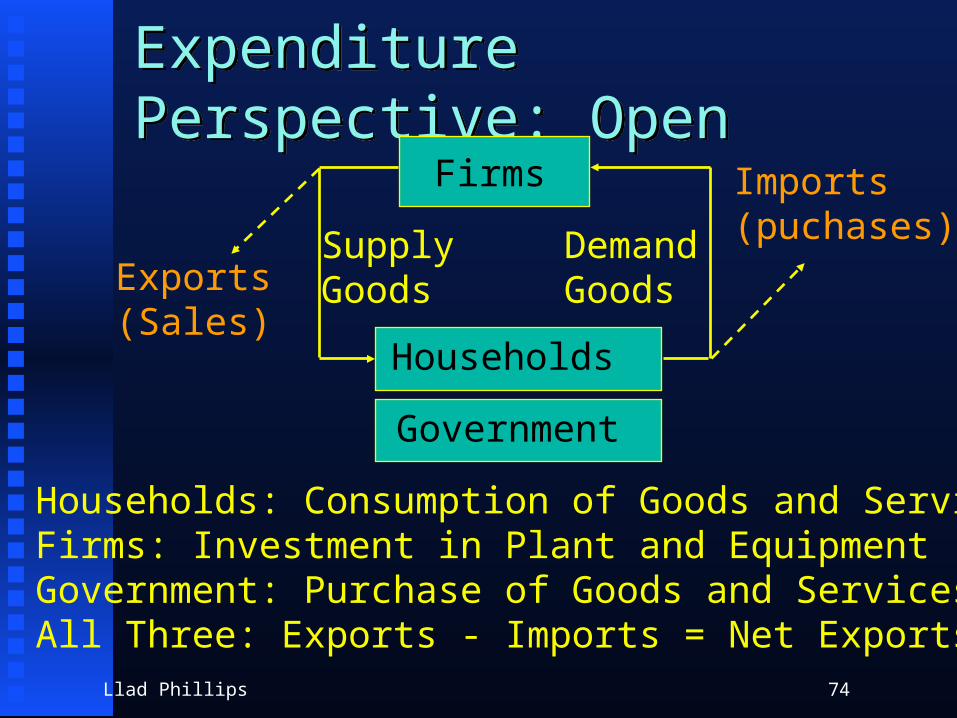
Expenditure Perspective: OpenExpenditure Perspective: Open
Firms
Households
SupplyGoods
Demand Goods
Households: Consumption of Goods and ServicesFirms: Investment in Plant and EquipmentGovernment: Purchase of Goods and ServicesAll Three: Exports - Imports = Net Exports
Imports(puchases)
Exports(Sales)
Government
Llad Phillips 75
21: Behind the Economic Statistics21: Behind the Economic Statistics Is a recession coming?Is a recession coming?
how would you figure that out?how would you figure that out?
Llad Phillips 76
21: Behind the Economic Statistics21: Behind the Economic Statistics Expenditure Perspective: GDPExpenditure Perspective: GDP
ConsumptionConsumption Gross Private InvestmentGross Private Investment Government PurchasesGovernment Purchases Net ExportsNet Exports
InflationInflation what is it?what is it? how do we measure it?how do we measure it? why is it a problem?why is it a problem?
Llad Phillips 77
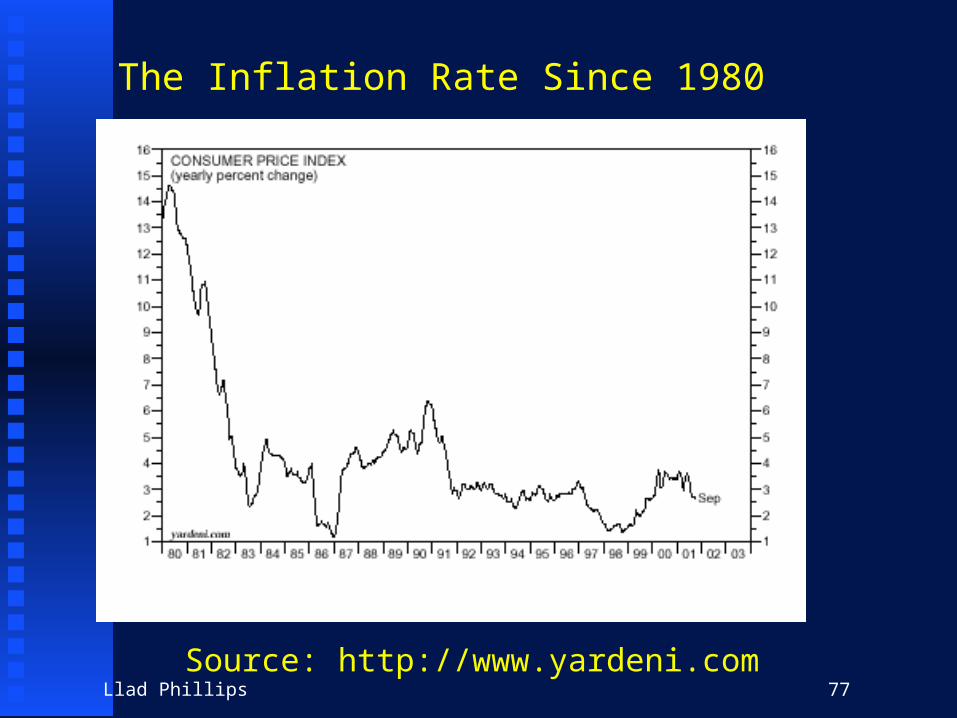
The Inflation Rate Since 1980
Source: http://www.yardeni.com
Llad Phillips 78
21: Behind the Economic Statistics21: Behind the Economic Statistics Expenditure Perspective: GDPExpenditure Perspective: GDP
ConsumptionConsumption Gross Private InvestmentGross Private Investment Government PurchasesGovernment Purchases Net ExportsNet Exports
InflationInflation what is it?what is it? how do we measure it?how do we measure it? why is it a problem?why is it a problem?
UnemploymentUnemployment
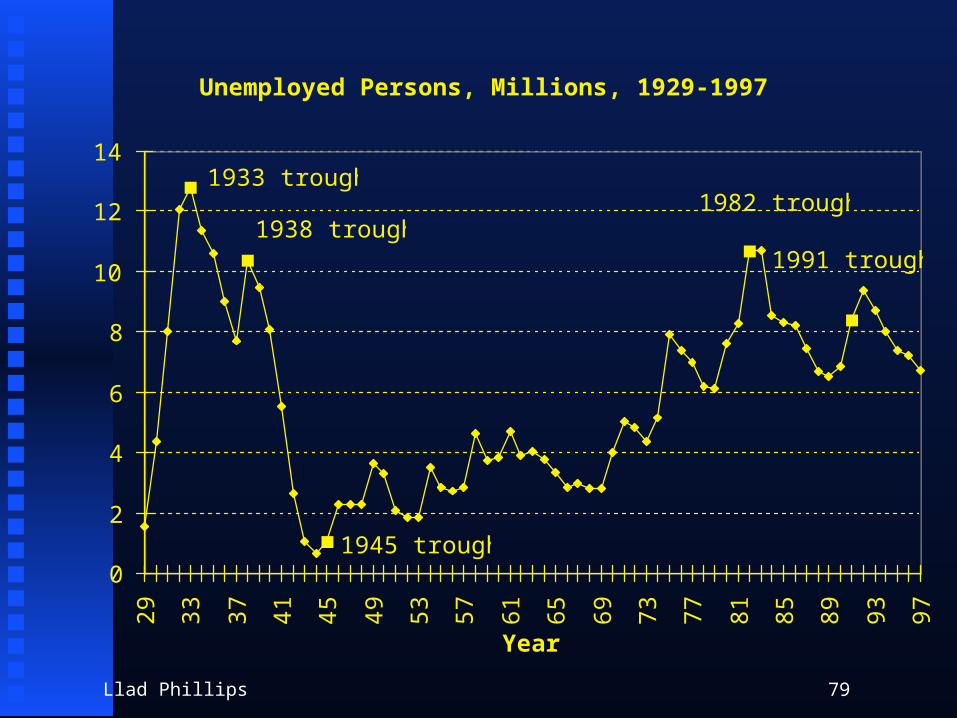
Llad Phillips 79
Unemployed Persons, Millions, 1929-1997 .
1982 trough
1991 trough
1945 trough
1938 trough
1933 trough
0
2
4
6
8
10
12
1429
33
37
41
45
49
53
57
61
65
69
73
77
81
85
89
93
97
Year
Million
s
Llad Phillips 80
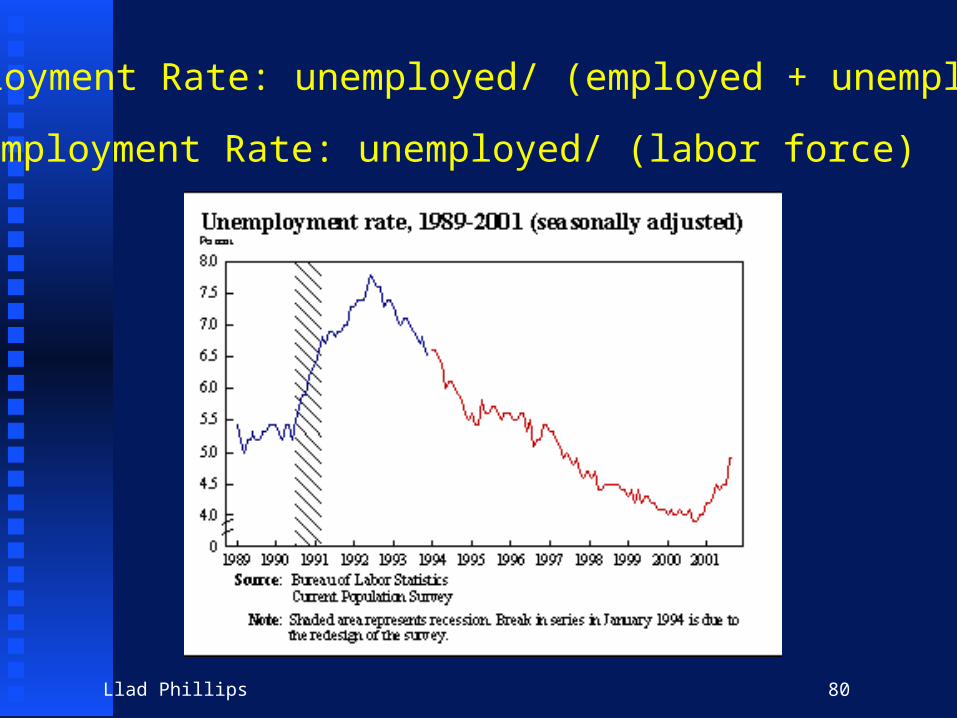
Unemployment Rate: unemployed/ (employed + unemployed)
Unemployment Rate: unemployed/ (labor force)
Llad Phillips 81
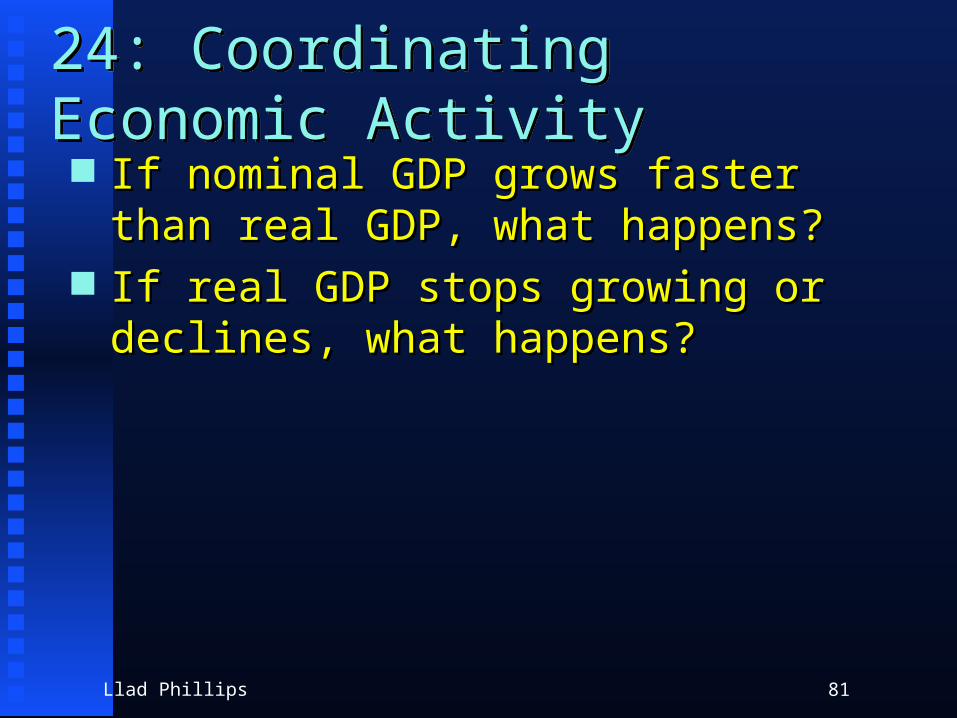
24: Coordinating Economic Activity24: Coordinating Economic Activity If nominal GDP grows faster than real GDP, If nominal GDP grows faster than real GDP,
what happens?what happens? If real GDP stops growing or declines, what If real GDP stops growing or declines, what
happens?happens?
Llad Phillips 82
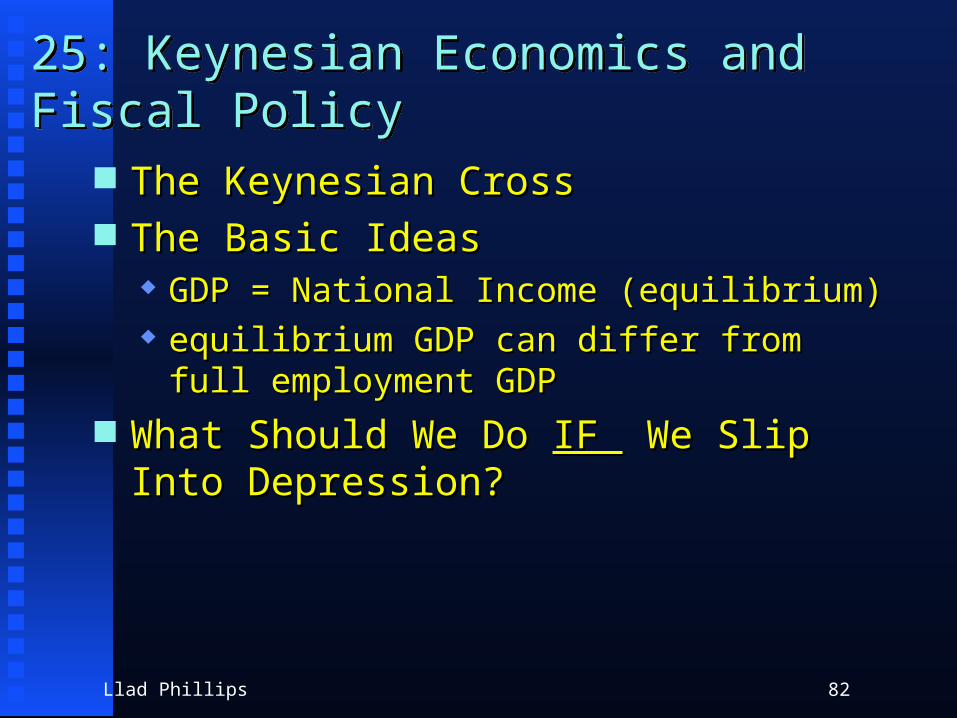
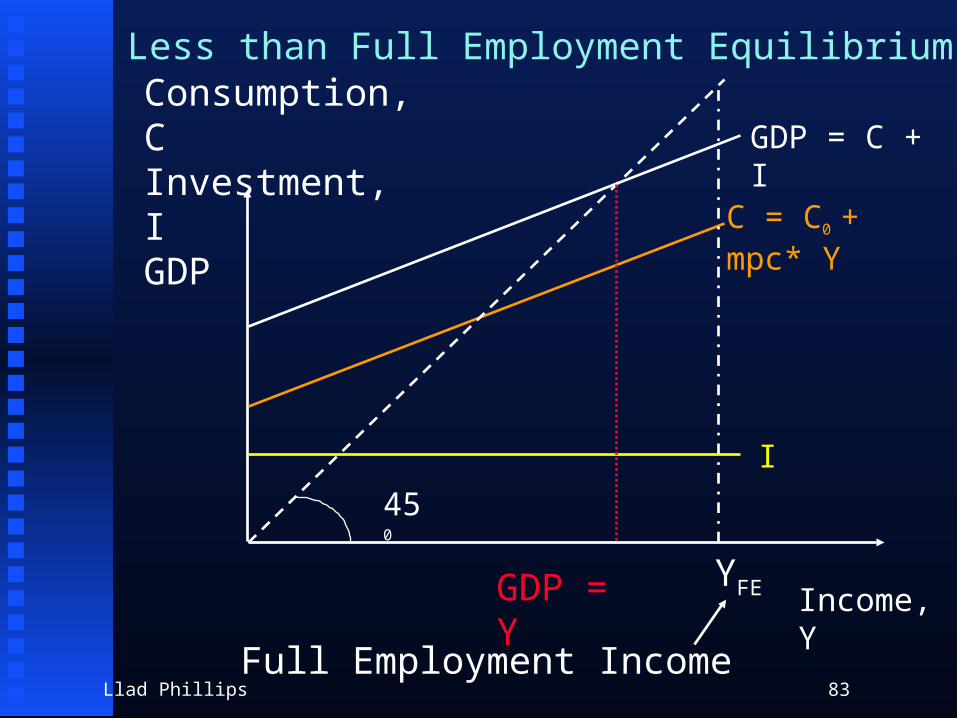
25: Keynesian Economics and Fiscal Policy25: Keynesian Economics and Fiscal Policy
The Keynesian CrossThe Keynesian Cross The Basic IdeasThe Basic Ideas
GDP = National Income (equilibrium)GDP = National Income (equilibrium) equilibrium GDP can differ from full equilibrium GDP can differ from full
employment GDPemployment GDP What Should We Do What Should We Do IF IF We Slip Into We Slip Into
Depression?Depression?
Llad Phillips 83
Consumption, CInvestment, IGDP
Income, Y
Less than Full Employment Equilibrium
C = C0 + mpc* Y
I
GDP = C + I
450
GDP = Y YFE
Full Employment Income
Llad Phillips 84
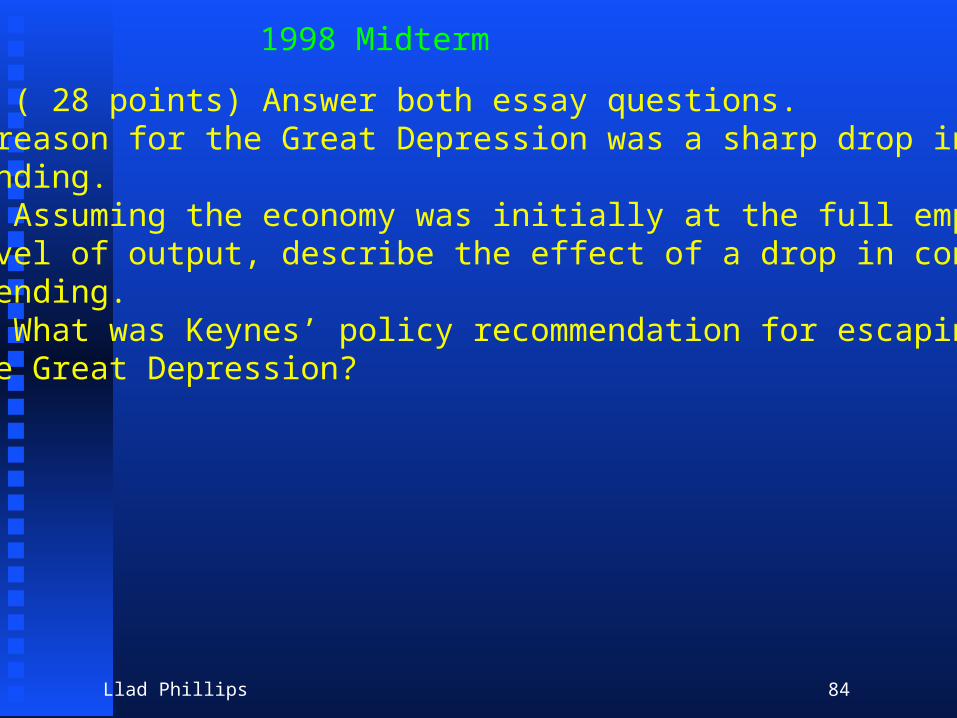
Part IV ( 28 points) Answer both essay questions.1. One reason for the Great Depression was a sharp drop in consumer spending.
a. Assuming the economy was initially at the full employment level of output, describe the effect of a drop in consumer spending.b. What was Keynes’ policy recommendation for escaping from the Great Depression?
1998 Midterm
Llad Phillips 85
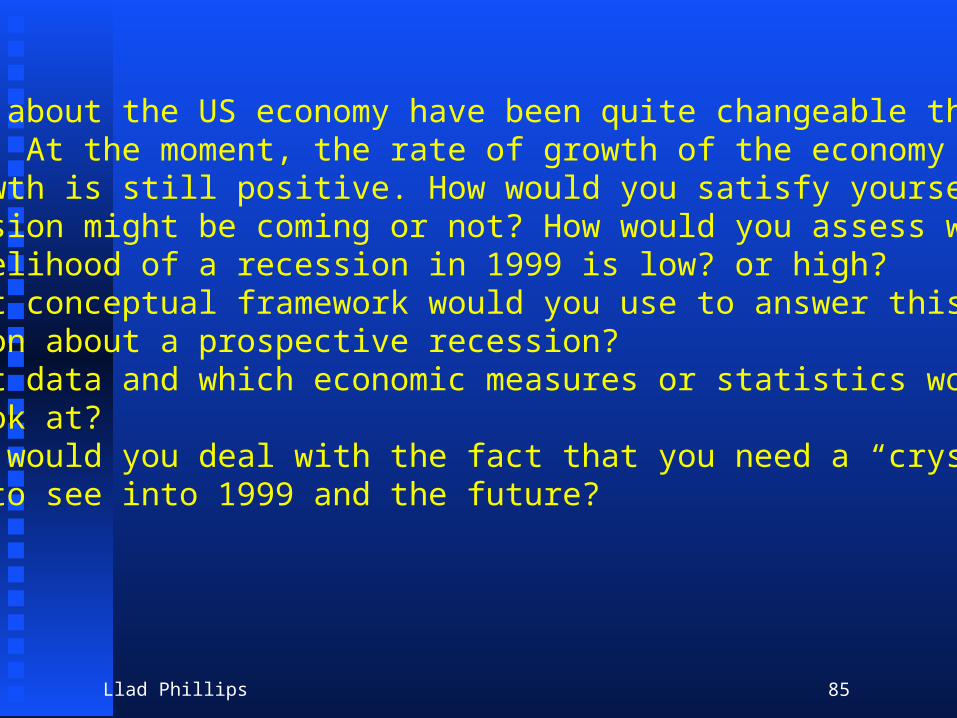
2. Opinions about the US economy have been quite changeable this Fall quarter. At the moment, the rate of growth of the economy is slowing, but growth is still positive. How would you satisfy yourself whether a recession might be coming or not? How would you assess whether the likelihood of a recession in 1999 is low? or high?
a. What conceptual framework would you use to answer this question about a prospective recession?b. What data and which economic measures or statistics would you look at?c. How would you deal with the fact that you need a “crystal
ball” to see into 1999 and the future?
Llad Phillips 86
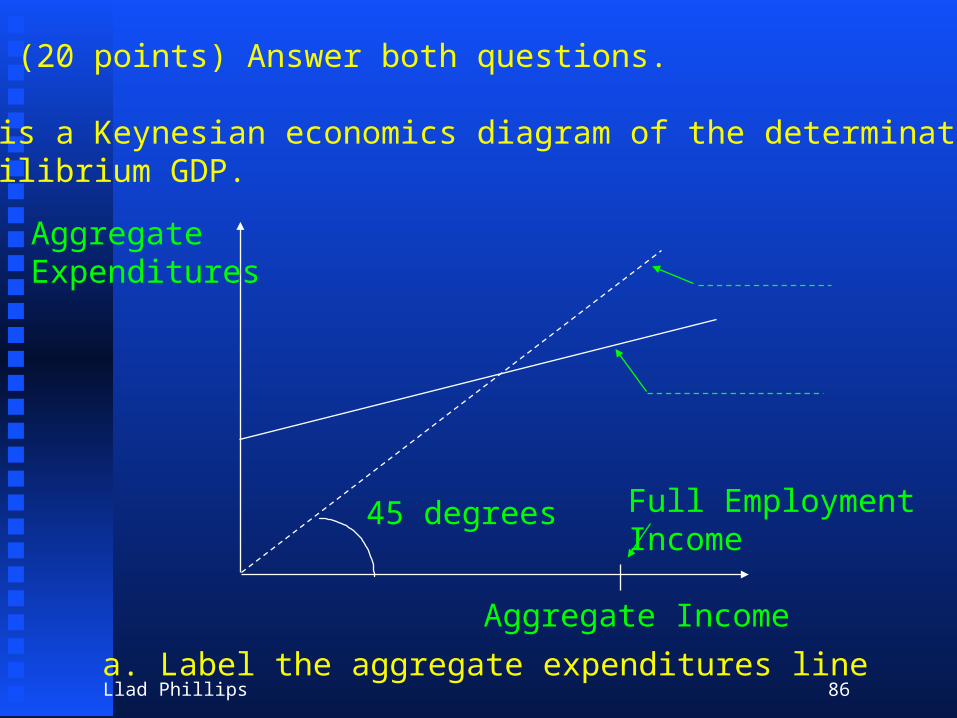
Part III (20 points) Answer both questions.
1. This is a Keynesian economics diagram of the determination of equilibrium GDP.
Aggregate Expenditures
Aggregate Income
a. Label the aggregate expenditures line
Full Employment Income
45 degrees
Llad Phillips 87
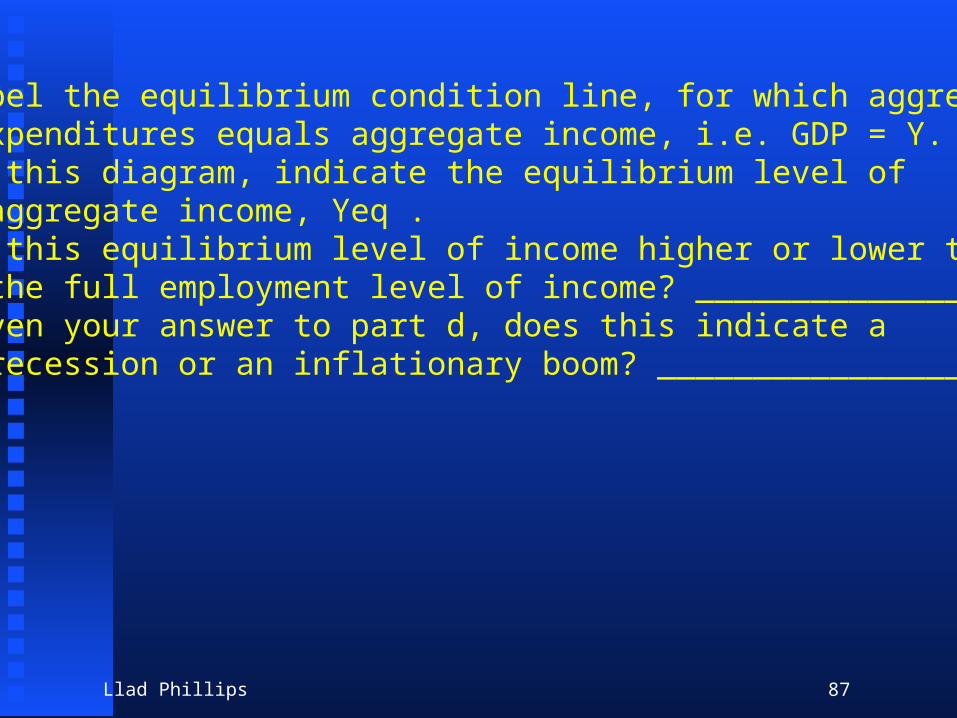
b. Label the equilibrium condition line, for which aggregate expenditures equals aggregate income, i.e. GDP = Y.c. On this diagram, indicate the equilibrium level of
aggregate income, Yeq .d. Is this equilibrium level of income higher or lower than
the full employment level of income? ________________.e. Given your answer to part d, does this indicate a
recession or an inflationary boom? ____________________.
Llad Phillips 88
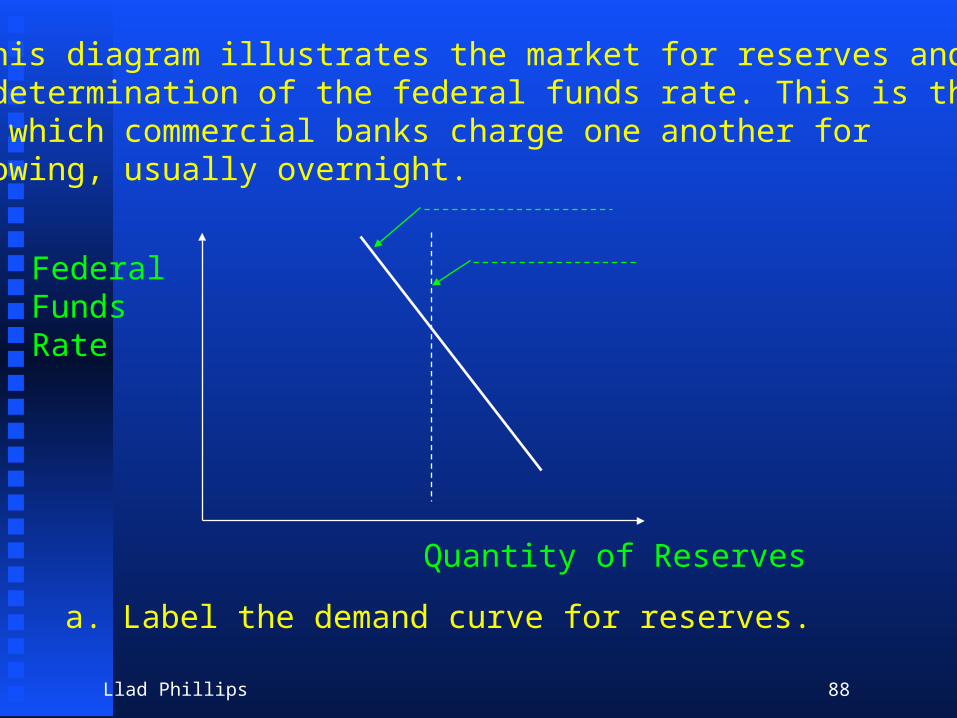
2. This diagram illustrates the market for reserves and the determination of the federal funds rate. This is the rate which commercial banks charge one another for borrowing, usually overnight.
FederalFundsRate
Quantity of Reserves
a. Label the demand curve for reserves.
Llad Phillips 89
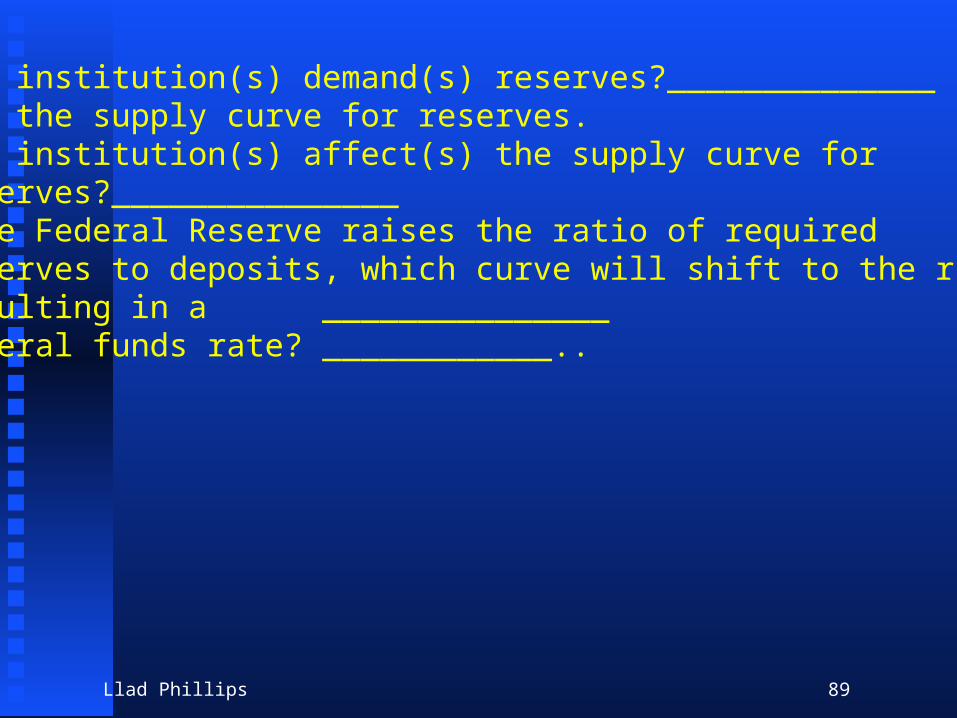
b. Which institution(s) demand(s) reserves?______________c. Label the supply curve for reserves.d. Which institution(s) affect(s) the supply curve for reserves?_______________e. If the Federal Reserve raises the ratio of required reserves to deposits, which curve will shift to the right,
resulting in a _______________ federal funds rate? ____________..