Embed Size (px)
Citation preview
Physical water poverty, energy crisis, development setbacks and DESERTEC
Introduction to
DESERTEC in MENA

TOPICS
Facts: Water
Crisis: Energy & Present Solution
Economics: Let’s Talk Money
Crisis: Water
Stress & Possible Solution

Source: NASA APOD 4

Land 30%
Sea Water 67.9%
Fresh Water 2.1%
Lakes 87%
Swamps 11%
Rivers 2%
Icecaps & Glaciers 68.7%
Ground Water 30.1%
Other 0.9%
Surface Water 0.3%
Data from: US-Geological Survey
6

What is the indicator of Drinkable water?
• Salinity:
salt concentration in water
Bine water
10.000 – 35.000ppm
Fresh water
<1.000ppm
7
Source: Wikimedia Commons

6 – 6.5 grams
1.000ppm of salt == 1ppt == 1g/L
8

Water is there, why all the fighting over it?
Source: Worldwater.org 9

Source: Worldwater.org
Notable crisis caused over water in the MENA region:
1951: Syrian-Israeli fight over Yarmouk River after the Jordanian plans made public to irrigate the Jordan valley.
1958: Egypt and Sudan clash over Nile.
1967: Israel attacks Jordan water canal.
1999-2000: African Nations fight over Zambezi island, in the Zambezi/Chobe river.
10

Water
11 Source: University of Texas Libraries
• Almost all underground wells in the MENA region (97% for Egypt) are either exploited or suffer from increased Salinity which affects the ecosystem and render the water source useless.
• In Saudi Arabia water costs more than car fuel. With almost 1,5Mio barrels of oil being burned daily for the production of drinking water from sea water. Known fact, Oil is cheaper than Water in Saudi Arabia.
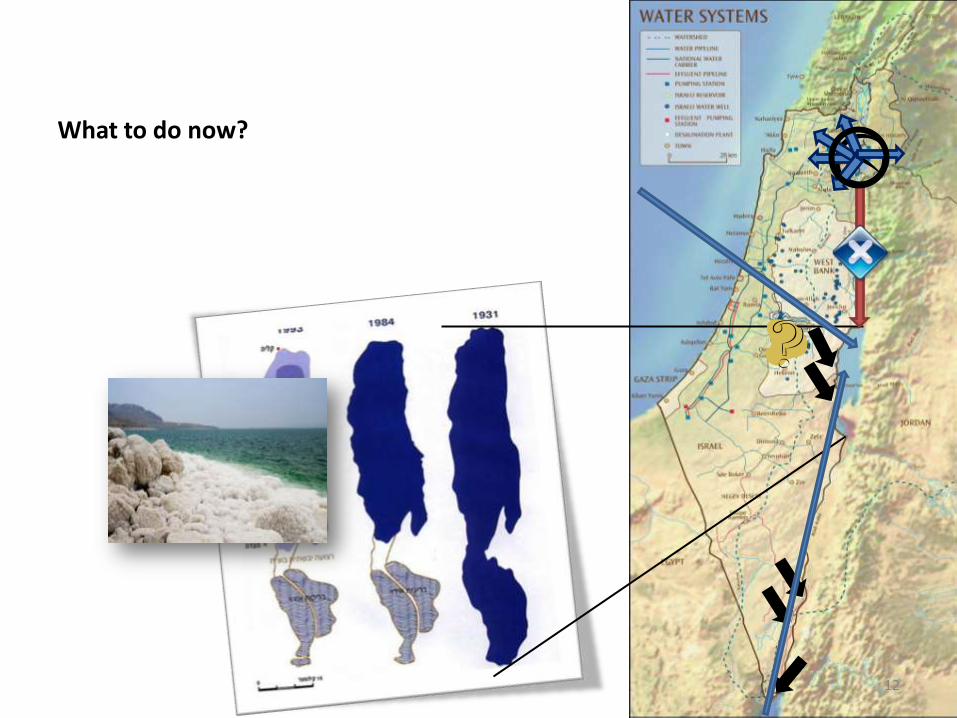
What to do now?
12

The Development Paradox • Energy is needed for the industrial
sector to function properly, so little energy is channeled to water production and treatment plants which in turn means that little water channeled for agriculture and industry.
Water
Develop-ment
Energy
Solution??!!!
13


Energy harvesting technologies in Desertec:
15

Energy harvesting technologies in Desertec:
16

Desertec provides solution
17
"TRANS-CSP Mix EUMENA 2050" indicates the surface needed for solar collectors to realize DESERTEC in EU-MENA (according to the TRANS-CSP scenario by German Aerospace Center DLR). This way the needs for seawater desalination and about two-thirds of the rising electricity consumption in the MENA region could be provided and about 17 percent of the European electricity consumption in 2050 (2,940 TWh/a, 120x120 km² in total)

Desertec provides solution
18
Source: DLR

Example:
• According to DLR; Jordan: Power Demand by 2050 = 52.6TWh/a == 6GW power plant; (x3.5, 2010 Demand)
Technical Potential = 5885TWh/a
Economic Potential = 5884TWh/a
19
Übermittlung und Komprimierung für die nahtlose Zustellung

Physical Water Scarcity??
Water Resource Development is approaching or has exceeded sustainable limits.
21 Source: Chartsbin.com
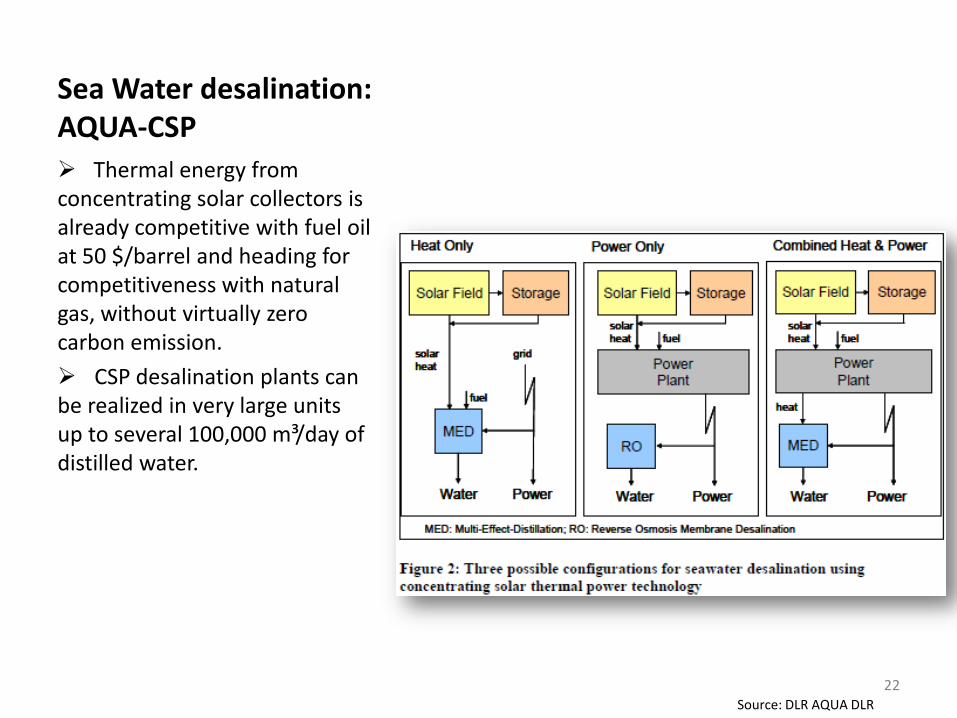
Sea Water desalination: AQUA-CSP
Thermal energy from concentrating solar collectors is already competitive with fuel oil at 50 $/barrel and heading for competitiveness with natural gas, without virtually zero carbon emission.
CSP desalination plants can be realized in very large units up to several 100,000 m³/day of distilled water.
22 Source: DLR AQUA DLR

Desalination plant technologies:
Technology Units share to total global installed*
Typical production per unit per day
Energy requirement exclusing pretreatment, brine and water transport
Reverse osmosis Very high (standalone units found near to saline well in dry regions) 20.000 m3/day
3.5-5.5 kWhe/m3
Multi-stage flash distillation
High** 76.000 m3/day
23-27 kwht/m3 of high temperature (almost 3-4 kWhe/m3)
Multi-efffect distallation
Low 36.000 m3/day
1,5 kWhe/m3 and low temperature 60-100 kWht/m3 (almost 3.5-5.5 kWhe/m3)
Electrodialysis Lowest 24.000 m3/day * 15.000 desalination units available for sea water desalination to produce around 40Mio.m3 of fresh water per day to cover the need of only 500Mio. people. For every m3 water produced by distillation, 12kg of CO2 released in process. ** In term of units, the RO has more installed units, in term of total capacity, MSF is installed for mass production of distilled water.
23
Source: MENA Regional Water Outlook; DLR; GE Water& Process Technology
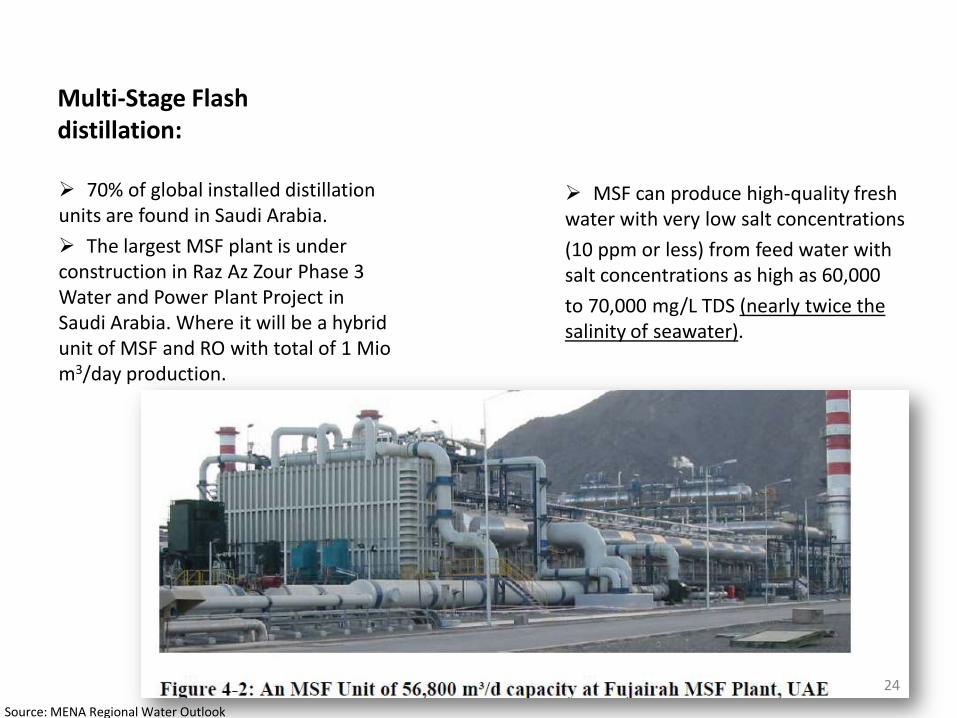
Multi-Stage Flash distillation:
70% of global installed distillation units are found in Saudi Arabia.
The largest MSF plant is under construction in Raz Az Zour Phase 3 Water and Power Plant Project in Saudi Arabia. Where it will be a hybrid unit of MSF and RO with total of 1 Mio m3/day production.
24
MSF can produce high-quality fresh water with very low salt concentrations
(10 ppm or less) from feed water with salt concentrations as high as 60,000
to 70,000 mg/L TDS (nearly twice the salinity of seawater).
Source: MENA Regional Water Outlook

Multi Effect Distillation:
25
Source: MENA Regional Water Outlook

Sea Water Reverse Osmosis:
26
Source: MENA Regional Water Outlook

Übermittlung und Komprimierung für die nahtlose Zustellung

28
Unit
Macro-Regions
Mediterranean Sea & Atlantic Ocean
Red Sea & Indian Ocean
Arabian Gulf
TDS ppm 39.000 43.000 46.000
Seawater design temperature ⁰C 25 30 35
Unit electricity price from the local grid
US$/kWh 0.079 0.041
Specific CAPEX TUS$/m3d 1.75-2.41 1.95-2.41
Specific Electricity consumption
kWh/m3 3.5-4.0 3.7-4.2 4.2-4.3
Energy consumption US$/m3 0.28-0.32 0.15-0.17 0.17-0.18
Specific OPEX_ without energy consumption
US$/m3 0.29-0.38 0.30-0.39 0.34-0.40
Total Price US$/m3 0.57-0.70 0.45-0.56 0.51-0.58
Prices (SWRO):
Source: MENA Regional Water Outlook

29
Prices:
Source: MENA Regional Water Outlook
The advances have driven prices down from an average of US$1/m3 in 1999 to between US$0.5/m3 and US$0.8/m3 in 2004 (World Bank 2004).
Source: University of Tunisia, Belloumi.ppt

30

Backup #1:
31 Source: Arab Forum For Environment & Development

32
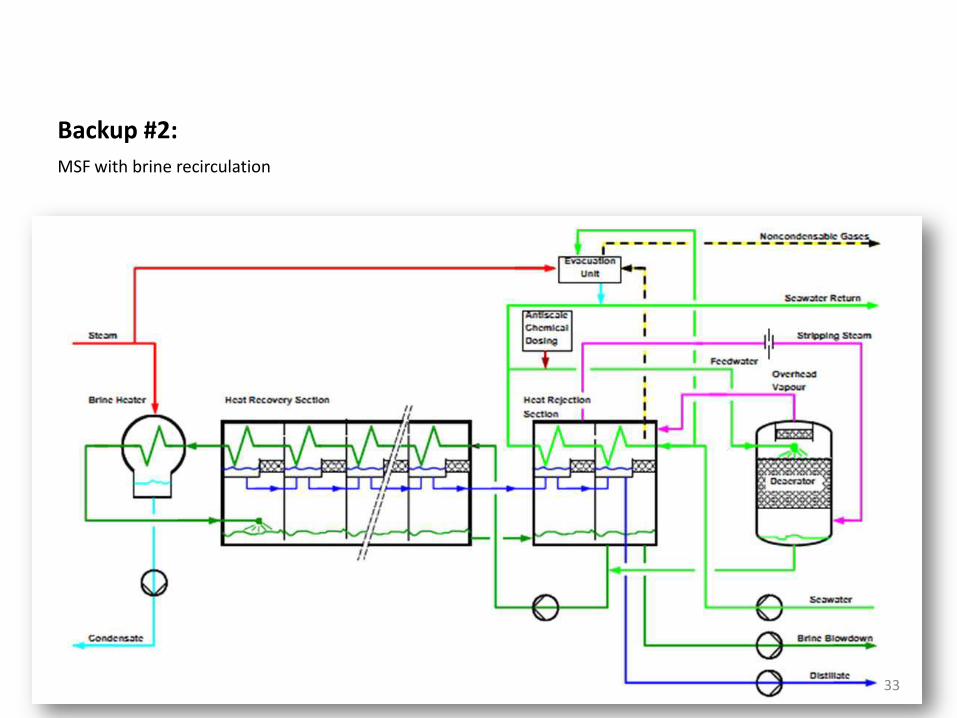
Backup #2:
MSF with brine recirculation
33

Backup #3:
34
Source: RDL
CSP CSP-MED

Backup #4:
35
Source: RDL
CSP/RO on coast CSP/RO inland