Embed Size (px)
Citation preview

Introduction to Coal Bed MethaneAugust 27, 2003

Coal Bed Methane: What is it? Where is it?


Coal Basins and CBM In-place
Reserves

Outcrop Geology and
Tertiary Coals of the Powder
River Basin

Environments of Coal Deposition
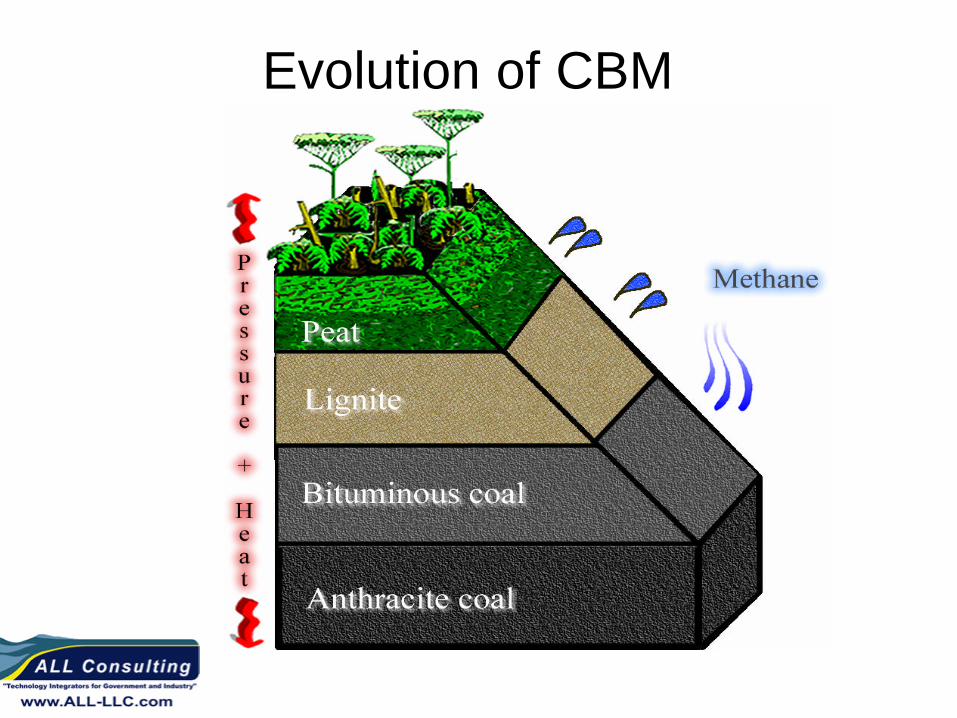
Evolution of CBM

Methane in Coal
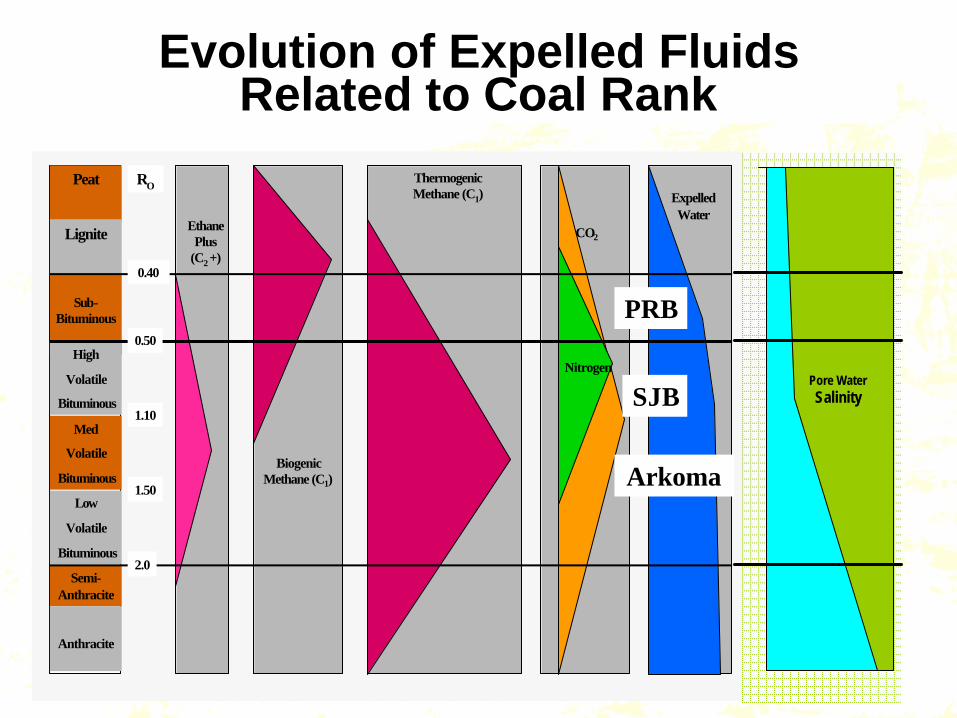
Evolution of Expelled Fluids Related to Coal Rank
Peat
Lignite
Sub-Bituminous
High
Volatile
Bituminous
Med
Volatile
Bituminous
Low
Volatile
Bituminous
Semi-Anthracite
Anthracite
Ethane Plus
(C2 +)
BiogenicMethane (C1)
Thermogenic Methane (C1)
CO2
Nitrogen
Expelled Water
RO
0.40
0.50
2.0
1.50
1.10SJB
PRB
Pore Water Salinity
Arkoma

Frontier Formation - Lignite
Lance Formation – Sub-Bituminous
Mesa Verde Formation – High-Volatile Bituminous
Water, Nitrogen
Water, Methane
Methane, CO2
Coal Fluids and Depth

Coal Bed Methane: How Do You Get it Out?

Typical Hard Coal Completions
Cherokee Basin (KS) Arkoma Basin (OK)

Typical CBM
Completion(Powder River
Basin)

CBM Production Characteristics
Methane is held in place by reservoir water pressure.
To produce methane, water is drawn off.

¤
¤
¤
¤
¤
¤
?
?
¤
¤
¤Tribal Minerals, No CBM Development
Fee Minerals, No CBM Development
Federal Minerals, CBM Development
Drainage Radius
Producing Wells
Injection Wells
Hydraulic Barrier
CBM Drainage and Drainage Control
B
B’
A
A’

Lease Boundary
Production Well
Productive Coal Seam
Water Level
On-Lease and Off-Lease Drainage
A A’
De-Pressurization and CBM Drainage
Claystone
Claystone
Silty Claystone
Claystone
Claystone

Lease Boundary
Injection Well Production Well
Productive Coal Seam
Water Level
Hydraulic Barrier to Control Drainage
B B’
Claystone
Sandy Claystone
Claystone
Claystone
Claystone
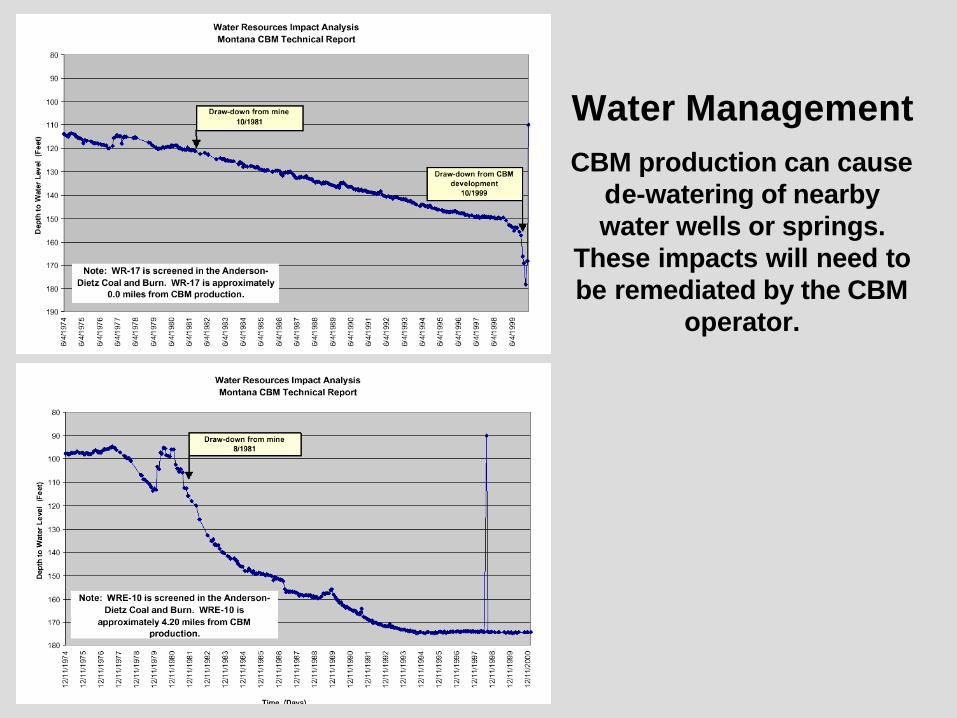
Water ManagementCBM production can cause
de-watering of nearby water wells or springs.
These impacts will need to be remediated by the CBM
operator.

Natural Gas Production Characteristics: Conventional Reservoir vs CBM

DE
PT
H
0’
7,500’
San Juan BasinVertical,
horizontal, and multi-lateral wells; and
multiple completions
PiceanceBasin
Vertical and horizontal
wells, single or multiple
completions
Raton Basin
Vertical wells, multiple
completions
Powder River BasinVertical
wells, single completions
Greater Green River Basin
Vertical wells
Uinta Basin
Vertical wells, single or multiple
completions
CBM Drilling and Completion Technology Options
5,000’
2,500’

Coal Depths and CBM
In the Powder River Basin, coals range in depths to below 2500’ but cleat reduces with depth and the majority of CBM is produced at shallower depths. At the same time, many coals outcrop at the surface but many
shallow coals have undergone burning and most have expelled their methane.

CBM Basins and Maximum
Producing Depth

Sources: PTTC Rockies 2000, GTI 2000, EPA 2002, USGS 2000, CO, NM, WY, MT Oil and Gas Commissions, Williams 2001,
180 Mscf/day625 Mscf/day300 Mscf/day800 Mscf/dayAverage Well Gas Production Rate
0.4 Bcf1.5 Bcf1.8 Bcf10 BcfAverage Well Reserves
$75,000$375,000$330,000$275,000Average Well Cost
80 acres160 acres160 acres320-160 acresWell Spacing
50 scf/ton250-400 scf/ton50-400 scf/ton350-450 scf/tonGas Content
75 feet10-40 feet20-80 feetNet Coal Thickness
200-25002000-7000400-4000550-4000Well Depth (feet)
Sub-bituminoushigh-volatile bituminoushigh-volatile bituminousSub-bituminousCoal Rank
400 Bbl/day215 Bbl/Day266 Bbl/day25 Bbl/dayAverage water Production per well
Electric Pump and Progressive CavityRod PumpProgressive Cavity and
Rod PumpRod PumpWater Lift Method
Surface Discharge, Beneficial Use
Deep InjectionDeep InjectionInjectionPrimary Water Disposal Methods
10,3585586942,550Producing Wells
Open-holeUnder-ream
Cased Hole Perforate/Multistage
X-Link/Sand
Cased Hole Perforate/Multistage
N2 Foam/Sand
Cased HolePerforate/MultistageCompletion Methods
Air-WaterAir PercussionAir PercussionAir PercussionDrilling Method
WY, MTUTNM, CONM, COState Location
Powder RiverUintaRatonSan JuanBasin
Comparison of Producing CBM Basins in the Rocky Mountain Region

CBM Produced Water: Management Options

CBM Wells and Water Wells in
the Powder River Basin

CBM and Water Management

CBM and Water ManagementEXHIBIT 22 - GROUNDWATER QUALITY FOR THE MONTANA PORTION OF THE POWDER RIVER BASIN Selected groundwater quality data collected from water supply wells located throughout Montana PRB
JUDITH RIVER FORMATION
HELL CREEK /FOX HILLS FORMATION
FORT UNION FORMATION
QUATERNARY ALLUVIUM
County Avg. TDS (mg/L)
Avg. SAR
Avg. TDS
(mg/L)
Avg. SAR
Avg. TDS
(mg/L)
Avg. SAR
Avg. TDS
(mg/L)
Avg. SAR
Big Horn 936 54 1440 14 1658 8 2118 5
Rosebud 2465 31 1376 35 1595 16 1516 9
Powder River No data
No data 890 35 1882 15 2783 5
Custer No data No data
896 37 1810 31 1665 8
Treasure 2312 64 1985 56 1782 32 2437 10
Weighted Average 2100 42 1148 37 1892 18 2014 7
Note: Avg. TDS = Average Total Dissolved Solids, Avg. SAR = Average Sodium Adsorption Ratio

CBM and Water Management
ANALYTE
NATIONAL DRINKING
WATER STANDARDS
(primary unless noted)
MT. WATER QUALITY STDS. FOR
LIVESTOCK PPM
(MSU 2001)
CX RANCH AVERAGE (MDEQ,
2000)
TDS mg/L 500 (secondary)
10,000 1,400
SAR 47 Sodium mg/L 558
Ammonia, Total mg/L
2.0
Chloride mg/L 250 (secondary)
19
Fluoride mg/L 2.0 (secondary)
2 2.5
Sulfate mg/L 250 (secondary)
Aluminum, total mg/L
0.05 to 0.2 (secondary)
5 0.05
Arsenic mg/L 0.05 0.2 0.001 Barium mg/L 2.0 0.5
Beryllium mg/L 0.004 0.0005 Boron mg/L 5 0.07
Cadmium mg/L 0.005 0.05 Chromium mg/L
0.1 1
Copper mg/L 1.0 (secondary)
0.5 0.001
Lead mg/L 0.015 0.05 0.002 Iron,
dissolved mg/L 0.3 0.03
Iron, total mg/L 0.125 Manganese mg/L 0.05 0.01
Mercury mg/L 0.002 0.1 Selenium mg/L 0.05 0.5 Strontium mg/L 0.43 Radium mg/L 5 pCi/L 0.2
Vanadium mg/L 0.1 Zinc mg/L 5
(secondary) 24
CBM produced water from Montana shows some exceedances of drinking
and livestock standards. Total Dissolved Solids (TDS) is exceeded for humans but is acceptable for livestock in the state of Montana.
Fluoride is exceeded for both humans and livestock.
The Sodium Adsorption Ratio (SAR) is important as a limiting factor for
soil condition and sodium is a limiting factor for plant growth.
Both constituents limit the use of this particular water for irrigation
although water management can mitigate deleterious effects.

CBM and Water Management

CBM Water HandlingOptions and Costs
$1.00/Bbl Hauling
$0.20/Bbl Deep Injection
$0.02/Bbl Surface Discharge

Treatment Processes
• Reverse Osmosis (RO)• Electrodialysis Reversal (EDR)• Ion Exchange• Freeze Thaw Evaporation• Artificial Wetlands• Land-Based Wastewater Treatment• Emerging Technologies
– Capacitive Desalination (CDT or EWP)– Rapid Spray Distillation

CDT Technology: a New SolutionCDT Technology: a New Solution• “Capacitive Deionization Technology™”
– Invented and patented by Lawrence Livermore National Laboratory
• $40+ Million DOE investment
• 10 years in development
– Currently being developed commercially under license by CDT Systems, Inc.
• Operating Principle - Flow Through Capacitor
– Liquid flows between high surface area electrode pairs having a potential difference of 1.3 vdc.
– Ions and other charged particles are attracted to and held on the electrode of opposite charge for later release into a rinse stream.
Positive electrode attractsnegatively charged ions (anions)
Chloride (Cl)Nitrate (NO3)Silica (SiO2)
Negative electrode attractspositively charged ions (cations)
Calcium (Ca)Magnesium (Mg)Sodium (Na)

COAL
SHALE
SANDSTONE
CBM
CLAYSTONE
Downhole Gas/WaterSeparator

CBM Development: An Attractive Component of
America’s Energy Mix