Embed Size (px)
Citation preview

Introduction to Clustering
Dilan GörürUniversity of California, Irvine
June 2011iCAMP summer project

Outline
• What is machine learning?
• What is clustering?
• Example application areas
• Challenges
• Approaches
‣ K-Means
‣ K-Medoids / Affinity propagation
‣ Linkage
• Implementation details
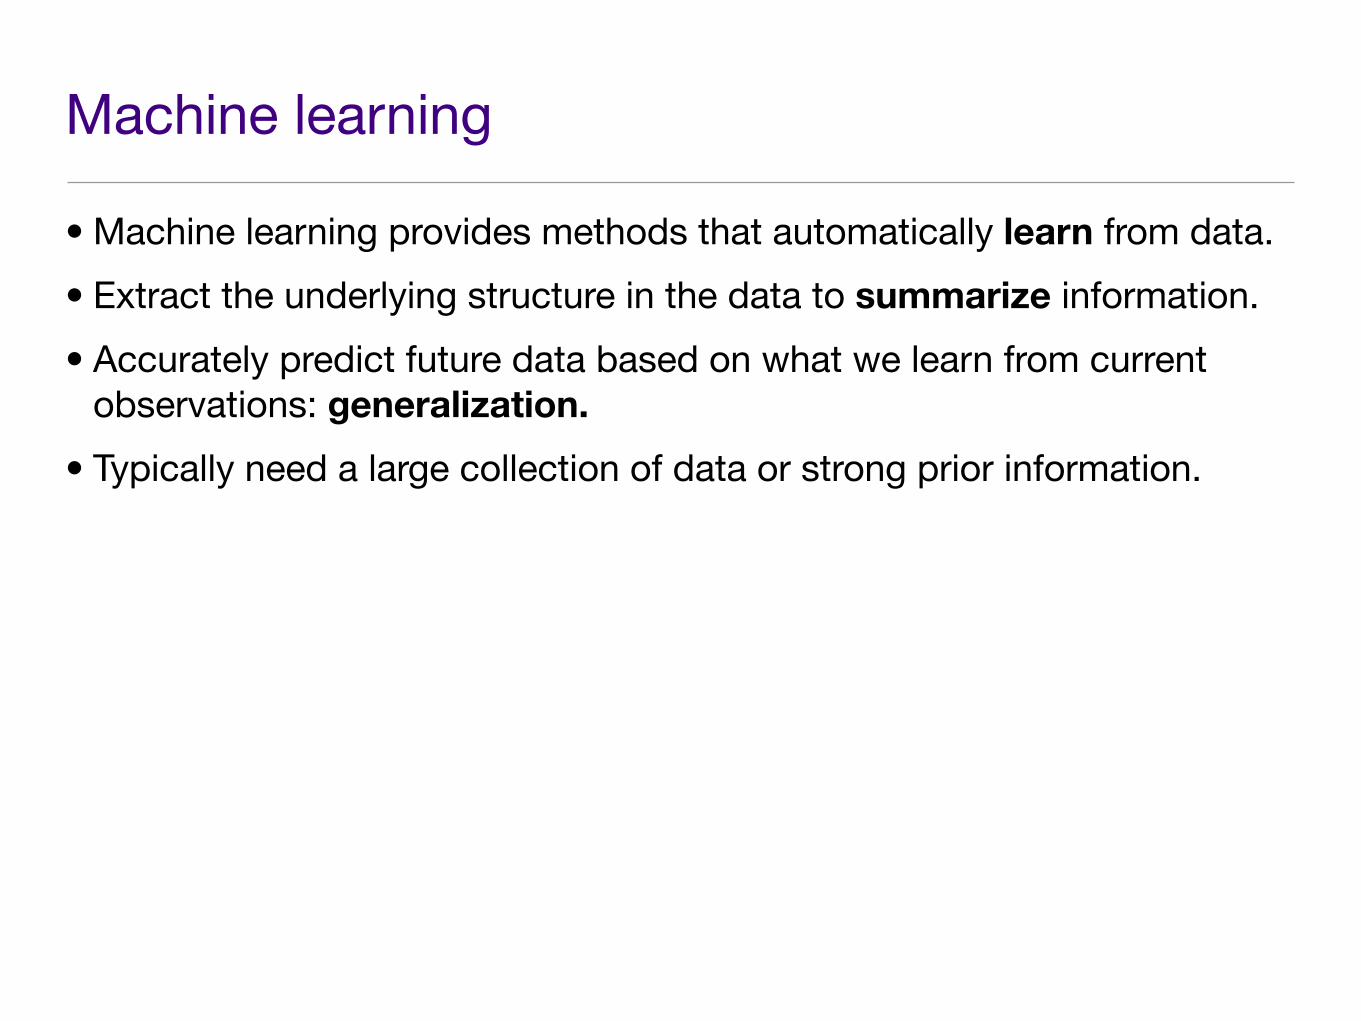
Machine learning
• Machine learning provides methods that automatically learn from data.
• Extract the underlying structure in the data to summarize information.
• Accurately predict future data based on what we learn from current observations: generalization.
• Typically need a large collection of data or strong prior information.
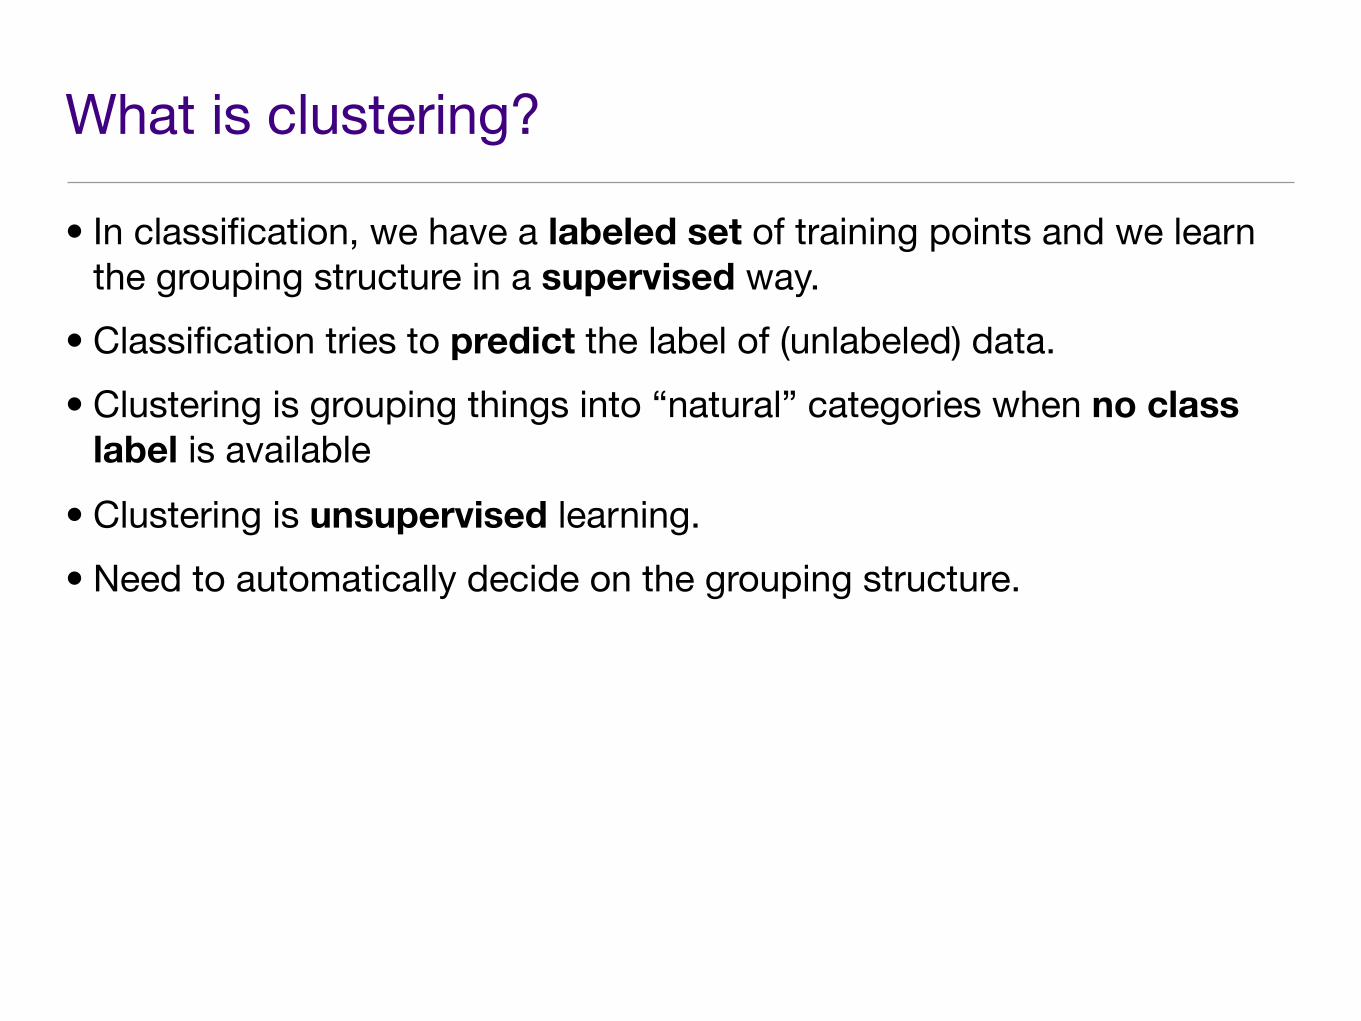
What is clustering?
• In classification, we have a labeled set of training points and we learn the grouping structure in a supervised way.
• Classification tries to predict the label of (unlabeled) data.
• Clustering is grouping things into “natural” categories when no class label is available
• Clustering is unsupervised learning.
• Need to automatically decide on the grouping structure.

Why clustering?
• Labeling a large set of sample patterns can be costly.
• The contents of the database may not be known.
• Clustering can be used for finding features that will later be useful for categorization.
• It may help to gain insight into the nature of the data.
• It may lead to discovery of distinct subclasses or similarities among patterns.

ClusteringGeneral approach for learning
• For a given set of points, learn a class assignment for each data point.
• Describe each cluster using a set of parameters .
• Use an objective (cost) function to measure the quality of clustering.
‣ A function of model parameters and assignment variables.
• Clustering is the process of optimizing the objective function.
xi, i ! {1, . . . , N}
c !c
yi ! {1, . . . ,K}
f(!, Y )
argmin f(!, Y )!, Y

Clustering Challenges
• What cost function to use?
• What underlying structure to assume?
• How to measure similarity?
• How to decide on the number of clusters?
• Different answers to these questions may lead to different clustering algorithms and different clustering outcomes.
• Common objective: generalize well.
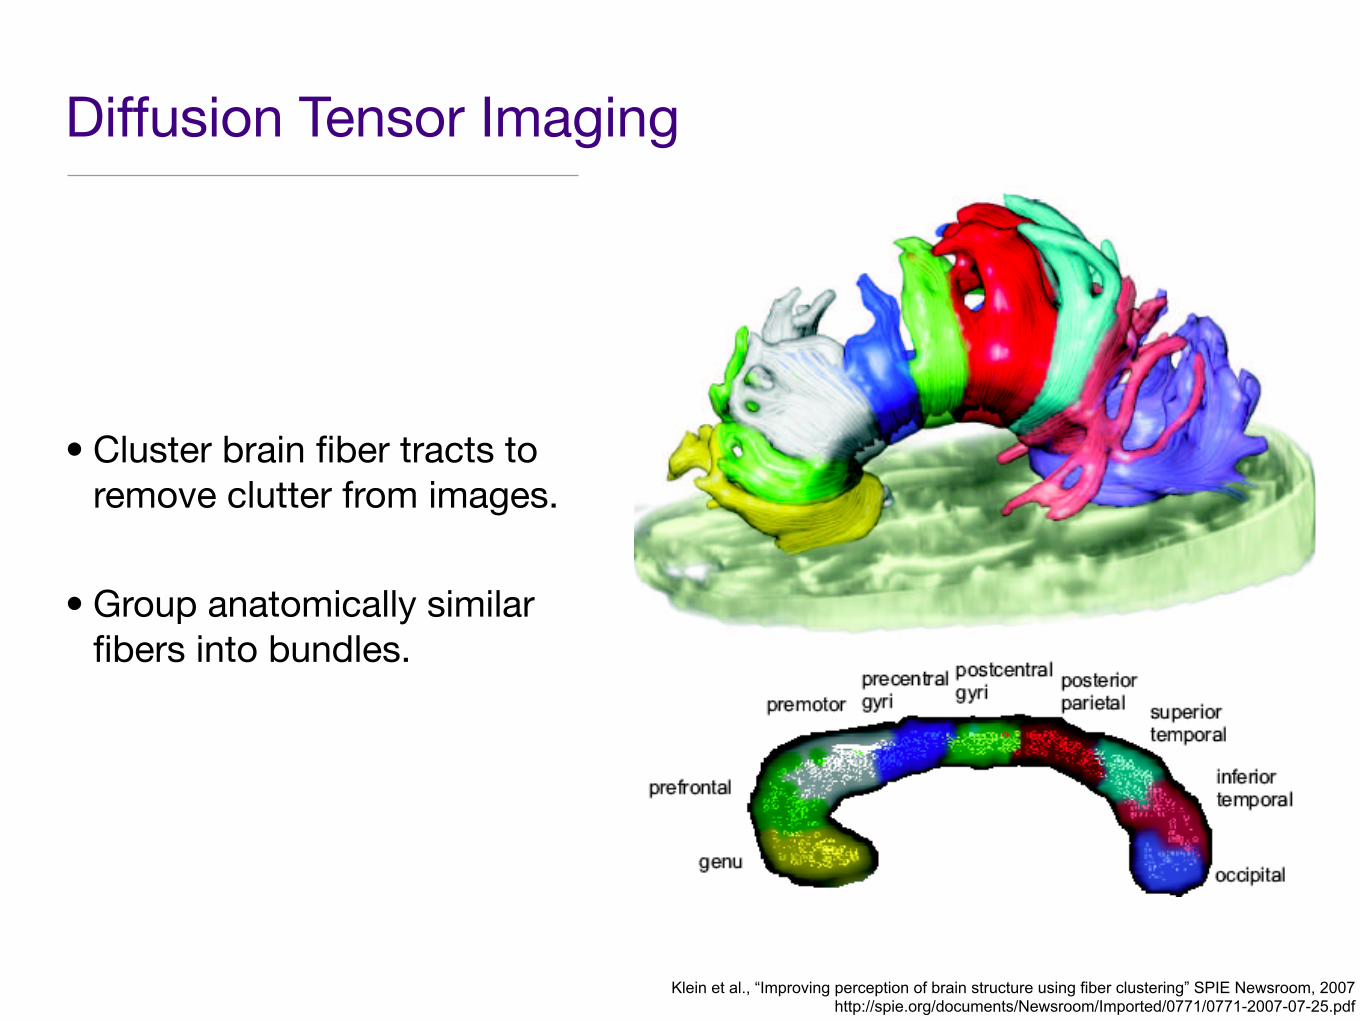
Diffusion Tensor Imaging
• Cluster brain fiber tracts to remove clutter from images.
• Group anatomically similar fibers into bundles.
Klein et al., “Improving perception of brain structure using fiber clustering” SPIE Newsroom, 2007http://spie.org/documents/Newsroom/Imported/0771/0771-2007-07-25.pdf

• Group related nodes together.
• Make bundles out of edges of the same cluster.
Software dependency structure
Telea and Ersoy, “Image-Based Edge Bundles: Simplified Visualization of LargeGraphs.” Computer Graphics Forum, 2010http://www.cs.rug.nl/~alext/PAPERS/EuroVis10/paper.pdf

US migrations
Telea and Ersoy, “Image-Based Edge Bundles: Simplified Visualization of LargeGraphs.” Computer Graphics Forum, 2010http://www.cs.rug.nl/~alext/PAPERS/EuroVis10/paper.pdf

Document browsing
• Search for relevant documents.
http://search.carrot2.org

Topic analysis
Wang and McCallum. “Topics over Time: A Non-Markov Continuous-Time Model of Topical Trends, KDD 2006http://www.cs.umass.edu/~mccallum/papers/tot-kdd06.pdf

Language families

Spike sorting
Gorur et al. “Modelling spikes with mixtures of factor analysers.” DAGM, 2004
http://www.gatsby.ucl.ac.uk/~dilan/papers/pdf2646.pdf
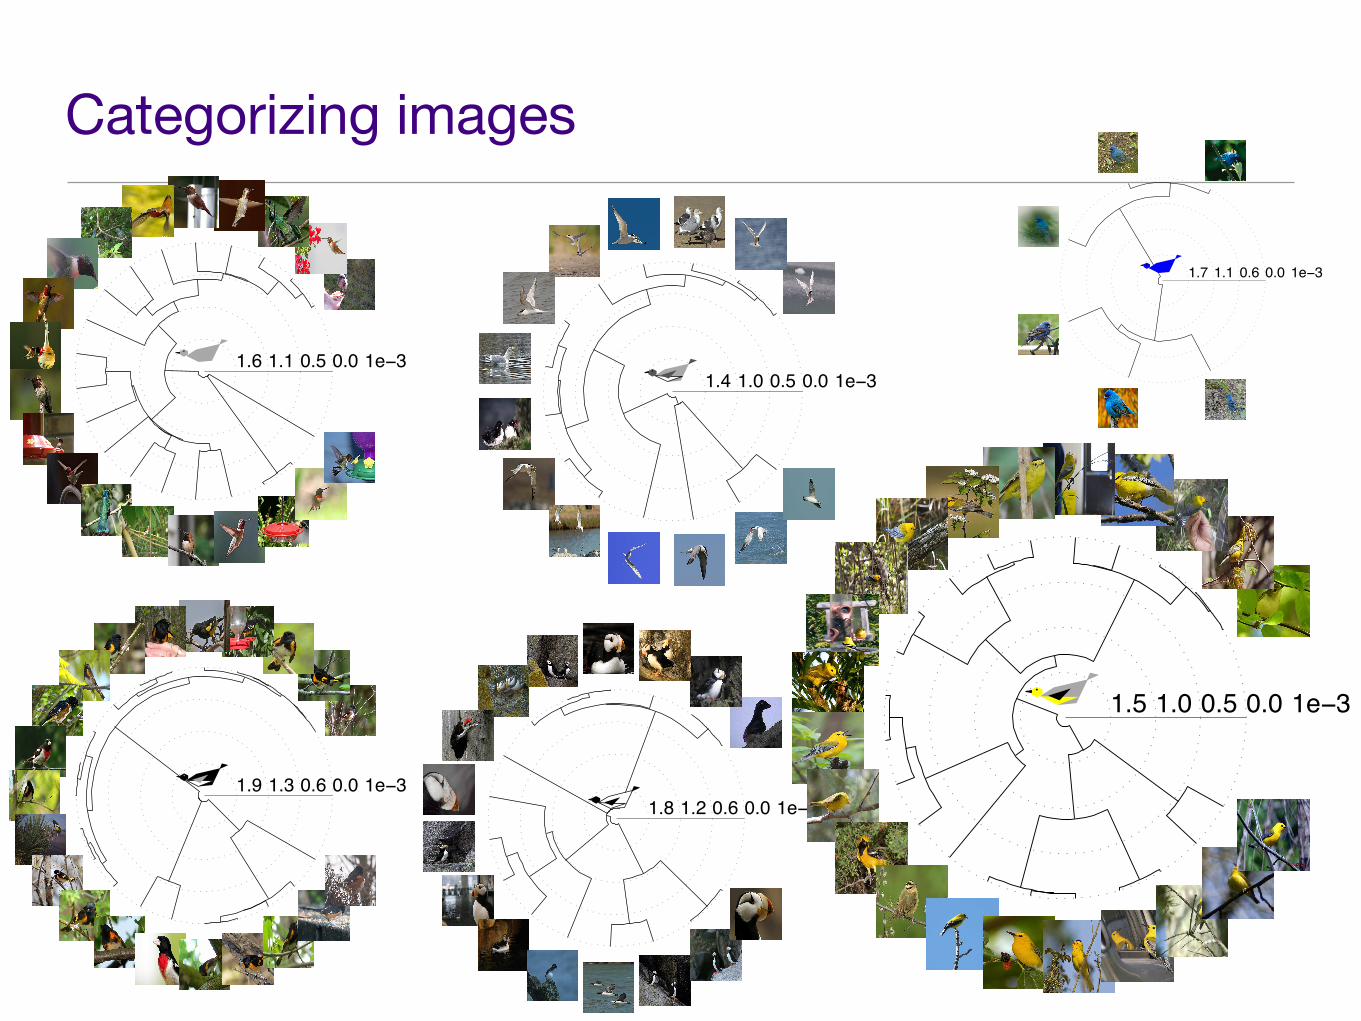
Categorizing images
1.6 1.1 0.5 0.0 1e−3
1.9 1.3 0.6 0.0 1e−3
1.7 1.1 0.6 0.0 1e−3
1.8 1.2 0.6 0.0 1e−3
1.4 1.0 0.5 0.0 1e−3
1.5 1.0 0.5 0.0 1e−3
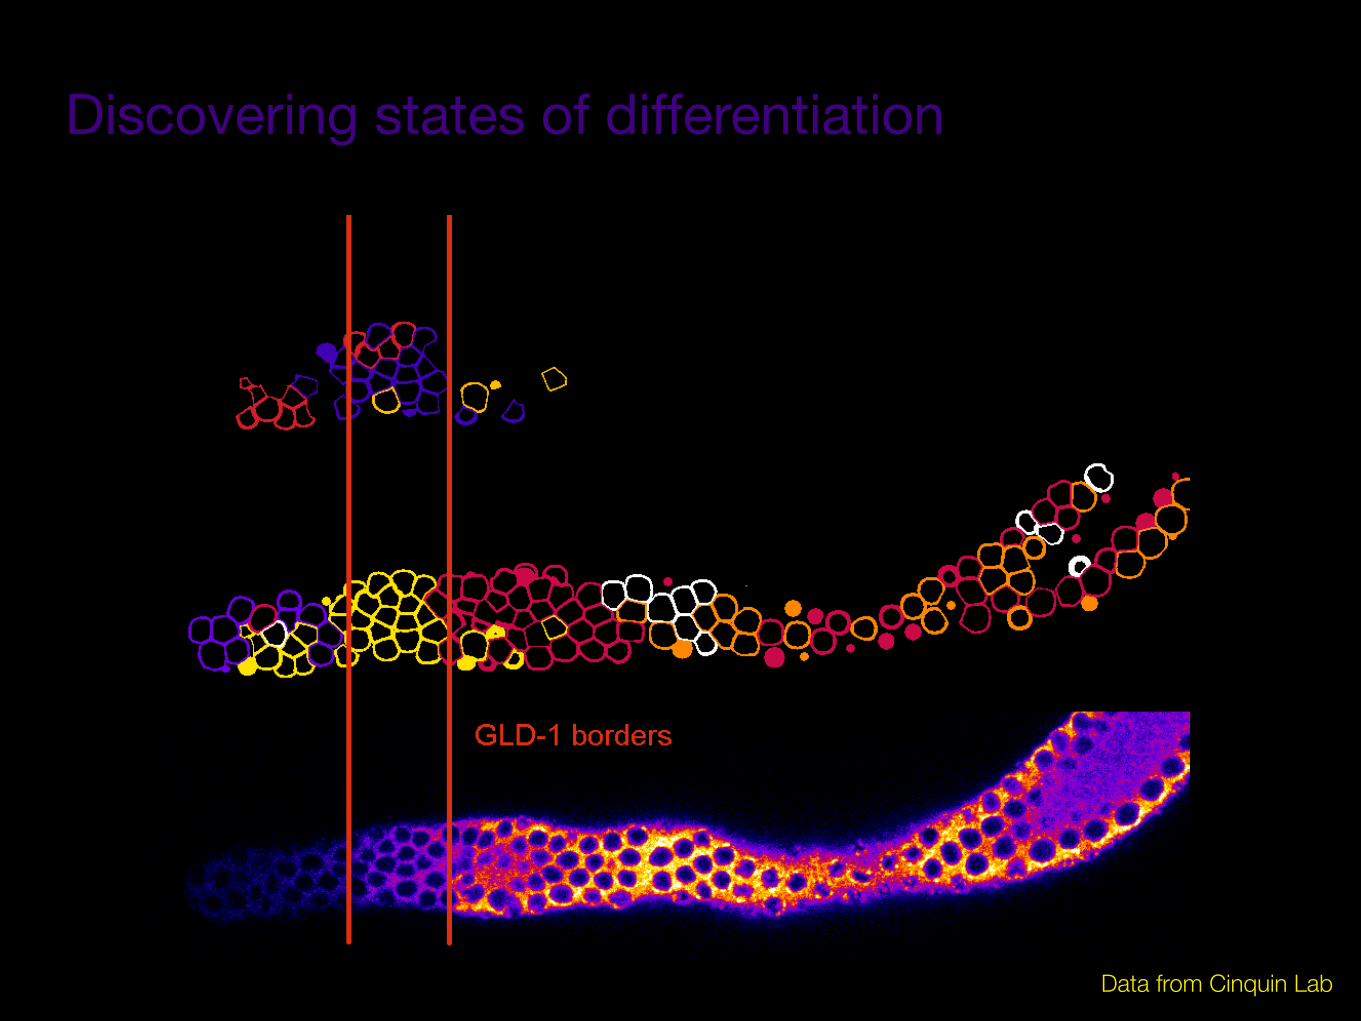
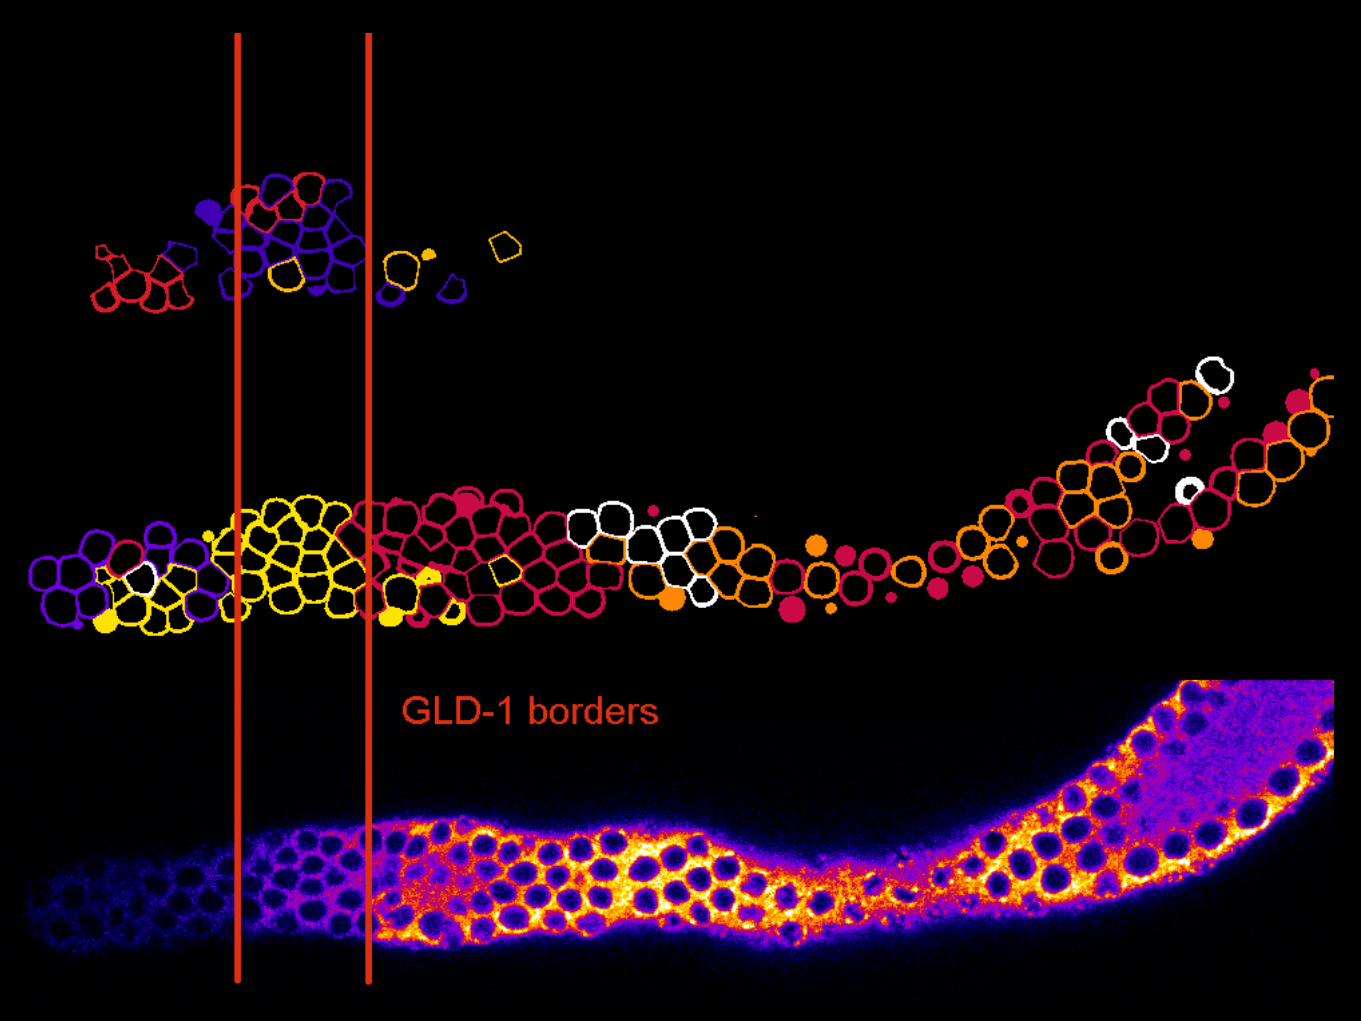
Discovering states of differentiation
Data from Cinquin Lab
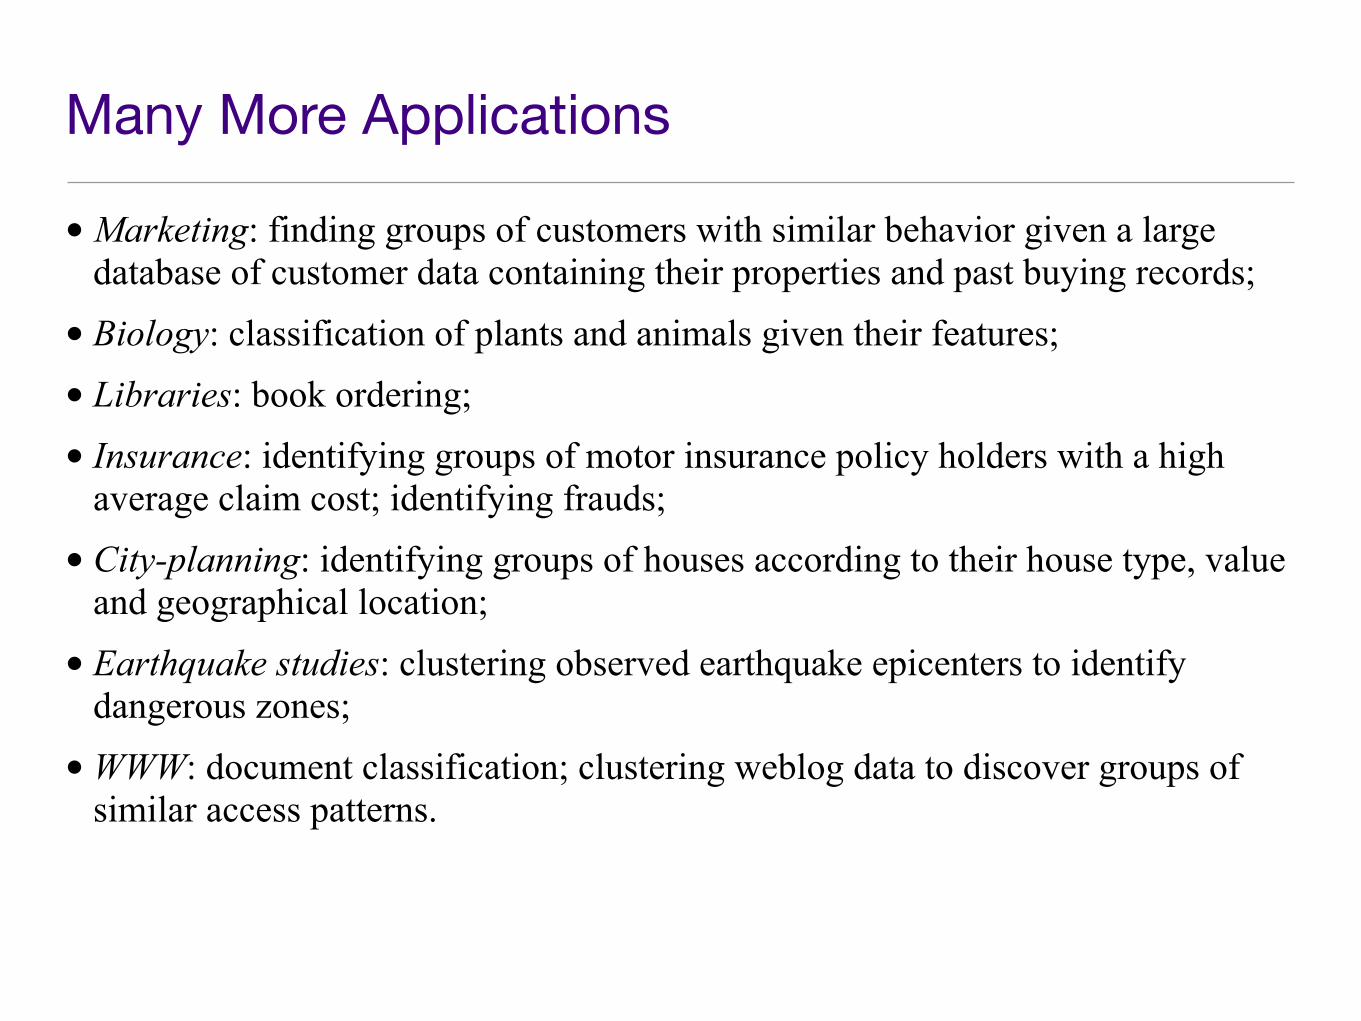
Many More Applications
• Marketing: finding groups of customers with similar behavior given a large database of customer data containing their properties and past buying records;
• Biology: classification of plants and animals given their features;
• Libraries: book ordering;
• Insurance: identifying groups of motor insurance policy holders with a high average claim cost; identifying frauds;
• City-planning: identifying groups of houses according to their house type, value and geographical location;
• Earthquake studies: clustering observed earthquake epicenters to identify dangerous zones;
• WWW: document classification; clustering weblog data to discover groups of similar access patterns.
Why clustering?
• Labeling a large set of sample patterns can be costly.
• The contents of the database may not be known.
• Clustering can be used for finding features that will later be useful for categorization.
• It may help to gain insight into the nature of the data.
• It may lead to discovery of distinct subclasses or similarities among patterns.

ClusteringGeneral approach for learning
• For a given set of points, learn a class assignment for each data point.
• Describe each cluster using a set of parameters .
• Use an objective (cost) function to measure the quality of clustering.
‣ A function of model parameters and assignment variables.
• Clustering is the process of optimizing the objective function.
xi, i ! {1, . . . , N}
c !c
yi ! {1, . . . ,K}
f(!, Y )
argmin f(!, Y )!, Y

Clustering Challenges
• What cost function to use?
• What underlying structure to assume?
• How to measure similarity?
• How to decide on the number of clusters?
• Different answers to these questions lead to different clustering algorithms.
• Common objective: generalize well.

Clustering Differences in algorithms
According to the resulting structure:
• Flat clustering.
• Hierarchical clustering.
According to the modeling framework:
• Deterministic clustering.
• Probabilistic models.
• Bayesian models.

K-means
• A flat clustering technique.
• A prototype-based approach.
• The samples come from a known number of clusters with prototypes
• Each data point belongs to exactly one cluster.
• Alternative notation:
• Task: find good prototypes and and good assignments of data points to prototypes.
ric ={1 if xi belongs to cluster c,
0 otherwise.
yi ! {1, . . . ,K}
µc, c ! {1, . . . ,K}

• Say we are given good prototypes.
• How should we assign data points to clusters?
• For each data point,
‣ Calculate the distance of the data point to each of the prototypes.
‣ Assign the point to its closest prototype.
K-meansAssigning data points to clusters
cyi = argmin ||xi ! µc||

• Say we are given good prototypes.
• How should we assign data points to clusters?
• For each data point,
‣ Calculate the distance of the data point to each of the prototypes.
‣ Assign the point to its closest prototype.
K-meansAssigning data points to clusters
cyi = argmin ||xi ! µc||

K-meansLearning good prototypes
• Say we have good assignments of data points to clusters.
• How can we find good prototypes?
• Define the prototypes to be the mean of each cluster.
µc =!N
i:yi=c xi
nc=
!Ni=1 ricxi!Ni=1 ric

K-meansLearning good prototypes
• Say we have good assignments of data points to clusters.
• How can we find good prototypes?
• Define the prototypes to be the mean of each cluster.
µc =!N
i:yi=c xi
nc=
!Ni=1 ricxi!Ni=1 ric

K-meansLearning good prototypes
• Say we have good assignments of data points to clusters.
• How can we find good prototypes?
• Define the prototypes to be the mean of each cluster.
µc =!N
i:yi=c xi
nc=
!Ni=1 ricxi!Ni=1 ric

K-meansUpdates
• We neither have good assignments nor good prototypes to start with.
• Solution: iterate to find a good fit to both.
• Convergence: when the cluster assignments do not change anymore.
argminN!
i=1
K!
c=1
ric||xi ! µc||R,µ

Implementation DetailsK-means
• Each data point belongs to one cluster only. Need assignment variables to remember the cluster membership of each data point.
• Need to remember the prototype vectors.
• Calculate distances between prototype vectors and data points.
• Find which prototype is the closest to each data point.
• Average over data points assigned to a cluster to find its prototype vector.

Implementation DetailsK-means
• Initialize cluster assignments:
• Initialize prototype vectors:
• Repeat until convergence:
‣ Remember current assignments:
‣ Update cluster assignments:
- for
-
‣ Update prototype vectors:
-
• Converged if old assignments is the same as the new assignments.
r = ceil ( rand(1, N) + K)
µc = mean(X(Y == c, :))
oldY = Y
i = 1 : N
dd(k) =!
d
(xid ! µcd)2
[d1 r(i)] = min(dd)
µc = mean (X(Y == k, :))

Affinity Propagation
• Similar idea to k-means:
‣ Find prototype vectors to represent clusters.
‣ Assign each data point to the cluster with closest prototype.
‣ Update prototype vectors.
• Difference: Prototypes are chosen from the dataset.

Hierarchical Clustering

• Shorter search time
• More intuitive relationships between groups of data points
• More structure in the representation, varying degrees of similarity
• Easier and nicer to visualize
Hierarchical clusteringMotivation
Uses of hierarchical clustering:
• recover underlying structure: we believe that the data has an underlying tree structure
• visualize data: understand relationship among data items
• summarize data: a way to partition data into different (possibly unrelated) groups
• Top-down divisive.
‣ Start with assigning all data points to one (or a few coarse) cluster.
‣ Recursively split each cluster.
‣ Uses a flat clustering algorithm as a subroutine.
• Bottom-up agglomerative.
‣ Start with assigning each data point to its own cluster.
‣ Iteratively find pairs of clusters to merge.
‣ Clusters found by finding pairs with maximum similarity.
• Dominant approach is bottom-up: better search landscape, more flexible algorithms, but is more myopic.
Hierarchical clusteringDifferent approaches

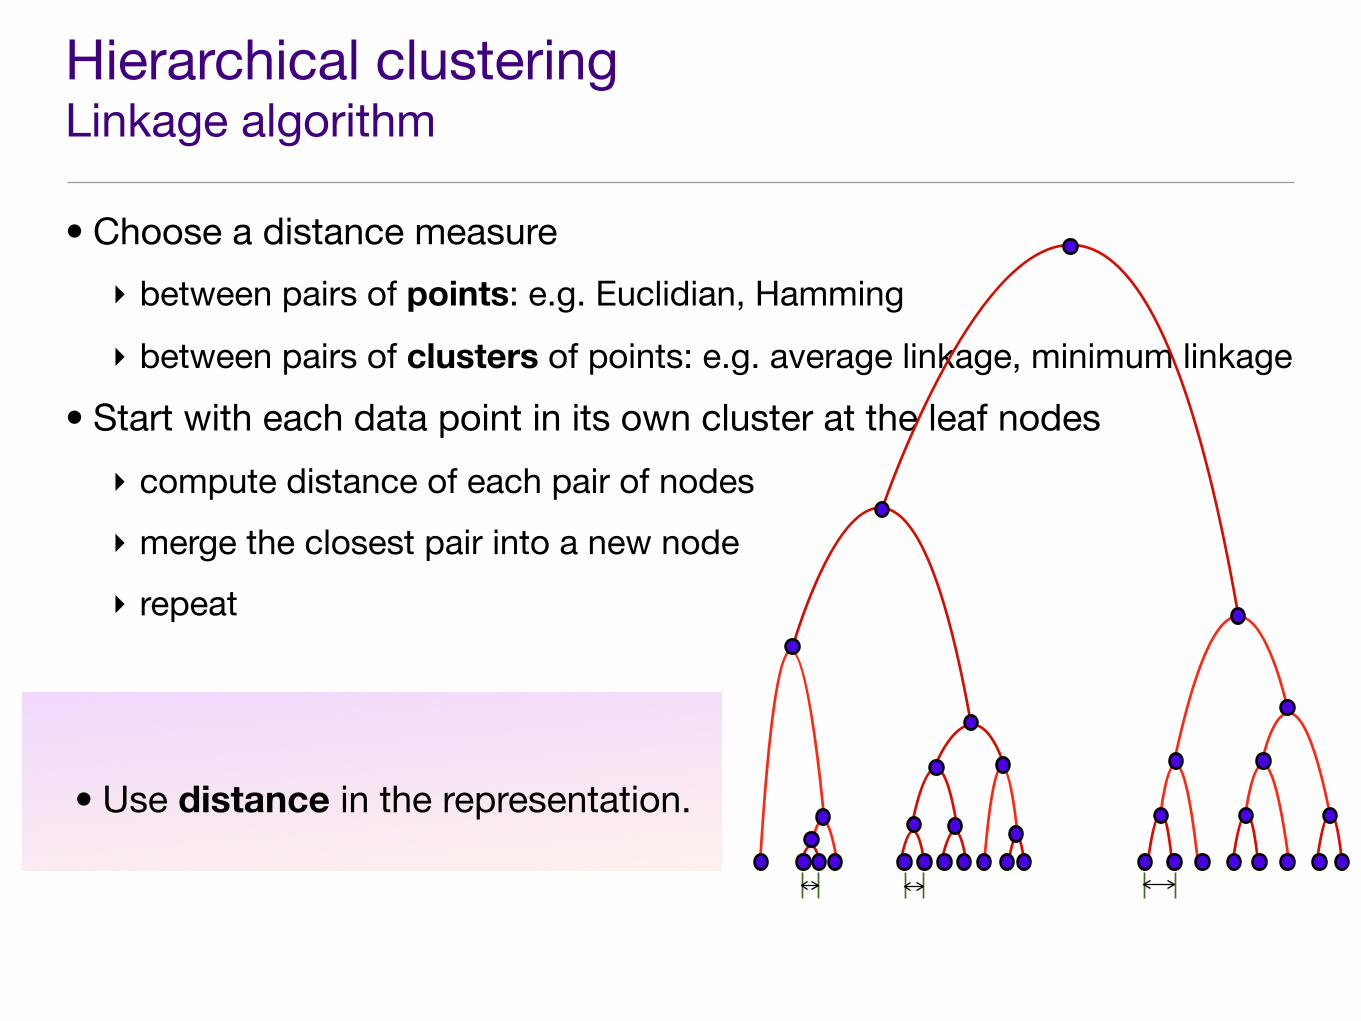
Hierarchical clusteringLinkage algorithm
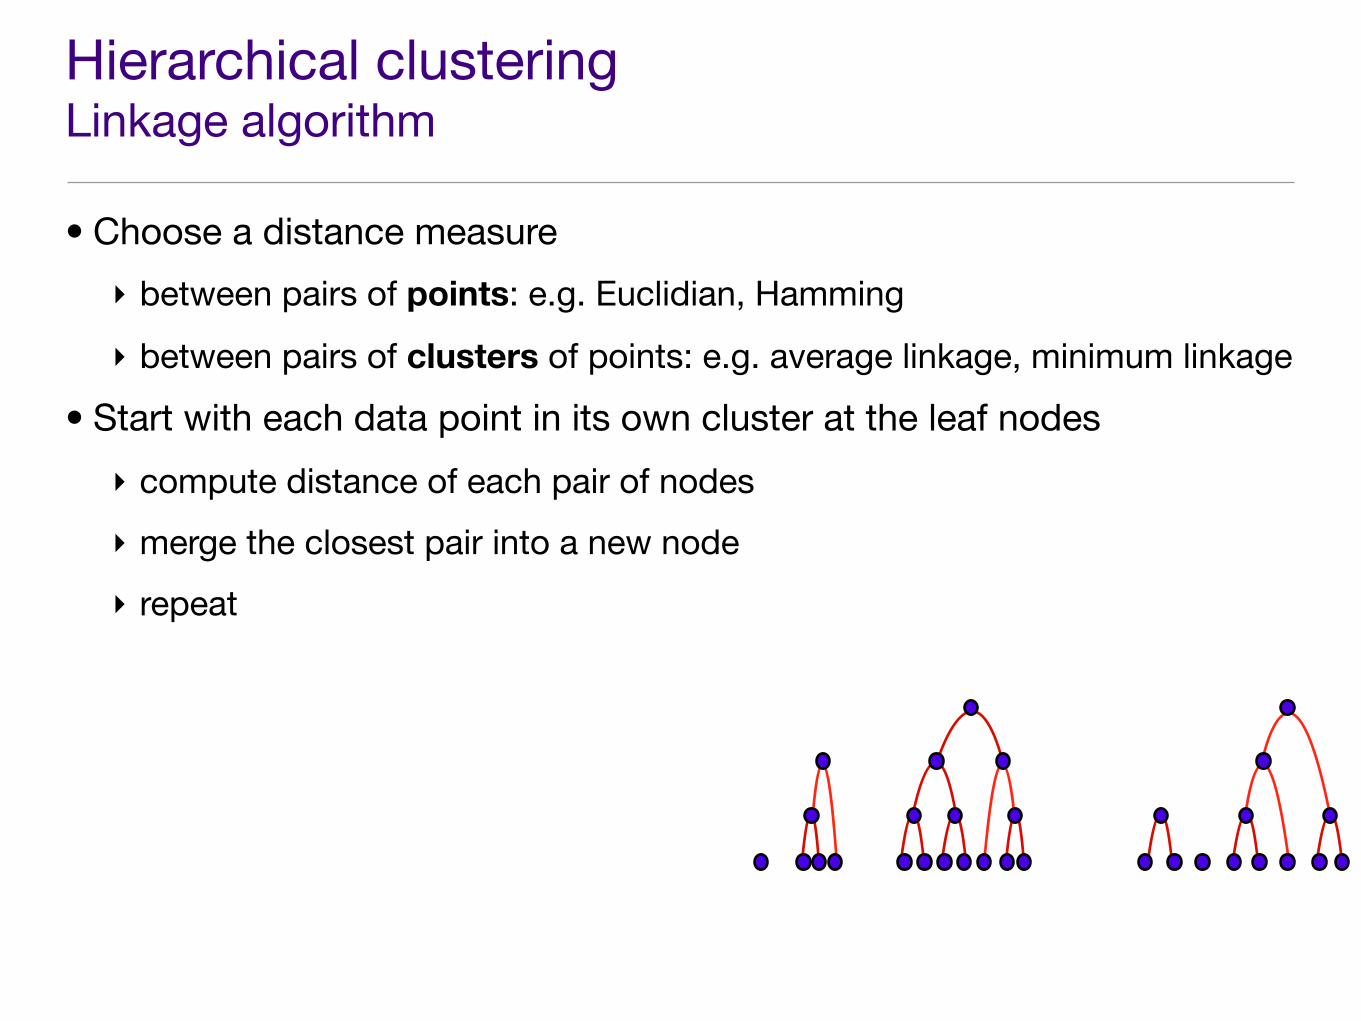
• Choose a distance measure
‣ between pairs of points: e.g. Euclidian, Hamming
‣ between pairs of clusters of points: e.g. average linkage, minimum linkage
• Start with each data point in its own cluster at the leaf nodes
‣ compute distance of each pair of nodes
‣ merge the closest pair into a new node
‣ repeat

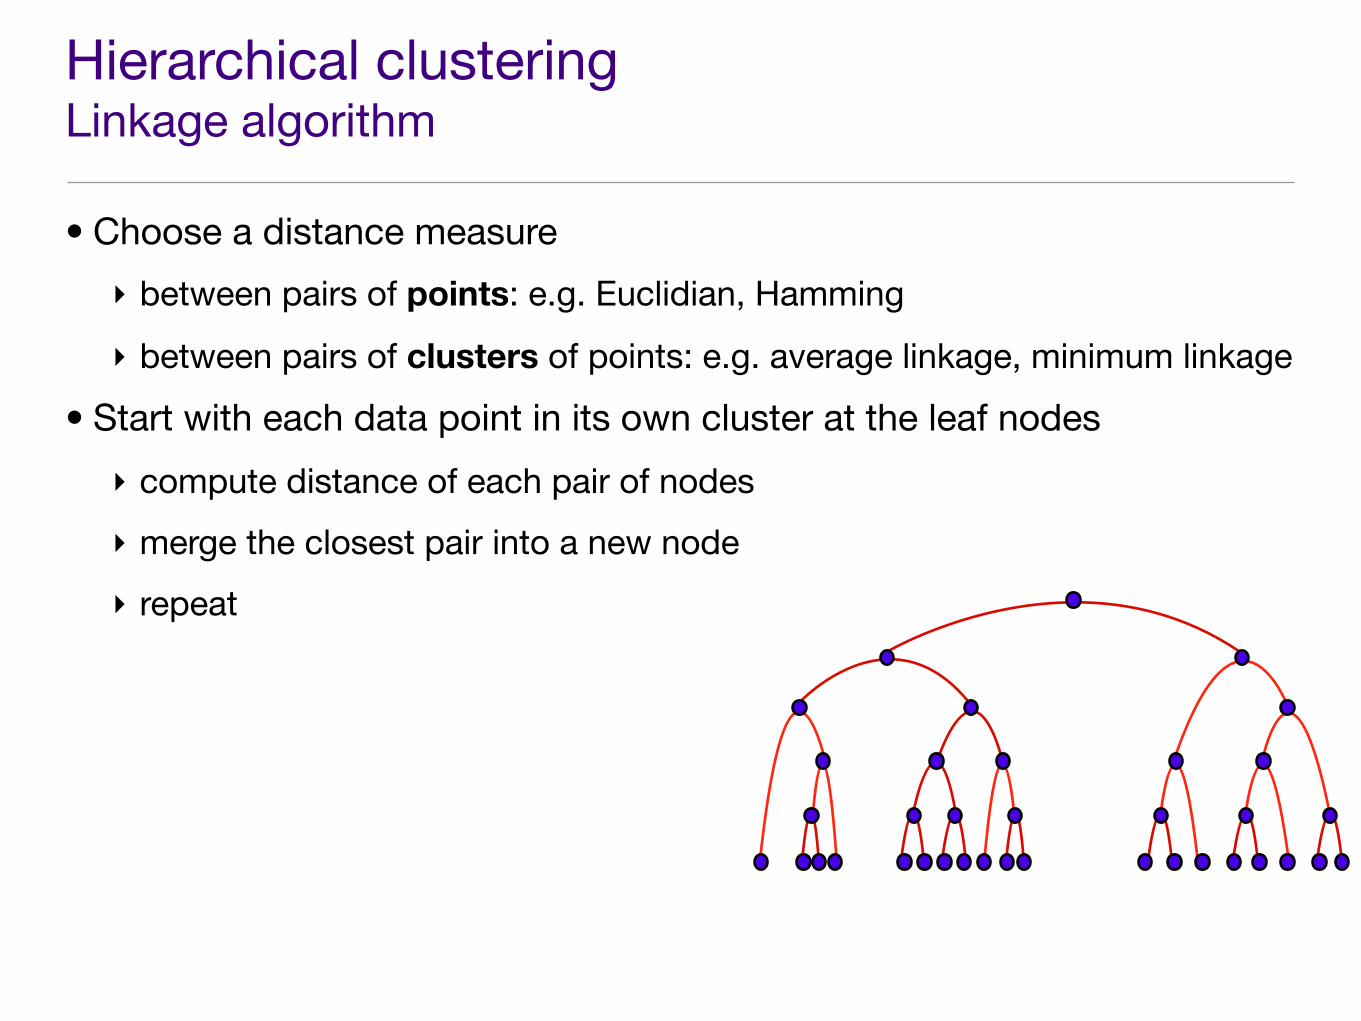
Hierarchical clusteringLinkage algorithm
• Choose a distance measure
‣ between pairs of points: e.g. Euclidian, Hamming
‣ between pairs of clusters of points: e.g. average linkage, minimum linkage
• Start with each data point in its own cluster at the leaf nodes
‣ compute distance of each pair of nodes
‣ merge the closest pair into a new node
‣ repeat
• Use distance in the representation.

Linkage AlgorithmsDistance between clusters
• Single (or minimum) linkage:
• Complete (or maximum) linkage:
• Average linkage:
dist(A,B) = minxi!A,xj!B
dist(xi, xj)
dist(A,B) = maxxi!A,xj!B
dist(xi, xj)
dist(A,B) =1
|A||B|!
xi!A,xj!B
dist(xi, xj)

Implementation DetailsLinkage
• Initialize a list of clusters with each data point in its own cluster.
• At each iteration, merge two clusters (nodes): there will be a total of N-1 iterations and 2N-1 nodes.
• Compute distances between every pair of nodes.
• Pick the pair of nodes with smallest distance.
• Merge the pair:
‣ Remove these nodes from representation.
‣ Include the new node in the representation.
• Repeat until a single node remains in the representation.
Clustering Cell-Cycle Phase and Differentiation

Cell-cycle phase and differentiation clusteringData and task description
Preprocessing
Automatic Seeding Segmentation
Original Image

Cell-cycle phase and differentiation clusteringProcess details
Segmented Image Visualization
Feature Selection
Validation
Feature Extraction
Clustering

Cell-cycle phase and differentiation clusteringResults
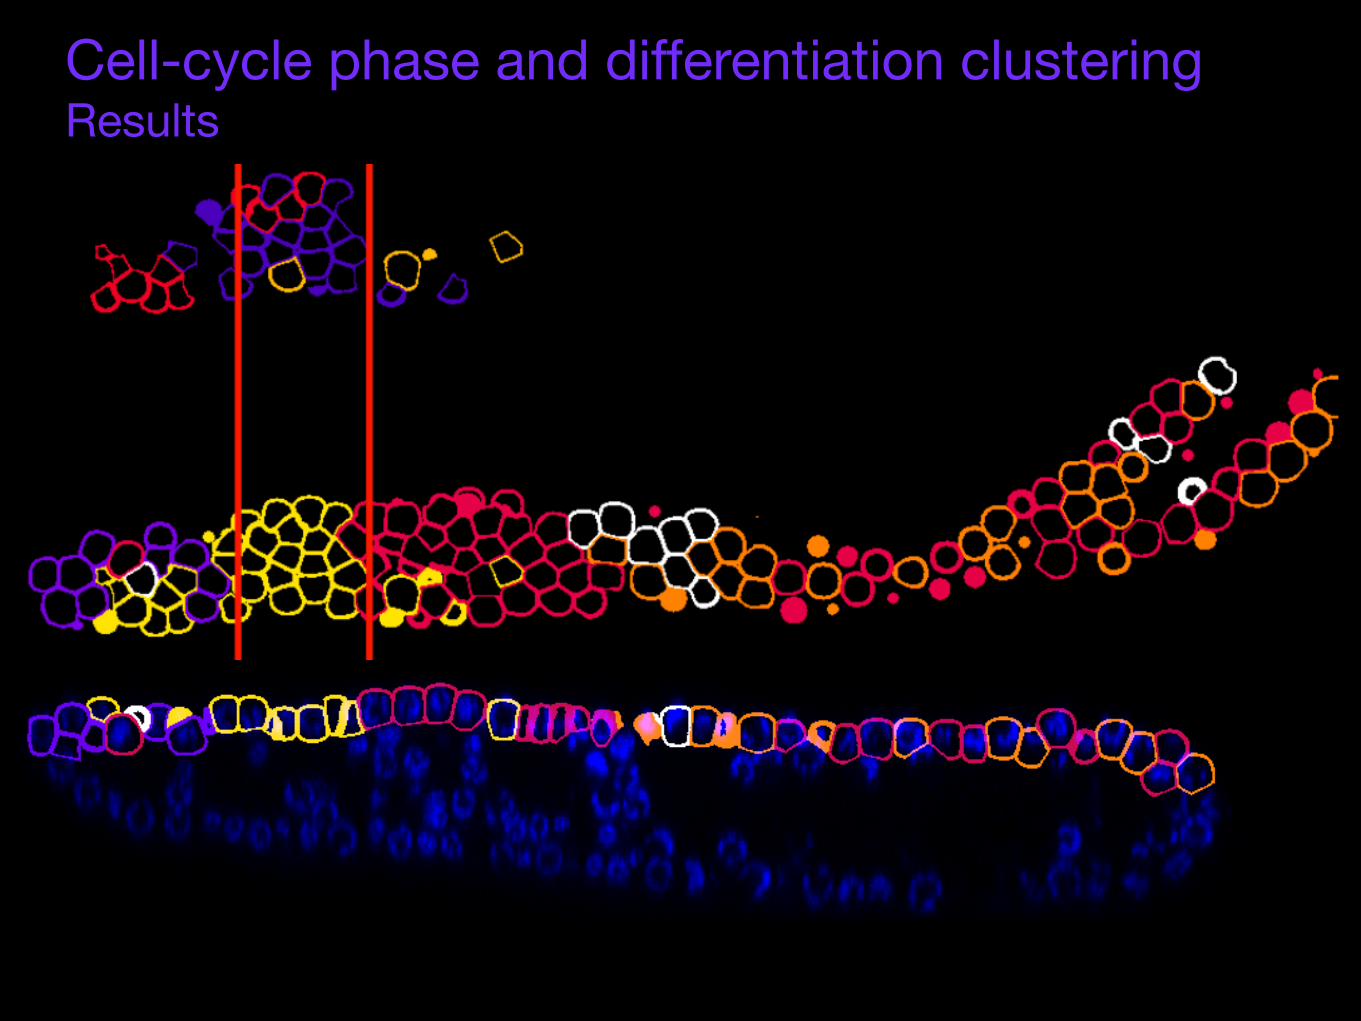
Cell-cycle phase and differentiation clusteringResults