Embed Size (px)
Citation preview

Introduction to Closed-End Funds
AAII PresentationNovember 10, 2007

ContentClosed-End Funds - Definition and HistoryAttributes of Closed-End FundsThe Types of Funds AvailableQuestions

DefinitionA closed-end fund is an investment company that pools the assets of its investors and uses professional managers to invest the money to meet clearly identified objectives.

HistoryCreated to allow individual investors to invest in the stock market
1822 William I of the Netherlands creates the first Investment Trust1860s British and Scottish Trusts boom
Many invest heavily in the ‘Emerging’ US economy after the Civil War
1893 Boston Personal Property TrustFirst US CEF

History535 US CEFs existed prior to the ‘29 crashMany were speculative and over-leveraged
Only 5 of the original remainRegulatory reforms improved the structure
Investment Company Act (1940) limited leverage to a third of total capitalAlso improved the more popular open-end funds.

TodayOver 670 CEF’s with $300bn in assets
61 World Equity Funds15 Global Income Funds12 Emerging Market Debt FundsOver 130 Domestic Debt FundsOver 260 Domestic Municipal Bond Funds132 Sector and Diversified Funds46 Convertible & Equity Income Funds 21 launched thus far in 2007

Unique Structure of CEF’sStructure lets management engage in strategies that are not available in traditional open-end funds
Long-term investmentsLeverage May hold very illiquid securities or securities with limited availabilityLevel or Managed Distribution Policies

Long Term InvestmentsCEFs have a stable asset base
Money is not coming in at topsMoney is not going out at bottoms
Allows for long-term strategies such as:Value FundsReal Estate FundsLoan Participation FundsEmerging Market Debt Funds

LeverageClosed-End Funds may issue senior securities (usually AAA rated preferred stocks) or borrow money to leverage their investments.
May increase risk unless leverage is offsetMay increase dividends if cost of leverage is lower than investment returnsLimited to 50% of equity

Restricted and Illiquid InvestmentsCountries with limited foreign investor accessPrivate placements
Opportunities offered only to professionals
Small and Mid Cap strategiesHedge Funds
Level and Managed Distribution Policies
Some Funds utilize a dividend policy that spreads out “other” income (such as capital gains and option premiums) over all distributions and promises a minimum payout even if not ‘earned’.Annual Yields often run from 6% to 12%

PricingTwo principal indicators of CEF’s value
Net Asset Value (NAV) is the per share market value of the net assets held by the fund
Stock Price represents the market value of one share in the open market

Discounts and PremiumsWhen demand exceeds supply, the market price of a CEF trades at a premium to its NAV
Appears to be a function of yield not performance
When supply exceeds demand, the shares of the CEF trade at a discount to its NAV
Opportunity to buy $1 of professionally managed assets for less than $1

ConsistencyInvestment manager can put capital to work in a long-term strategy with less concern for liquidity since shares are not redeemed.
Pool of assets available for investment remains stable.
Lower Turnover RatesWhile CEF’s are professionally managed, they often have lower turnover rates, because most managers take a long-term view to investing. The CEF structure does not encourage unnecessary trading of shares
No need to unnecessarily turn over the portfolio to “window dress” the quarterly results

Lower FeesCEF’s have lower marketing expenses because they don’t need to attract funds on an on-going basis and somewhat lower operating costs than an open-end fund.
Management fees are paid from the fund assetsCEF’s don’t charge 12b-1 fees
No distribution fees as in open-end fundsFund Expenses within size and style categories are often lower than open-end funds

Comparisons to ETF’sExchanged-Traded Funds are index funds and share some of the same benefits of CEF’s
Low expensesTax efficientShares trade at or near NAV“Redeemable”
However, because they are an index fund, no one is actively managing the funds
This can affect performanceCEF’s are “actively managed ETF’s”
Sources of InformationA variety of information sources on CEF’sare available:
CEFA.COMETFConnectFund and Manager WebsitesLipperMorningstar
• CEFA.com

®
investing in resources for the future ®
www.peteres.com
Generation after generation - we grow with you ™
www.adamsexpress.com
®


6.04.02.72.42.32.32.02.01.91.8
27.4
%
%
Ten Largest Portfolio Ten Largest Portfolio HoldingsHoldings
Petroleum & Resources Corporation*General Electric Co.Schlumberger Ltd.Bank of America Corp.Microsoft Corp.American International Group, Inc.ConocoPhillipsPepsiCo, Inc.Cisco Systems, Inc.Pfizer Inc.
Total
$88,214,463 58,829,40039,900,00035,691,70034,762,80033,825,00030,280,65029,304,00028,143,50027,361,600
$406,313,113
Market Value % of Net Assets
*Non-controlled affiliate
®
As of September 30, 2007As of September 30, 2007

10.4%
14.9%
6.4%
9.1%
6.6%9.0%
5.5%
17.4%16.4% 15.5%16.0%
13.9%
0%
20% ADXS&P 500Large Cap Core
Returns on Net Asset ValueReturns on Net Asset Value
12 Mos. 5 Years 10 YearsYTD
®
As of September 30, 2007As of September 30, 2007

0.900.860.900.780.76
5 Year Distribution History5 Year Distribution History®
Income Dividends
$
0.230.220.240.170.19
Short-Term Capital Gains
$
0.040.090.020.040.03
Long-Term CapitalGains
$
0.630.550.640.570.54
Total Distributions
$
Dividend Yield *
%
1.71.71.91.51.5
1.7
TotalDistribution *
%
6.806.657.056.806.14
6.69
20062005200420032002
* Percentage calculated on average daily stock price
2002 2002 -- 20062006
AVERAGE:

®
investing in resources for the future ®
www.peteres.com


Ten Largest PortfolioTen Largest Portfolio HoldingsHoldings
Exxon Mobil Corp.Chevron Corp.Schlumberger Ltd.ConocoPhillipsWeatherford International, Ltd.Total S.A. ADRNoble Corp.Valero Energy Corp.Devon Energy Corp.Occidental Petroleum Corp.
Total
$115,237,200 66,909,70058,800,00048,878,32333,157,36131,601,70029,430,00028,551,50027,456,00025,632,000
$465,653,784
11.76.86.05.03.33.23.02.92.82.6
47.3
Market Value % of Net Assets
As of September 30, 2007As of September 30, 2007
®
%
%

12 Mos. 5 Years 10 YearsYTD
Returns on Net Asset ValueReturns on Net Asset Value®
As of September 30, 2007As of September 30, 2007PEODJ Oil & Gas IndexNatural Resources Mutual Funds

®5 Year Distribution History5 Year Distribution History
Income Dividends
$
0.470.560.440.380.43
Short-Term Capital Gains
$
0.340.160.020.010.01
Long-Term CapitalGains
$
2.991.060.860.800.67
Total Distributions
$
3.801.781.321.191.11
Dividend Yield *
%
1.41.91.81.92.0
1.8
TotalDistribution *
%
11.265.905.405.845.11
6.70
20062005200420032002
* Percentage calculated on average daily stock price
2002 2002 -- 20062006
AVERAGE:
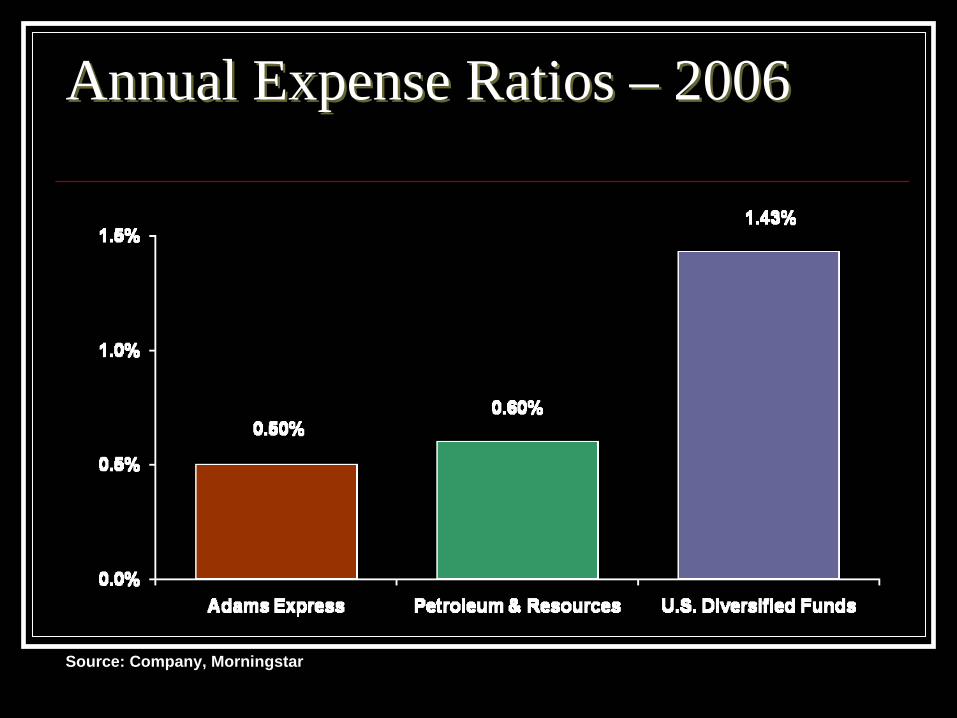
Annual Expense Ratios Annual Expense Ratios –– 20062006
Source: Company, Morningstar

®
investing in resources for the future ®
www.peteres.com
Generation after generation - we grow with you ™
www.adamsexpress.com
®

Questions