Embed Size (px)
Citation preview
Introduction to
Cartography
Russell KirkpatrickJochen Albrecht
“When I get a little moneyI buy maps;and if any is left,I buy food and clothes.”
–Desiderius Erasmus
What Is Cartography?
Photography = making and study of photographs
Cartography = making and study of…. ?
So the real question is: what is a map?
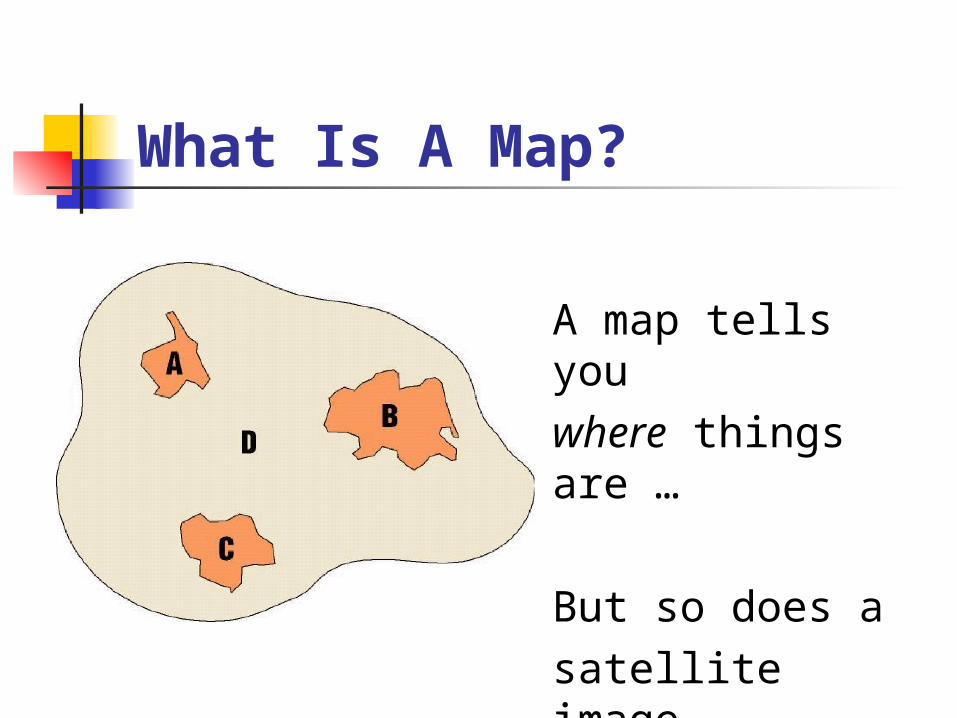
What Is A Map?
A map tells youwhere things are …
But so does asatellite image …
What Is A Map?
A map tells youwhat things are …
But so does agazetteer or a list …
Rockville CityBaltimore
City
ColumbiaCity
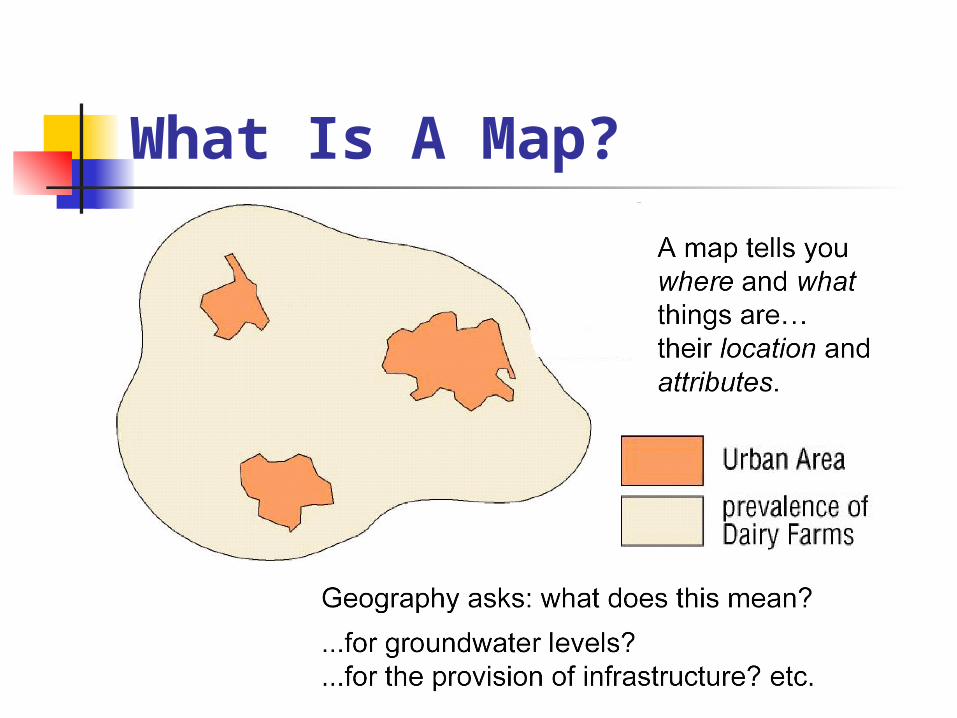
What Is A Map?
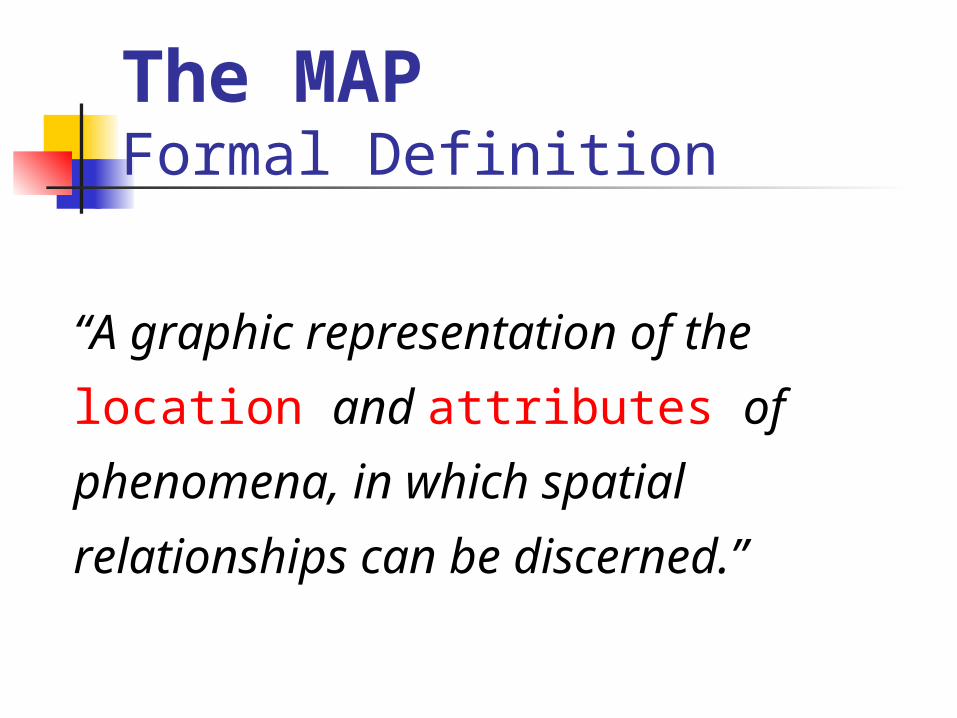
The MAPFormal Definition
“A graphic representation of the
location and attributes of
phenomena, in which spatial
relationships can be discerned.”
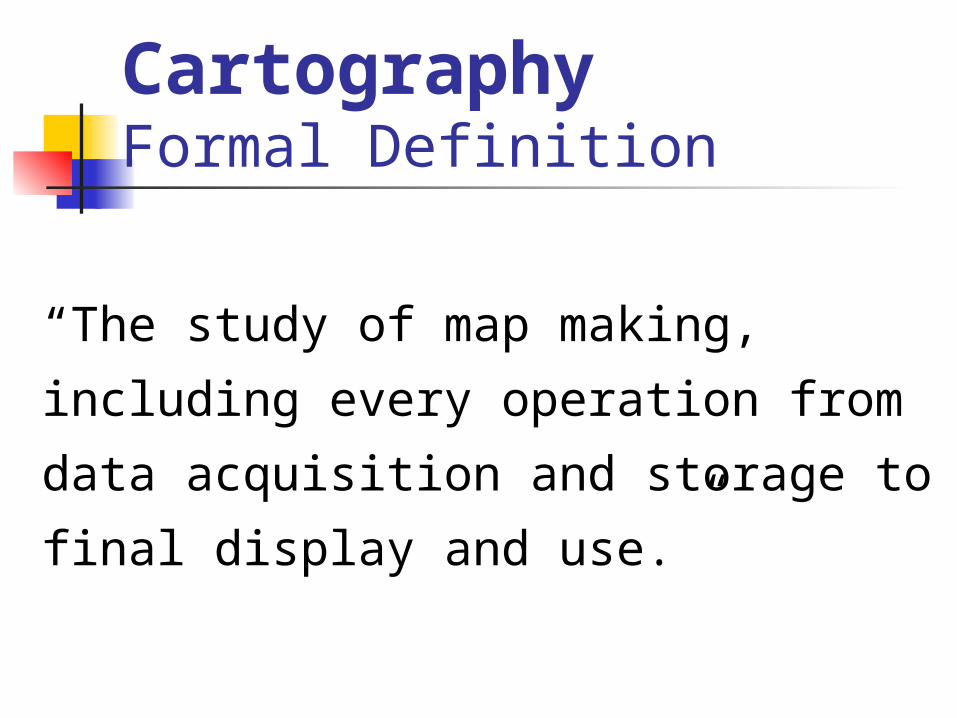
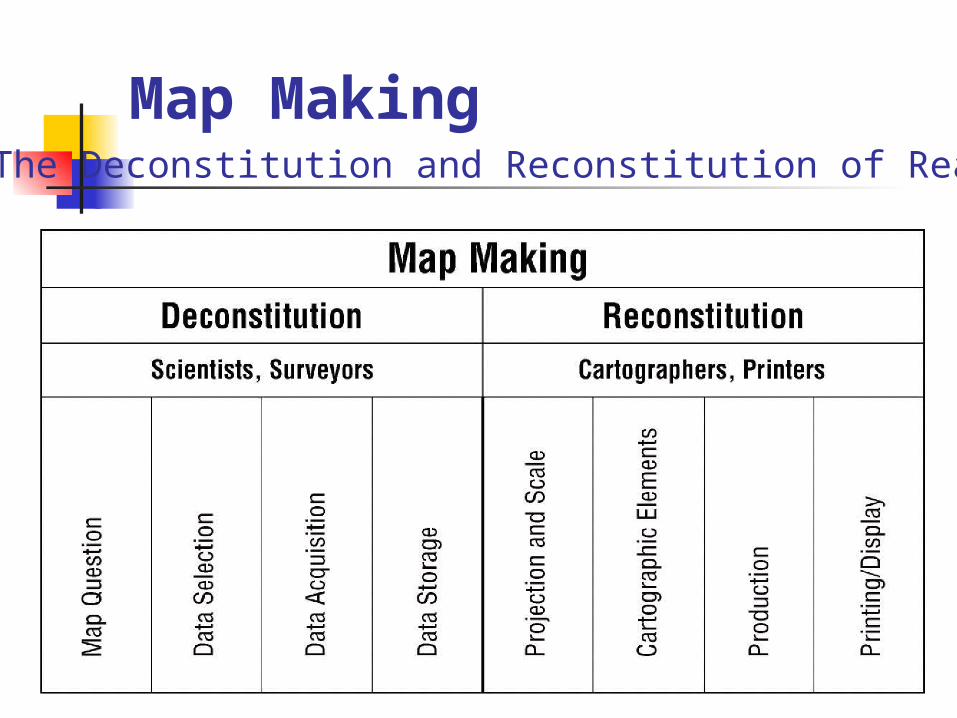
CartographyFormal Definition
“The study of map making,
including every operation from
data acquisition and storage to
final display and use.”
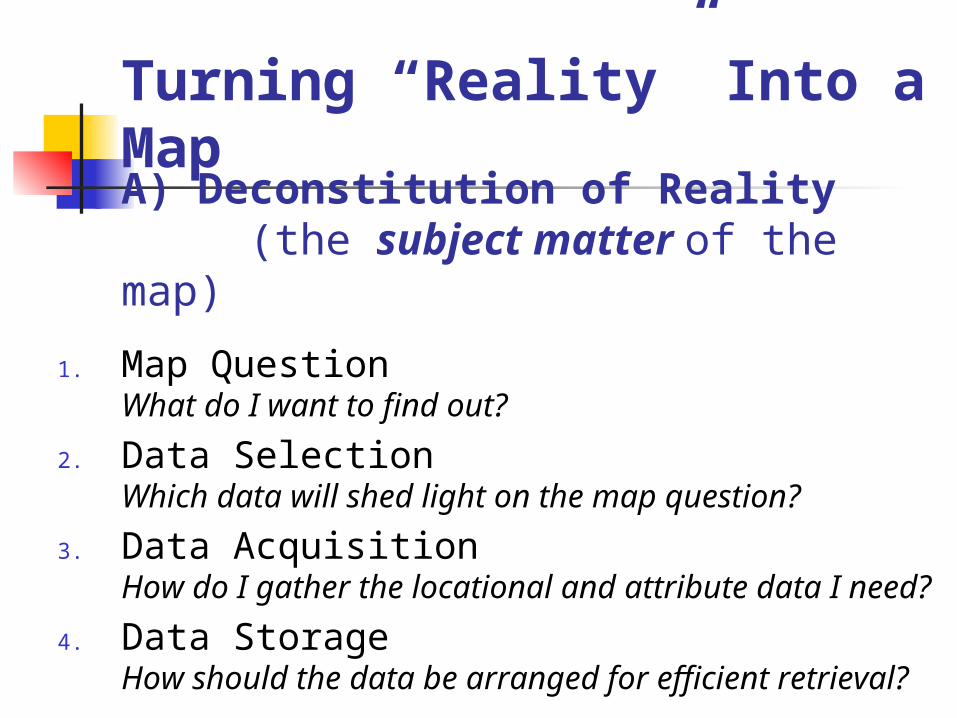
A) Deconstitution of Reality (the subject matter of the map)
1. Map QuestionWhat do I want to find out?
2. Data SelectionWhich data will shed light on the map question?
3. Data AcquisitionHow do I gather the locational and attribute data I need?
4. Data StorageHow should the data be arranged for efficient retrieval?
Turning “Reality” Into a Map
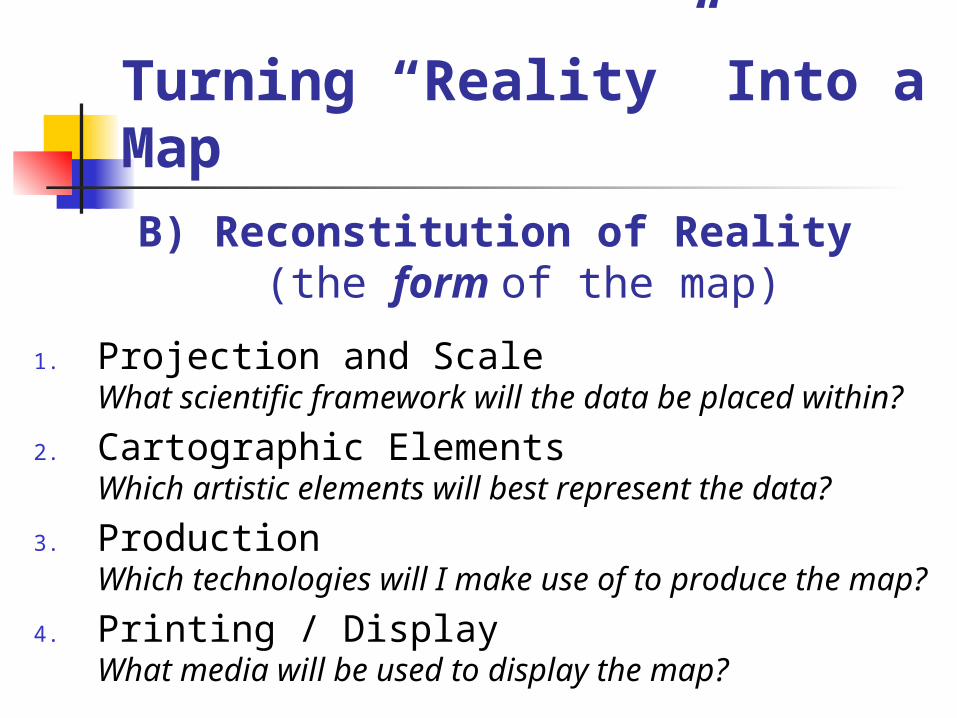
B) Reconstitution of Reality (the form of the map)
1. Projection and ScaleWhat scientific framework will the data be placed within?
2. Cartographic ElementsWhich artistic elements will best represent the data?
3. ProductionWhich technologies will I make use of to produce the map?
4. Printing / DisplayWhat media will be used to display the map?
Turning “Reality” Into a Map
1. Map Question
What do I want to find
out?
In this example I am a free agent cartographer, and I decide I wish to find out something about the limitations of women’s use of the urban environment.
In practice this is most often dictated by legislation, contract or business opportunity. Few cartographers have the opportunity to select their own subject matter.
The question I pose is:“Where do city women spend their time?”
2. Data SelectionWhich data will answer the map
question?
“Where do city women spend their time?”
We can seek data on this question in a variety of ways: for example, applying to register a Census question; searching for the research results of others; or conducting primary research of our own.
Limitations of time and the lack of previous research in this area lead us to conduct our own research. We limit the data collection period to one calendar month, from three women only, collected in 15-minute units.
3. Data AcquisitionHow to gather the locational and attribute
data?
We contact three women who reflect a cross section of ages and incomes. Gaining their consent and promising to protect their privacy, we then ask them to keep a diary for one month.
The women in our sample will account for each 15- minute period of their waking hours, recording where they are and how long they spend there.
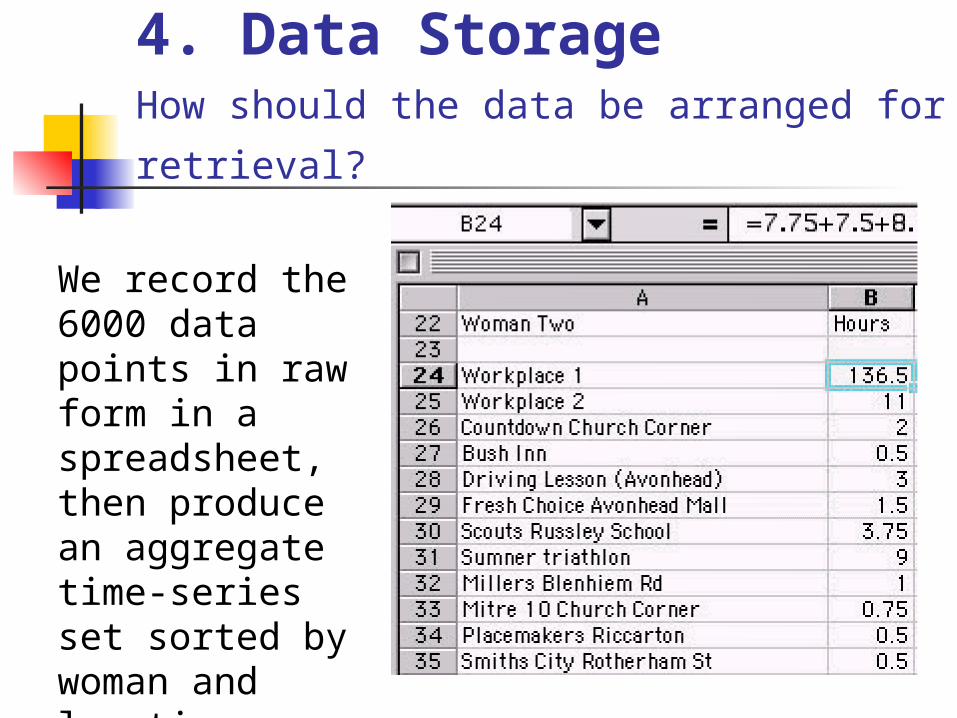
4. Data StorageHow should the data be arranged for
retrieval?
We record the 6000 data points in raw form in a spreadsheet, then produce an aggregate time-series set sorted by woman and location.
5. Projection and ScaleWhat is the scientific framework?
A map projection is …
Map scale is …
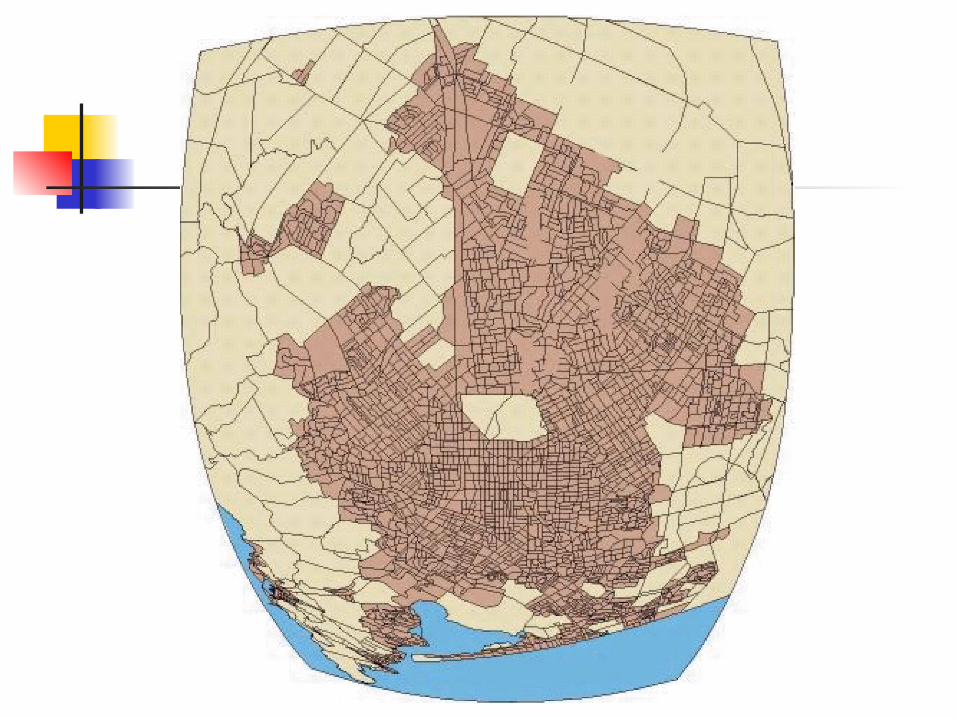
In our example the base map is on a city scale (approximately 1:50,000 to 1:100,000).
However, we will have difficulty positioning all the data points at this scale, as many of them are close to the woman’s home. The solution is to adopt a flexible scale, in which distance between points decreases from the map centre...
6. Cartographic
ElementsWhat artistic elements represents the
data best?
Cartographers use a wide variety of visual resources, such as color, shape, line width, pattern and typography to make their message clear and aesthetically pleasing.
In our example weI face an ethical dilemma: cones would be the best method of representing the attribute data, but this would identify the location too closely, thus breaking our privacy agreement...
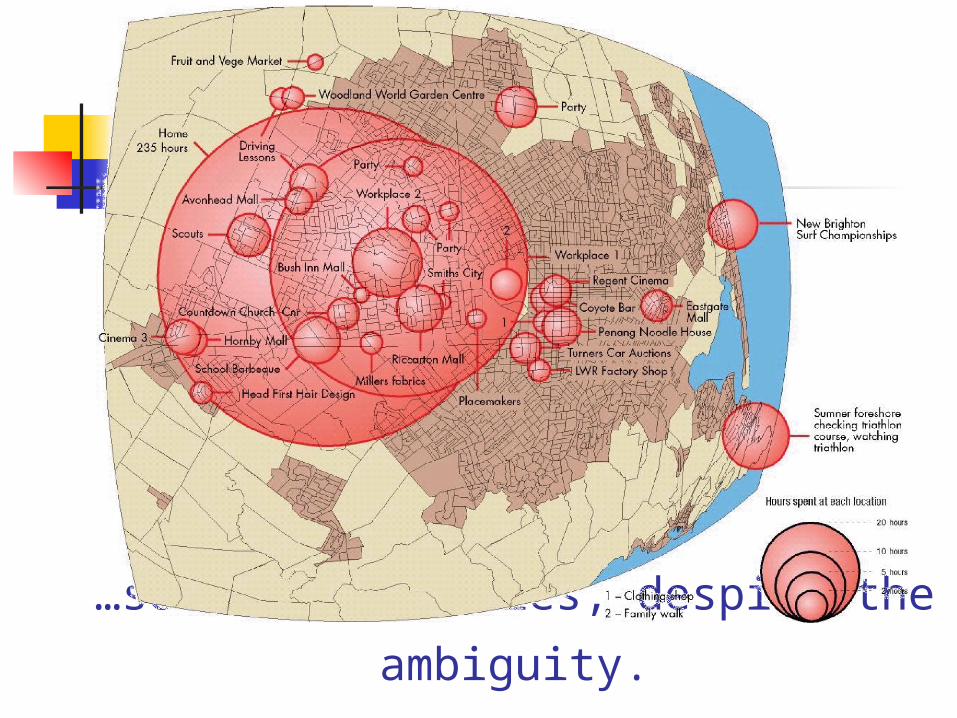
…so we use circles, despite the
ambiguity.
7. ProductionWhat technologies to use for map
production?
The technological revolution of the 20th century has changed the way cartographers approach the task of map making.
The advent of computers have made both data capture and presentation easier in two main areas:
1. automation of previously manual tasks, thereby saving time
2. providing the ability to experiment, making cartographic visualization possible
8. Printing / DisplayWhat media will be used to display the
map?
In the past, the only method of display - and therefore of communication - was printing the map as a loose sheet, or bound with a report or atlas.
The widespread use of computers has led to an explosion of ‘ephemeral’ maps, which appear on screen only, never to be printed out.
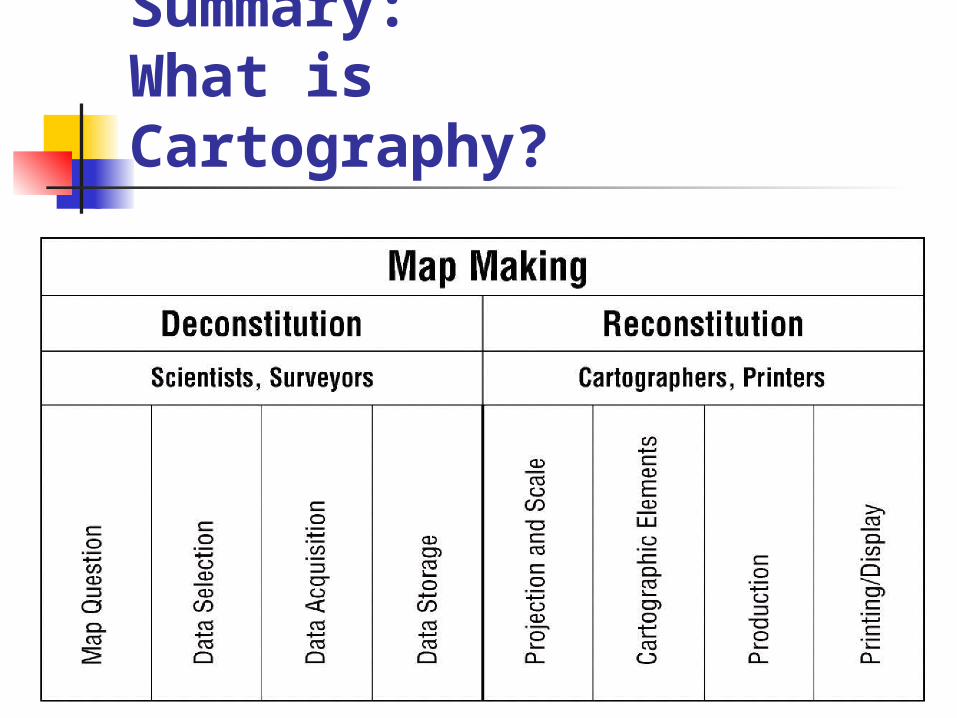
Summary: What is Cartography?
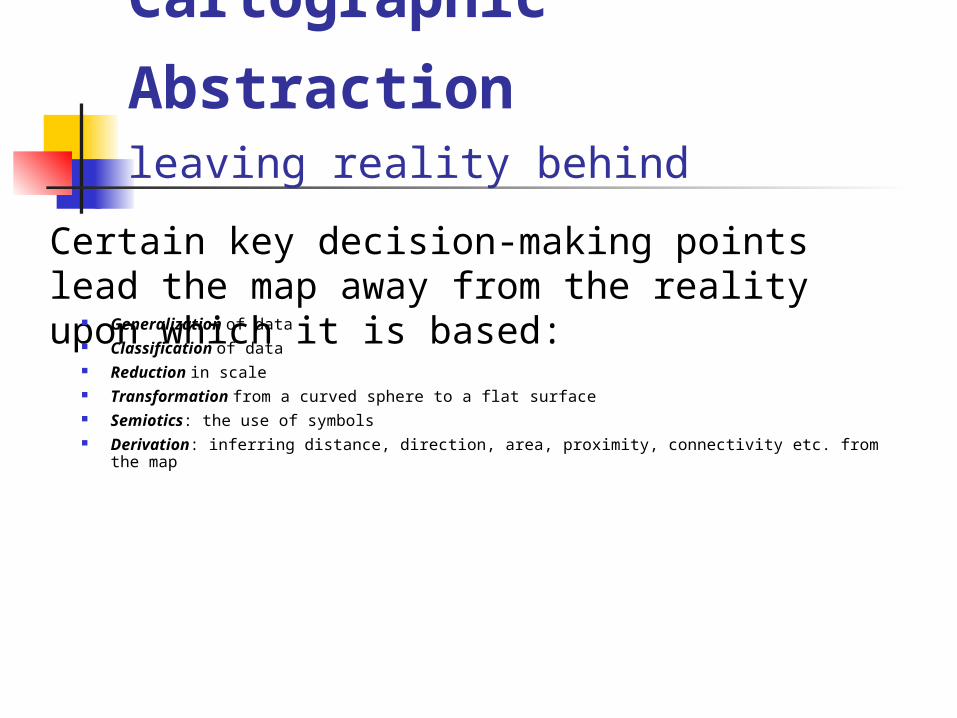
Cartographic
Abstractionleaving reality behind
Certain key decision-making points lead the map away from the reality upon which it is based: Generalization of data
Classification of data Reduction in scale Transformation from a curved sphere to a flat surface Semiotics: the use of symbols Derivation: inferring distance, direction, area, proximity, connectivity etc. from the map
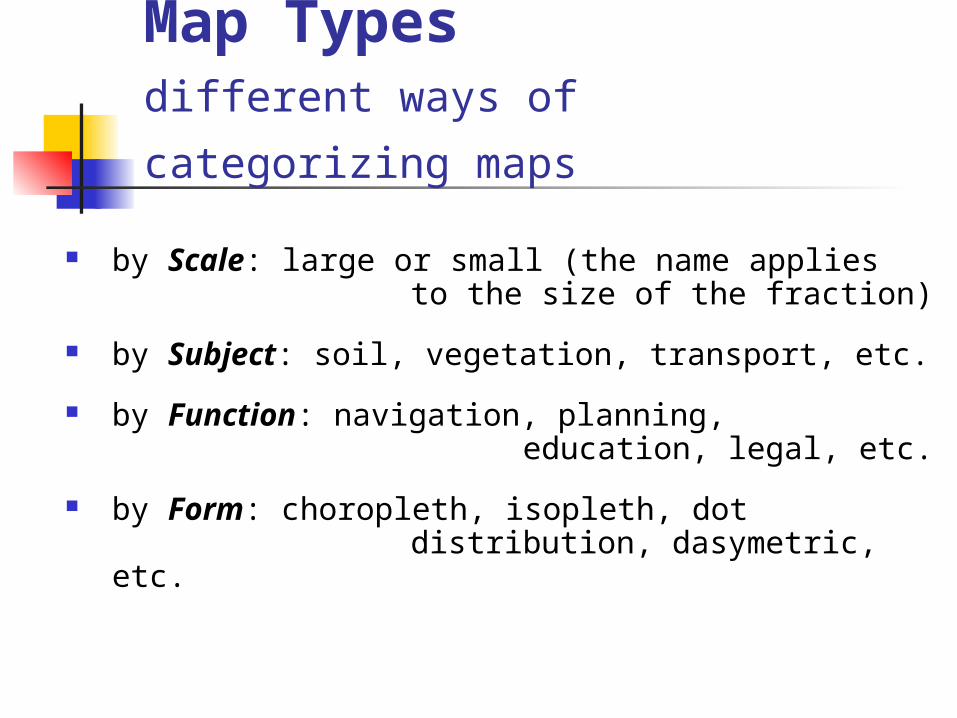
Map Typesdifferent ways of categorizing
maps
by Scale: large or small (the name applies to the size of the fraction)
by Subject: soil, vegetation, transport, etc.
by Function: navigation, planning, education, legal, etc.
by Form: choropleth, isopleth, dot distribution, dasymetric, etc.
Cartographic Communication
Why is Theory Important?
“I don’t believe in maps because it never looks like it says on the maps when you get there.”
“How do people feel about maps? Only 14% of the people in the United States claim to like maps. Even people who claim to like maps use them only as a last choice. Maps are a hassle.”
“Only 34% of map users are women, 39% of households own no maps at all and less that half the population referred to a map of any type during the previous year.”
Why is the map message so hard to understand?
Up until now we have only considered the makers of maps, and the maps themselves
It is time to extend that to consider the theory of cartographic communication
Theory is important because the makers of maps are influenced by others in the communication process
Theory
Two Fundamental Questions
Who are the people/agencies involved in the cartographic communication process?
How do they communicate? or How is meaning transferred?
Models of Cartographic Communication
Process Model
Semiotics
MUGs Model
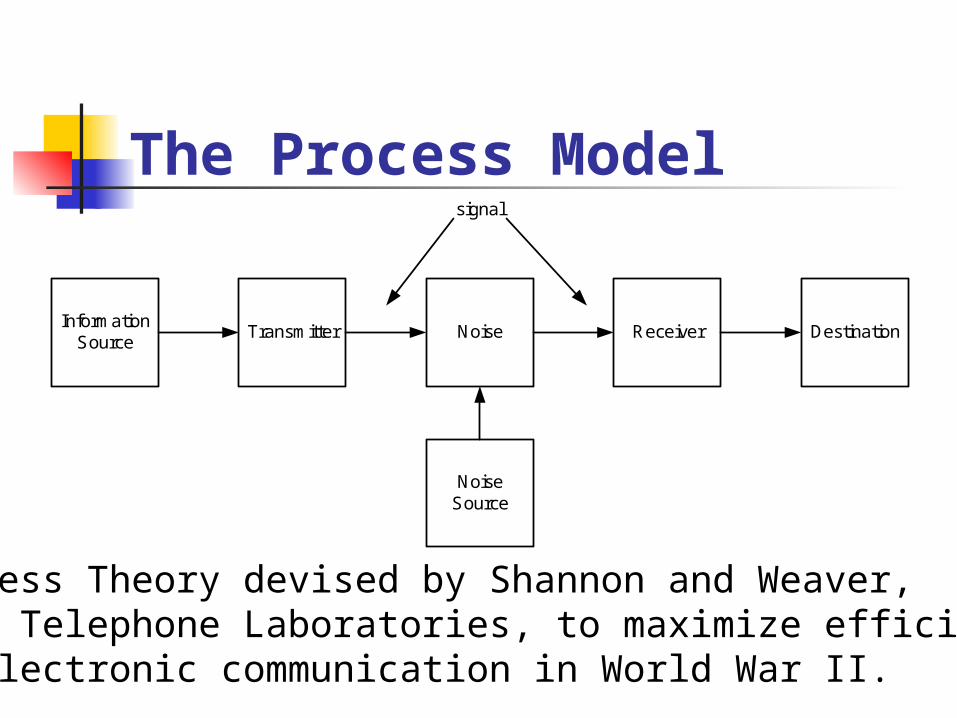
The Process Model
InformationSource
Transmitter Noise Receiver Destination
NoiseSource
signal
Process Theory devised by Shannon and Weaver, Bell Telephone Laboratories, to maximize efficiency of electronic communication in World War II.
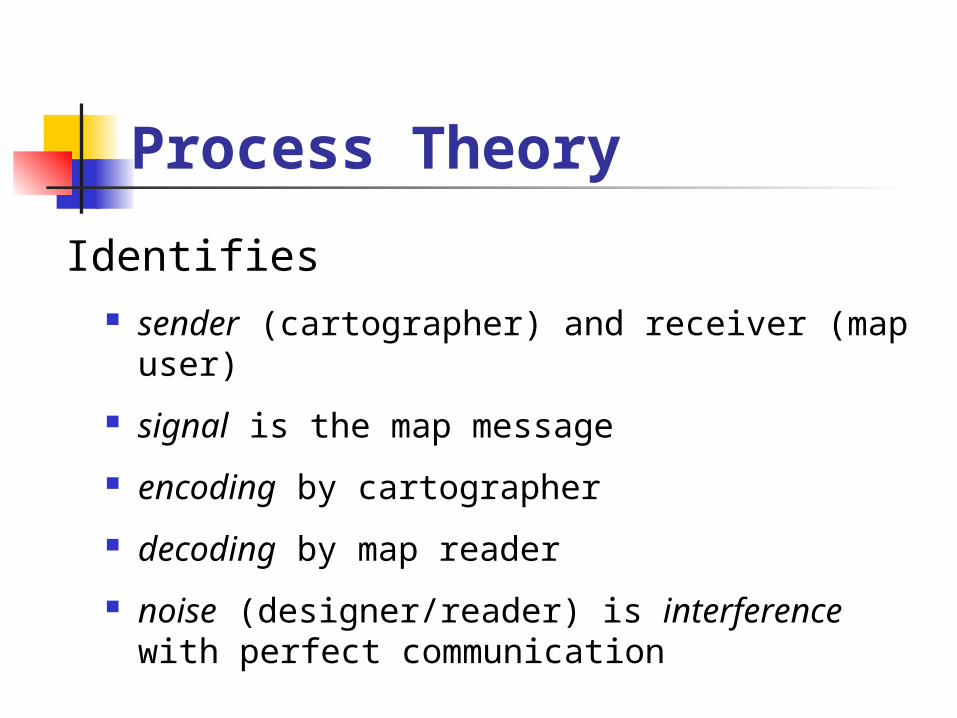
Process Theory
sender (cartographer) and receiver (map user)
signal is the map message
encoding by cartographer
decoding by map reader
noise (designer/reader) is interference with perfect communication
Identifies
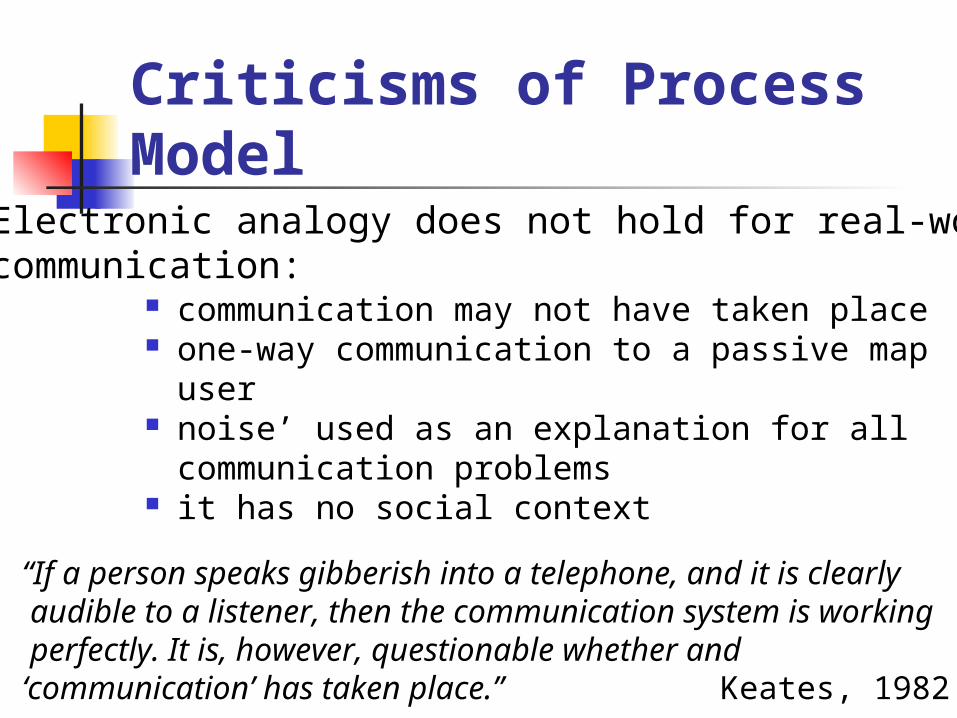
Criticisms of Process Model
communication may not have taken place one-way communication to a passive
map user noise’ used as an explanation for all
communication problems it has no social context
Electronic analogy does not hold for real-world communication:
“If a person speaks gibberish into a telephone, and it is clearly audible to a listener, then the communication system is working perfectly. It is, however, questionable whether and ‘communication’ has taken place.” Keates, 1982
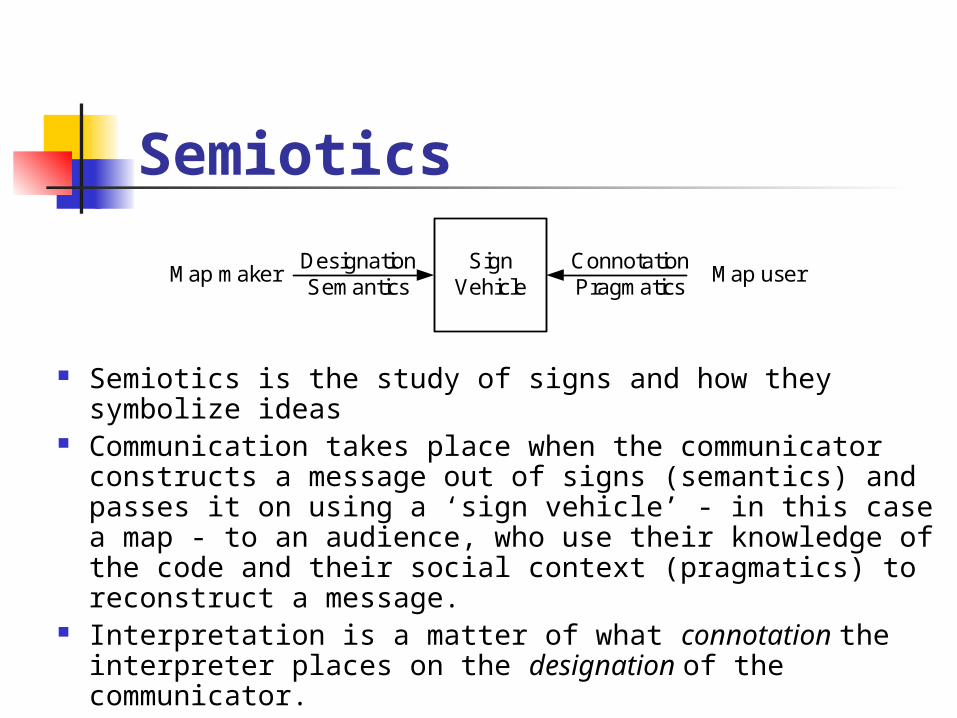
Semiotics
Semiotics is the study of signs and how they symbolize ideas
Communication takes place when the communicator constructs a message out of signs (semantics) and passes it on using a ‘sign vehicle’ - in this case a map - to an audience, who use their knowledge of the code and their social context (pragmatics) to reconstruct a message.
Interpretation is a matter of what connotation the interpreter places on the designation of the communicator.
SignVehicle
DesignationSemantics
ConnotationPragmatics
Map userMap maker
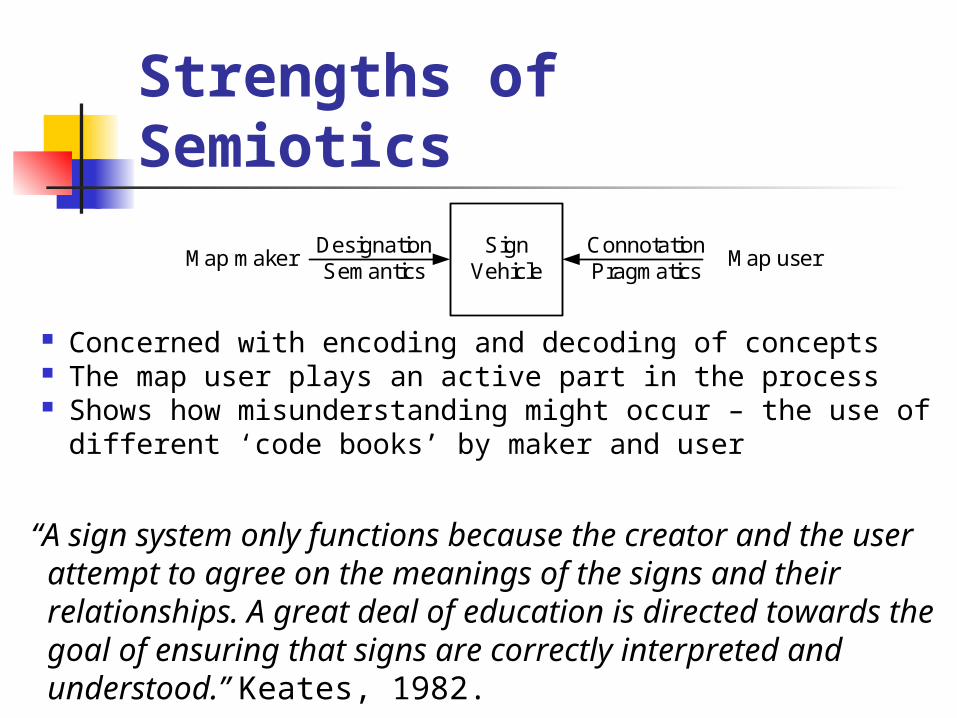
Strengths of Semiotics
Concerned with encoding and decoding of concepts The map user plays an active part in the process Shows how misunderstanding might occur – the use
of different ‘code books’ by maker and user
SignVehicle
DesignationSemantics
ConnotationPragmatics
Map userMap maker
“A sign system only functions because the creator and the user attempt to agree on the meanings of the signs and their relationships. A great deal of education is directed towards the goal of ensuring that signs are correctly interpreted and understood.” Keates, 1982.
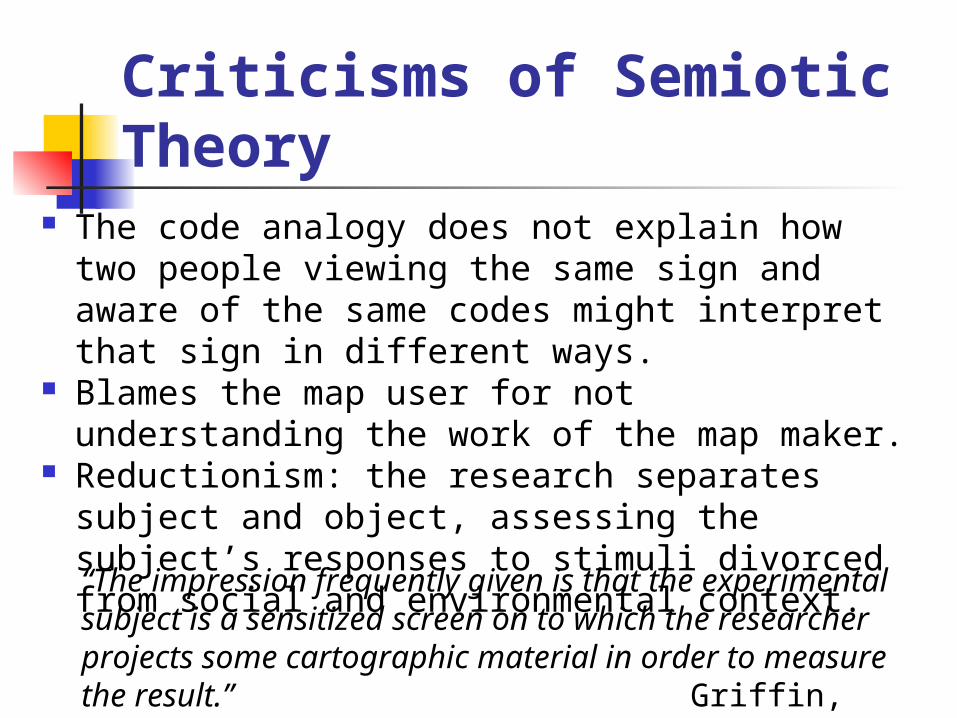
Criticisms of Semiotic Theory
The code analogy does not explain how two people viewing the same sign and aware of the same codes might interpret that sign in different ways.
Blames the map user for not understanding the work of the map maker.
Reductionism: the research separates subject and object, assessing the subject’s responses to stimuli divorced from social and environmental context.“The impression frequently given is that the experimental subject is a sensitized screen on to which the researcher projects some cartographic material in order to measure the result.” Griffin, 1983
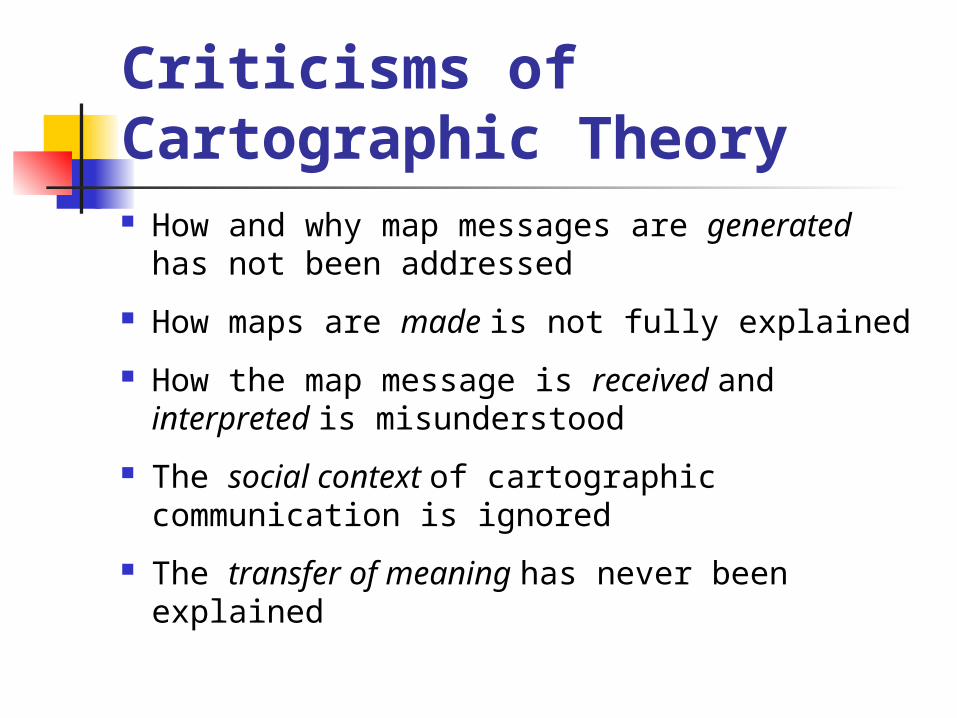
Criticisms of Cartographic Theory How and why map messages are generated
has not been addressed
How maps are made is not fully explained
How the map message is received and interpreted is misunderstood
The social context of cartographic communication is ignored
The transfer of meaning has never been explained
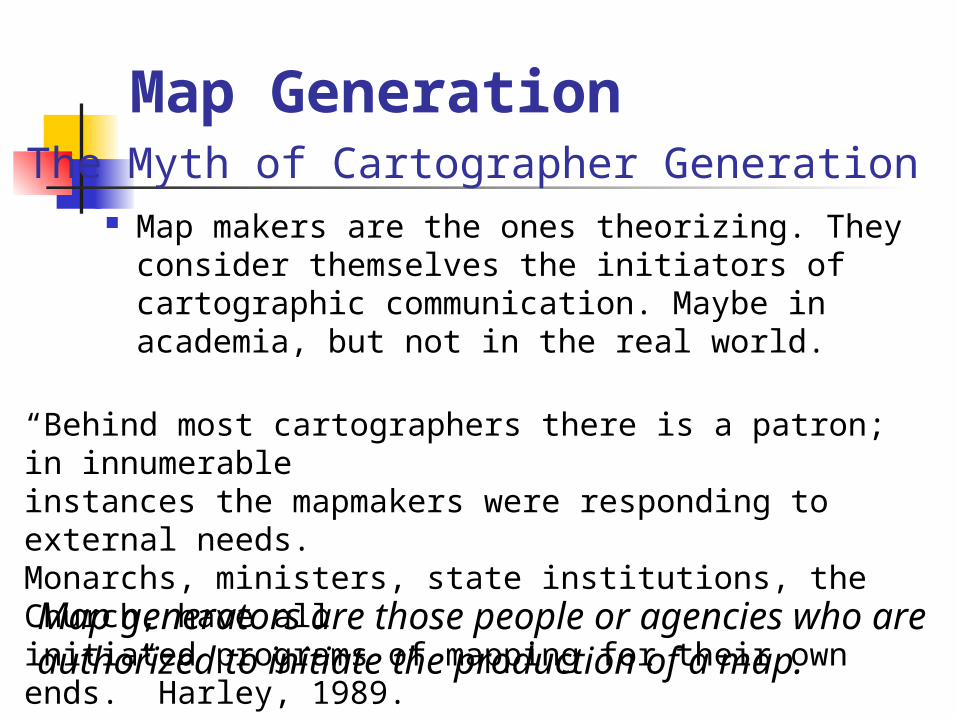
Map Generation
Map makers are the ones theorizing. They consider themselves the initiators of cartographic communication. Maybe in academia, but not in the real world.
The Myth of Cartographer Generation
“Behind most cartographers there is a patron; in innumerableinstances the mapmakers were responding to external needs.Monarchs, ministers, state institutions, the Church, have allinitiated programs of mapping for their own ends.” Harley, 1989.
Map generators are those people or agencies who areauthorized to initiate the production of a map.
Map MakingThe Deconstitution and Reconstitution of Reality
Map Users Targeted and Non-targeted
Maps that are produced for a specificpurpose generally have a narrow audience. Those that cost a large amount to produce are often marketed to a wider audience
The result is that the map user base is widened beyond those originally targeted by generator and maker
The consequences can be summarized in the principle of eavesdropping
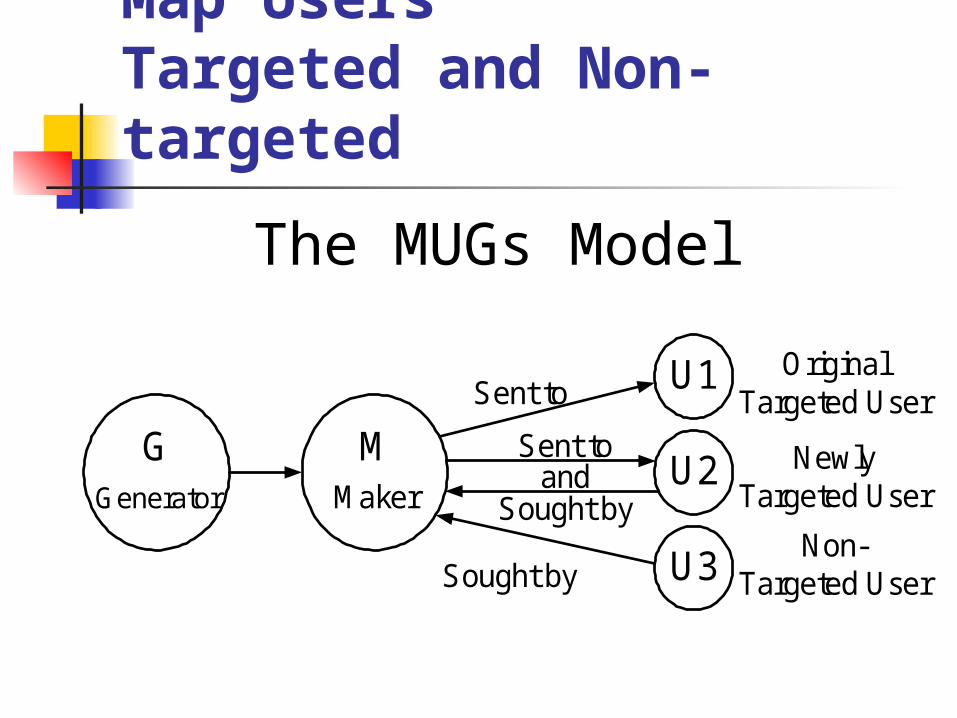
Map Users Targeted and Non-targeted
U3
U2
U1
MMaker
GGenerator
Sought by
Sought by
Sent to
Sent to
and
OriginalTargeted User
NewlyTargeted User
Non-Targeted User
The MUGs Model
The Social Context of Mapping
Maps have evolved in a western culture which is impositional in nature. They have not evolved in a social vacuum.
Maps have been used as instruments to exploit resources and control people.
This social context must influence every step of the process of cartographic communication.
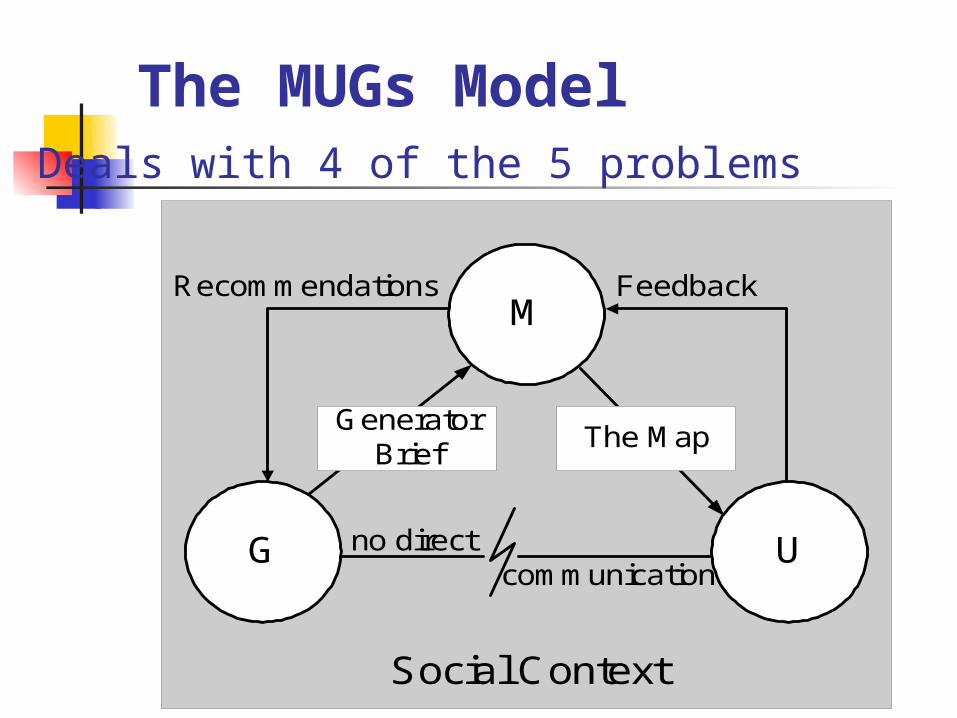
The MUGs ModelDeals with 4 of the 5 problems
M
G
Recommendations
U
Feedback
GeneratorBrief
The Map
no direct communication
Social Context
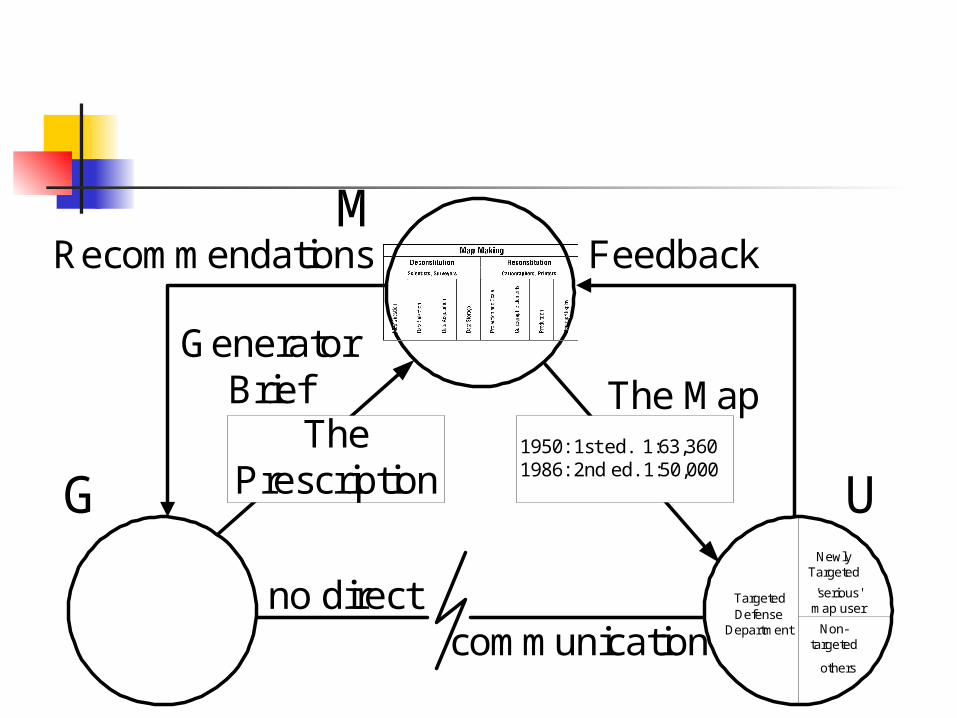
Recommendations
GeneratorBrief
Feedback
ThePrescription
The Map1950: 1st ed. 1:63,3601986: 2nd ed. 1:50,000
no direct communication
M
G U
TargetedDefense
Department
NewlyTargeted
'serious'map user
Non-targeted
others
Transfer of Meaning
Relevance Theory developed for verbal communication
The theory is more flexible and less predictive than others
Concepts in Relevance Theory
Face
Ostention
Manifestness
Inference
Relevance
Concepts in Relevance Theory
Face We use words to save face for ourselves
or for others. The ritual apology which everyone knows is insincere nevertheless saves face.
Maps are a ritualized, one-way interaction ritual between egocentric selves
The generators of map communication seek to impose their ideas on others, known in Relevance
Theory as a face attack
Concepts in Relevance Theory
Ostention
An ostensive act signals to the audience the intention to communicate
Advertising is a blatant form of ostention
Maps are not very good at this!
The title of a map is usually the ostensive act
Concepts in Relevance Theory
Manifestness
How can map generator, maker and user share contexts when they never meet?
We assume common experiences will make the intention of the communication manifest
Maps tend to have many things weakly manifest compared to other forms of communication
Concepts in Relevance Theory
Inference
Map semiotics can be ambiguous, so to recover meaning we infer from the context of the map and our experiences
Maps are made up of inferences and abstractions
e.g. contour lines to infer elevation
We use a process of suitably constrained guesswork to infer meaning
Concepts in Relevance Theory
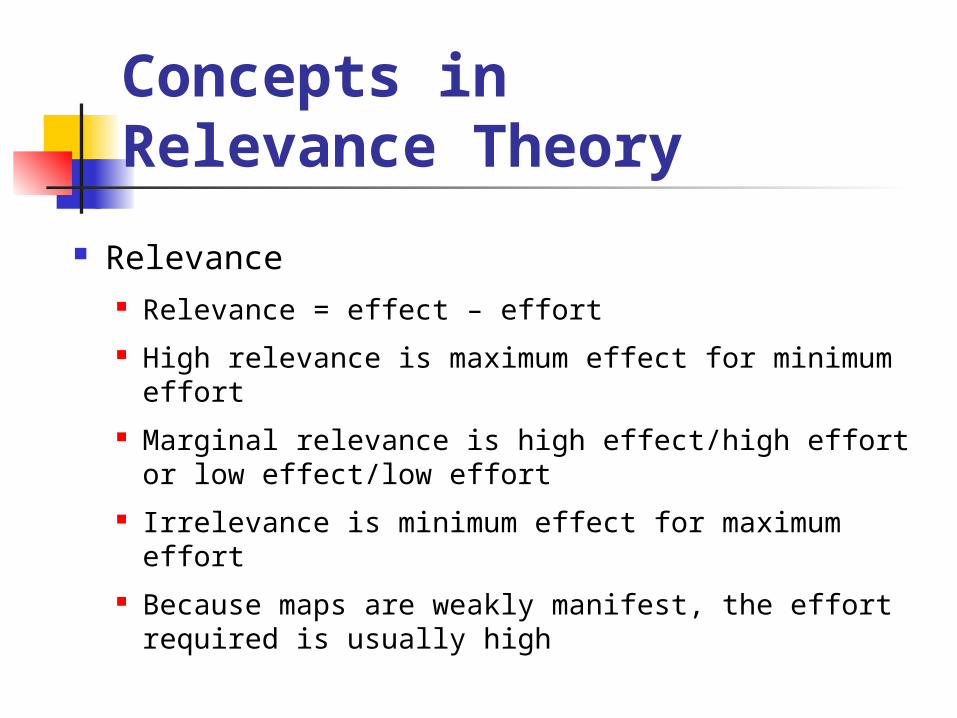
Relevance Relevance = effect – effort High relevance is maximum effect for minimum
effort Marginal relevance is high effect/high effort or low
effect/low effort Irrelevance is minimum effect for maximum effort Because maps are weakly manifest, the effort
required is usually high
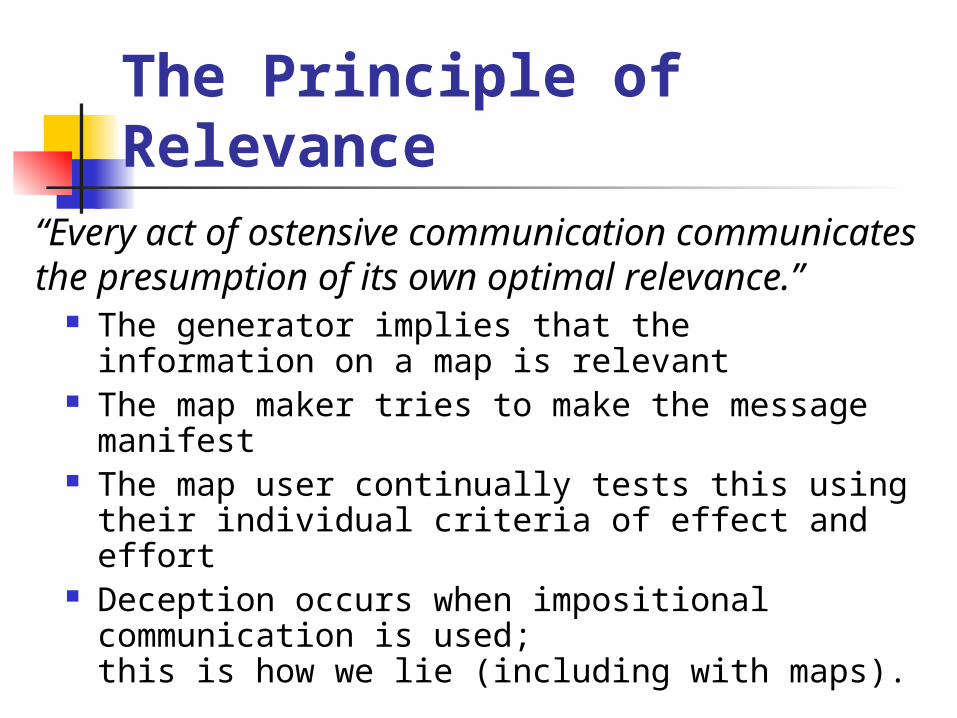
The Principle of Relevance
The generator implies that the information on a map is relevant
The map maker tries to make the message manifest
The map user continually tests this using their individual criteria of effect and effort
Deception occurs when impositional communication is used; this is how we lie (including with maps).
“Every act of ostensive communication communicates the presumption of its own optimal relevance.”


![[Kirkpatrick] Everyday Idioms](https://img.pdfslide.us/doc/110x75/577cd03c1a28ab9e7891c2a6/kirkpatrick-everyday-idioms.jpg)