Embed Size (px)
Citation preview
www.ThinkForex.com
www.ThinkForex.com email: [email protected]: + 61 3 9093 3400
INTERMEDIATE TRADING GUIDE
INTRODUCTION TO CANDLESTICK PATTERNSLearning to Read Basic Candlestick Patterns
www.ThinkForex.com
www.ThinkForex.com email: [email protected]: + 61 3 9093 3400
www.ThinkForex.com
www.ThinkForex.com email: [email protected]: + 61 3 9093 3400
CANDLESTICKS TECHNICAL ANALYSIS
2
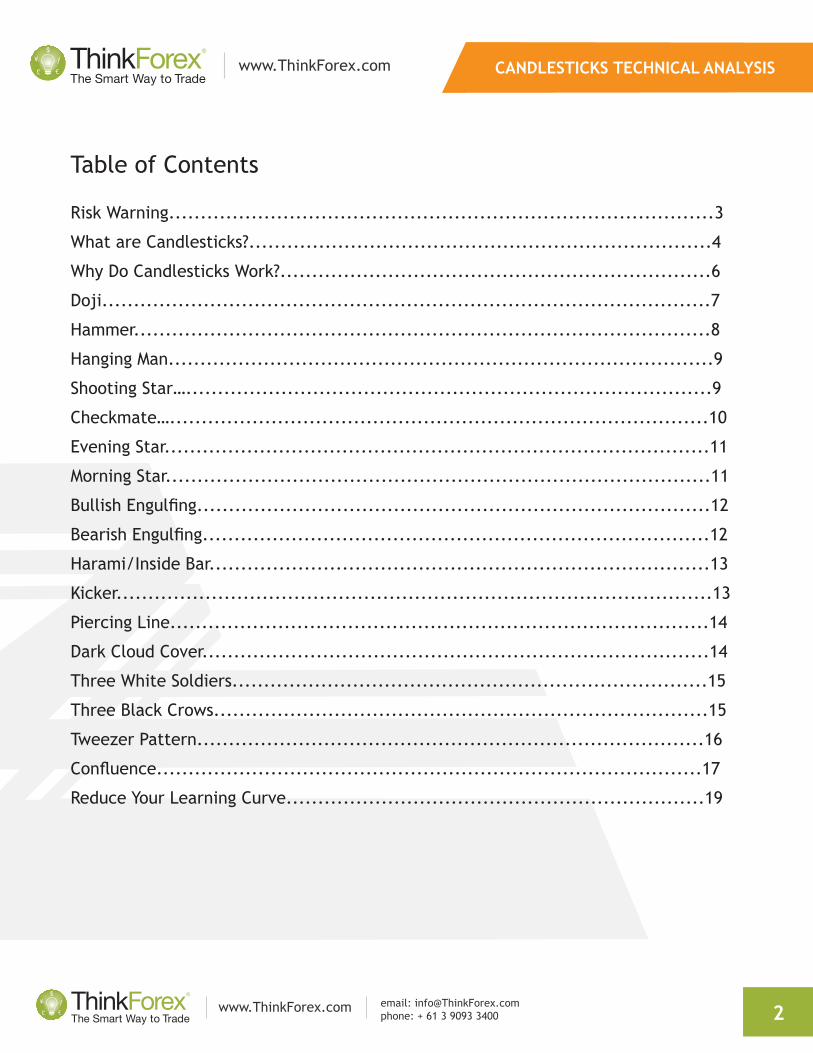
Table of Contents
Risk Warning......................................................................................3
What are Candlesticks?.........................................................................4
Why Do Candlesticks Work?....................................................................6
Doji................................................................................................7
Hammer...........................................................................................8
Hanging Man......................................................................................9
Shooting Star…...................................................................................9
Checkmate….....................................................................................10
Evening Star......................................................................................11
Morning Star......................................................................................11
Bullish Engulfing.................................................................................12
Bearish Engulfing................................................................................12
Harami/Inside Bar...............................................................................13
Kicker..............................................................................................13
Piercing Line.....................................................................................14
Dark Cloud Cover................................................................................14
Three White Soldiers...........................................................................15
Three Black Crows..............................................................................15
Tweezer Pattern................................................................................16
Confluence......................................................................................17
Reduce Your Learning Curve..................................................................19
CANDLESTICKS TECHNICAL ANALYSIS
www.ThinkForex.com
www.ThinkForex.com email: [email protected]: + 61 3 9093 3400
www.ThinkForex.com
www.ThinkForex.com email: [email protected]: + 61 3 9093 3400
CANDLESTICKS TECHNICAL ANALYSIS
3
Risk Warning
Risk Warning: Trading Forex and Derivatives carries a high level of risk. CFD investors do not own,
or have any rights to, the underlying assets. It involves the potential for profit as well as the risk of
loss which may vastly exceed the amount of your initial investment and is not suitable for all investors.
Please ensure that you fully understand the risks involved, and seek independent advice if necessary.
Also, see the section titled “Significant Risks” in our Product Disclosure Statement, which also includes
risks associated with the use of third parties and software plugins. A Financial Services Guide (FSG)
and Product Disclosure Statements (PDS) for these products is available from TF GLOBAL MARKETS (AUST)
PTY LTD by going to http://www.thinkforex.com/why-thinkforex/regulation/legal to download at this
website or hard copies can be sent by contacting the offices at the number above.
The FSG and PDS should be considered before deciding to enter into any Derivative transactions with
TF GLOBAL MARKETS (AUST) PTY LTD. The information on this site is not directed at residents in any
country or jurisdiction where such distribution or use would be contrary to local law or regulation.
©2014 TF GLOBAL MARKETS (AUST) PTY LTD. All rights reserved. AFSL 424700. ABN 69 158 361 561.
*Free: Items that are indicated as FREE are available without any terms and conditions, with the
exception of any promotional offers that have terms and conditions attached.
www.ThinkForex.com
www.ThinkForex.com email: [email protected]: + 61 3 9093 3400
www.ThinkForex.com
www.ThinkForex.com email: [email protected]: + 61 3 9093 3400
CANDLESTICKS TECHNICAL ANALYSIS
4
What are Candlesticks?
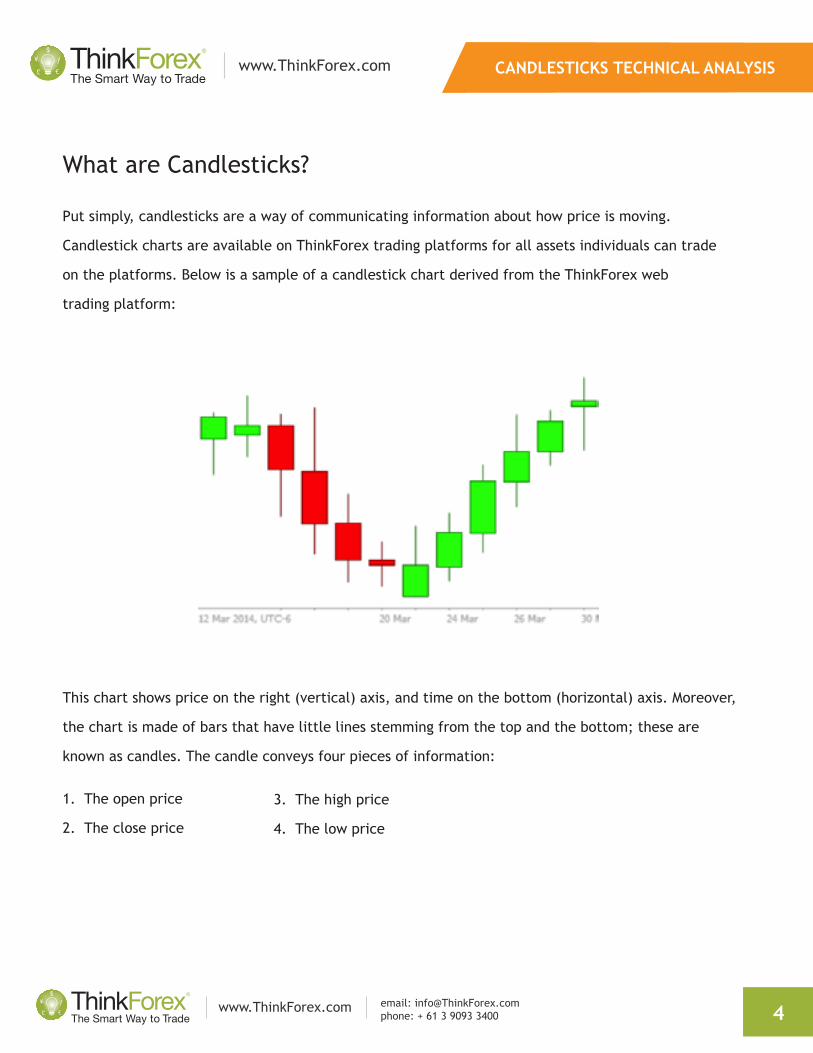
Put simply, candlesticks are a way of communicating information about how price is moving.
Candlestick charts are available on ThinkForex trading platforms for all assets individuals can trade
on the platforms. Below is a sample of a candlestick chart derived from the ThinkForex web
trading platform:
This chart shows price on the right (vertical) axis, and time on the bottom (horizontal) axis. Moreover,
the chart is made of bars that have little lines stemming from the top and the bottom; these are
known as candles. The candle conveys four pieces of information:
1. The open price
2. The close price
3. The high price
4. The low price
CANDLESTICKS TECHNICAL ANALYSIS
www.ThinkForex.com
www.ThinkForex.com email: [email protected]: + 61 3 9093 3400
www.ThinkForex.com
www.ThinkForex.com email: [email protected]: + 61 3 9093 3400
CANDLESTICKS TECHNICAL ANALYSIS
5
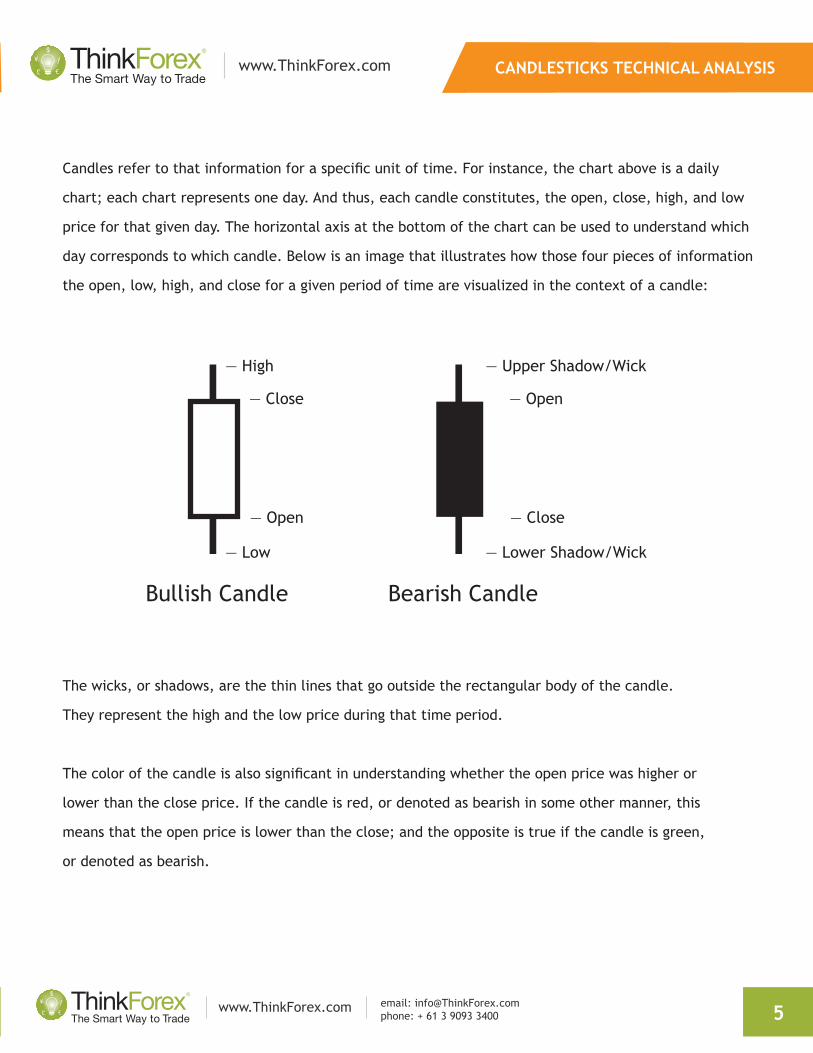
Candles refer to that information for a specific unit of time. For instance, the chart above is a daily
chart; each chart represents one day. And thus, each candle constitutes, the open, close, high, and low
price for that given day. The horizontal axis at the bottom of the chart can be used to understand which
day corresponds to which candle. Below is an image that illustrates how those four pieces of information
the open, low, high, and close for a given period of time are visualized in the context of a candle:
The wicks, or shadows, are the thin lines that go outside the rectangular body of the candle.
They represent the high and the low price during that time period.
The color of the candle is also significant in understanding whether the open price was higher or
lower than the close price. If the candle is red, or denoted as bearish in some other manner, this
means that the open price is lower than the close; and the opposite is true if the candle is green,
or denoted as bearish.
— High — Upper Shadow/Wick
— Low — Lower Shadow/Wick
Bullish Candle Bearish Candle
— Close — Open
— Open — Close
www.ThinkForex.com
www.ThinkForex.com email: [email protected]: + 61 3 9093 3400
www.ThinkForex.com
www.ThinkForex.com email: [email protected]: + 61 3 9093 3400
CANDLESTICKS TECHNICAL ANALYSIS
6
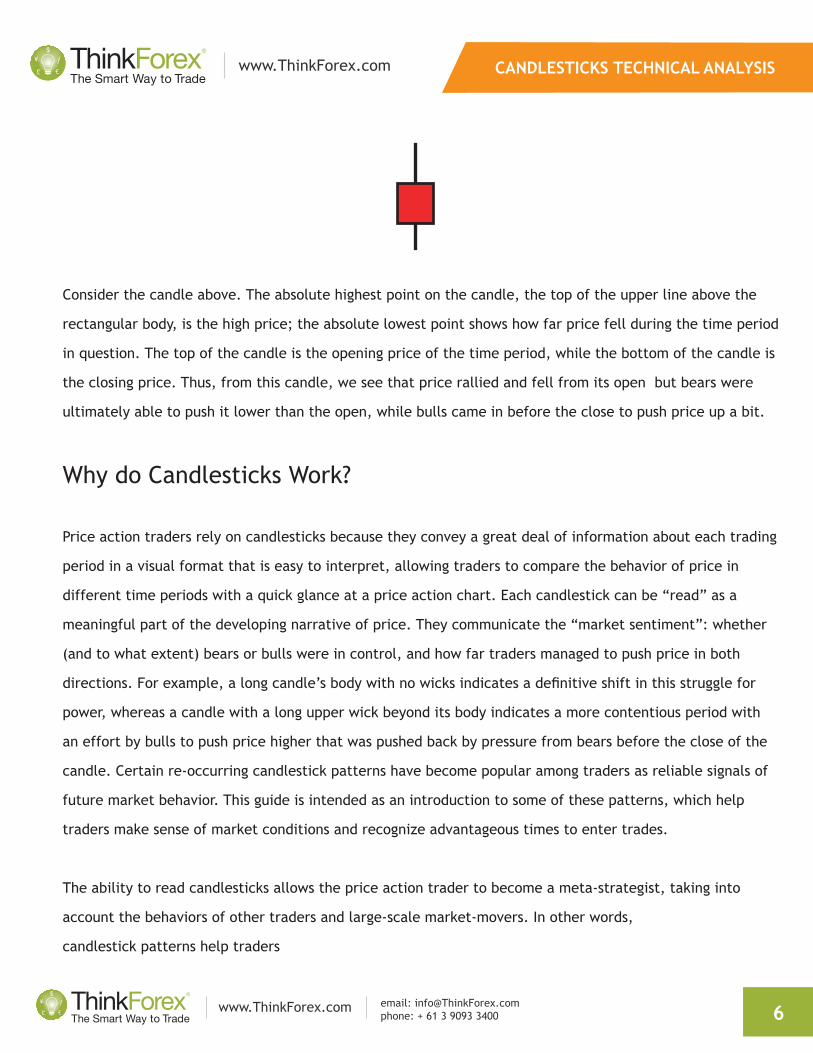
Consider the candle above. The absolute highest point on the candle, the top of the upper line above the
rectangular body, is the high price; the absolute lowest point shows how far price fell during the time period
in question. The top of the candle is the opening price of the time period, while the bottom of the candle is
the closing price. Thus, from this candle, we see that price rallied and fell from its open but bears were
ultimately able to push it lower than the open, while bulls came in before the close to push price up a bit.
Why do Candlesticks Work?
Price action traders rely on candlesticks because they convey a great deal of information about each trading
period in a visual format that is easy to interpret, allowing traders to compare the behavior of price in
different time periods with a quick glance at a price action chart. Each candlestick can be “read” as a
meaningful part of the developing narrative of price. They communicate the “market sentiment”: whether
(and to what extent) bears or bulls were in control, and how far traders managed to push price in both
directions. For example, a long candle’s body with no wicks indicates a definitive shift in this struggle for
power, whereas a candle with a long upper wick beyond its body indicates a more contentious period with
an effort by bulls to push price higher that was pushed back by pressure from bears before the close of the
candle. Certain re-occurring candlestick patterns have become popular among traders as reliable signals of
future market behavior. This guide is intended as an introduction to some of these patterns, which help
traders make sense of market conditions and recognize advantageous times to enter trades.
The ability to read candlesticks allows the price action trader to become a meta-strategist, taking into
account the behaviors of other traders and large-scale market-movers. In other words,
candlestick patterns help traders
CANDLESTICKS TECHNICAL ANALYSIS
www.ThinkForex.com
www.ThinkForex.com email: [email protected]: + 61 3 9093 3400
www.ThinkForex.com
www.ThinkForex.com email: [email protected]: + 61 3 9093 3400
CANDLESTICKS TECHNICAL ANALYSIS
7
What are Candlesticks?
calibrate their own trading with the fluctuations and reversals of larger, more influential participants in
market, often referred to as “Smart Money”, so that traders can identify and participate in significant
price moves.
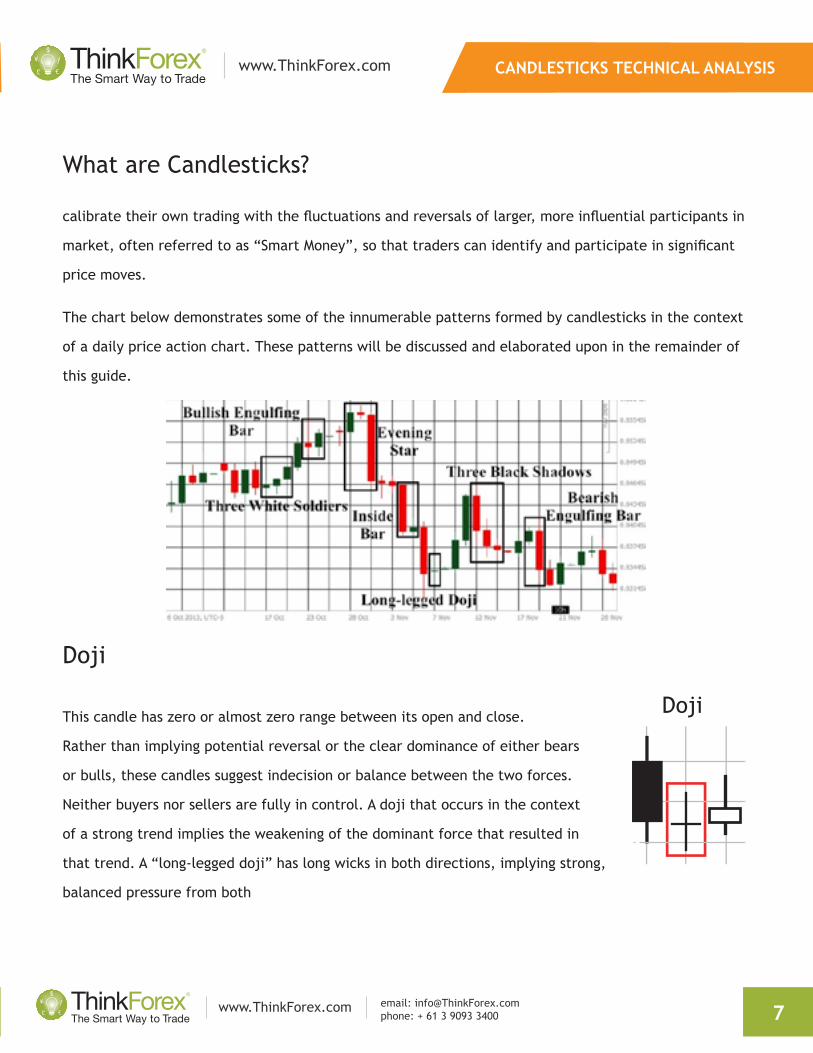
The chart below demonstrates some of the innumerable patterns formed by candlesticks in the context
of a daily price action chart. These patterns will be discussed and elaborated upon in the remainder of
this guide.
Doji
This candle has zero or almost zero range between its open and close.
Rather than implying potential reversal or the clear dominance of either bears
or bulls, these candles suggest indecision or balance between the two forces.
Neither buyers nor sellers are fully in control. A doji that occurs in the context
of a strong trend implies the weakening of the dominant force that resulted in
that trend. A “long-legged doji” has long wicks in both directions, implying strong,
balanced pressure from both
Doji
www.ThinkForex.com
www.ThinkForex.com email: [email protected]: + 61 3 9093 3400
www.ThinkForex.com
www.ThinkForex.com email: [email protected]: + 61 3 9093 3400
CANDLESTICKS TECHNICAL ANALYSIS
8
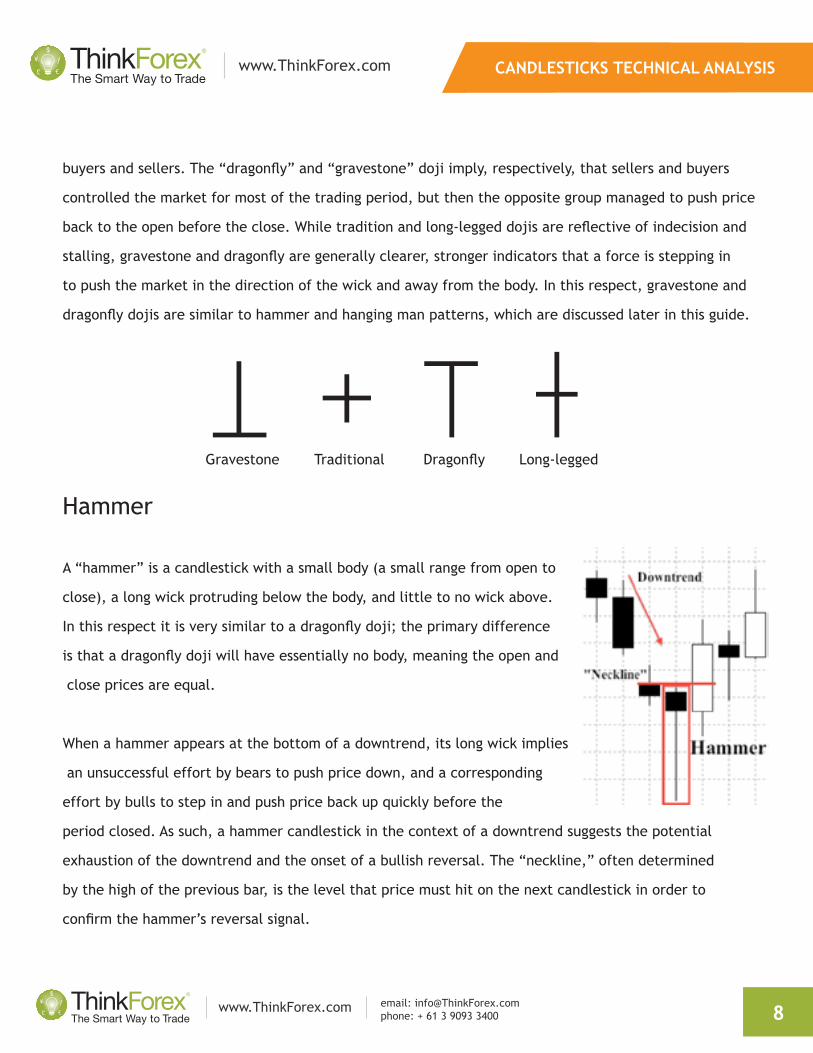
buyers and sellers. The “dragonfly” and “gravestone” doji imply, respectively, that sellers and buyers
controlled the market for most of the trading period, but then the opposite group managed to push price
back to the open before the close. While tradition and long-legged dojis are reflective of indecision and
stalling, gravestone and dragonfly are generally clearer, stronger indicators that a force is stepping in
to push the market in the direction of the wick and away from the body. In this respect, gravestone and
dragonfly dojis are similar to hammer and hanging man patterns, which are discussed later in this guide.
Hammer
A “hammer” is a candlestick with a small body (a small range from open to
close), a long wick protruding below the body, and little to no wick above.
In this respect it is very similar to a dragonfly doji; the primary difference
is that a dragonfly doji will have essentially no body, meaning the open and
close prices are equal.
When a hammer appears at the bottom of a downtrend, its long wick implies
an unsuccessful effort by bears to push price down, and a corresponding
effort by bulls to step in and push price back up quickly before the
period closed. As such, a hammer candlestick in the context of a downtrend suggests the potential
exhaustion of the downtrend and the onset of a bullish reversal. The “neckline,” often determined
by the high of the previous bar, is the level that price must hit on the next candlestick in order to
confirm the hammer’s reversal signal.
Gravestone Traditional Dragonfly Long-legged
CANDLESTICKS TECHNICAL ANALYSIS
www.ThinkForex.com
www.ThinkForex.com email: [email protected]: + 61 3 9093 3400
www.ThinkForex.com
www.ThinkForex.com email: [email protected]: + 61 3 9093 3400
CANDLESTICKS TECHNICAL ANALYSIS
9
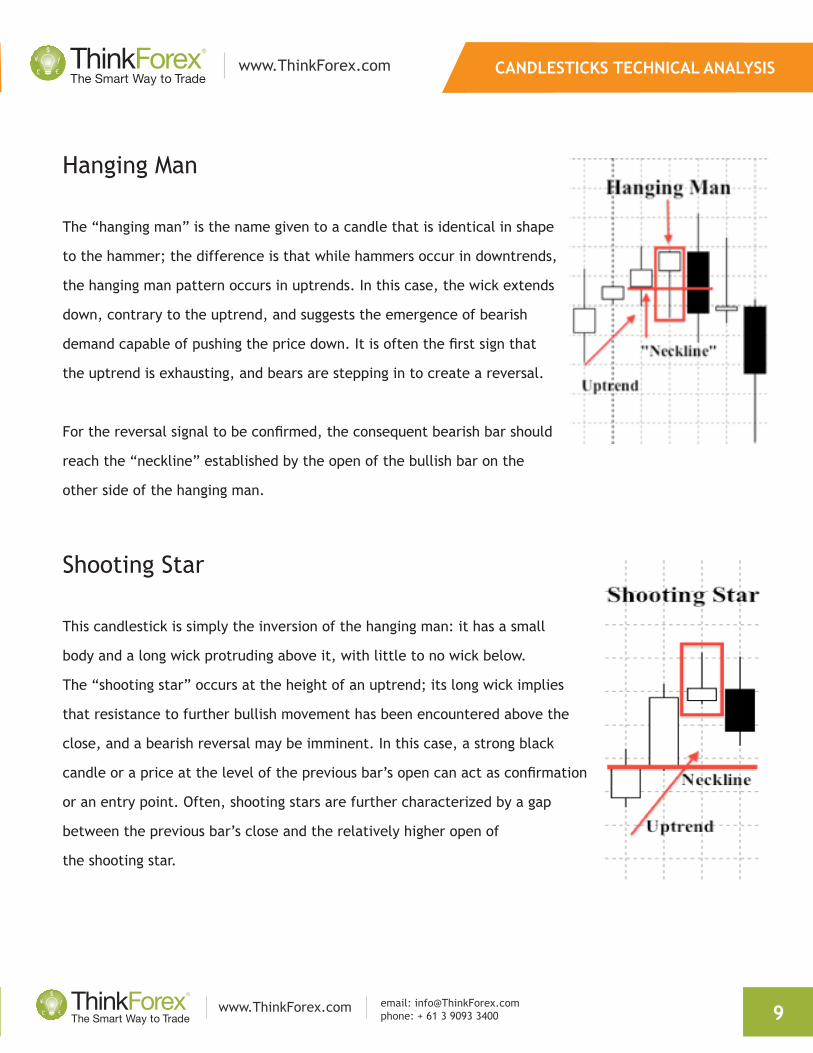
Hanging Man
The “hanging man” is the name given to a candle that is identical in shape
to the hammer; the difference is that while hammers occur in downtrends,
the hanging man pattern occurs in uptrends. In this case, the wick extends
down, contrary to the uptrend, and suggests the emergence of bearish
demand capable of pushing the price down. It is often the first sign that
the uptrend is exhausting, and bears are stepping in to create a reversal.
For the reversal signal to be confirmed, the consequent bearish bar should
reach the “neckline” established by the open of the bullish bar on the
other side of the hanging man.
Shooting Star
This candlestick is simply the inversion of the hanging man: it has a small
body and a long wick protruding above it, with little to no wick below.
The “shooting star” occurs at the height of an uptrend; its long wick implies
that resistance to further bullish movement has been encountered above the
close, and a bearish reversal may be imminent. In this case, a strong black
candle or a price at the level of the previous bar’s open can act as confirmation
or an entry point. Often, shooting stars are further characterized by a gap
between the previous bar’s close and the relatively higher open of
the shooting star.
www.ThinkForex.com
www.ThinkForex.com email: [email protected]: + 61 3 9093 3400
www.ThinkForex.com
www.ThinkForex.com email: [email protected]: + 61 3 9093 3400
CANDLESTICKS TECHNICAL ANALYSIS
10
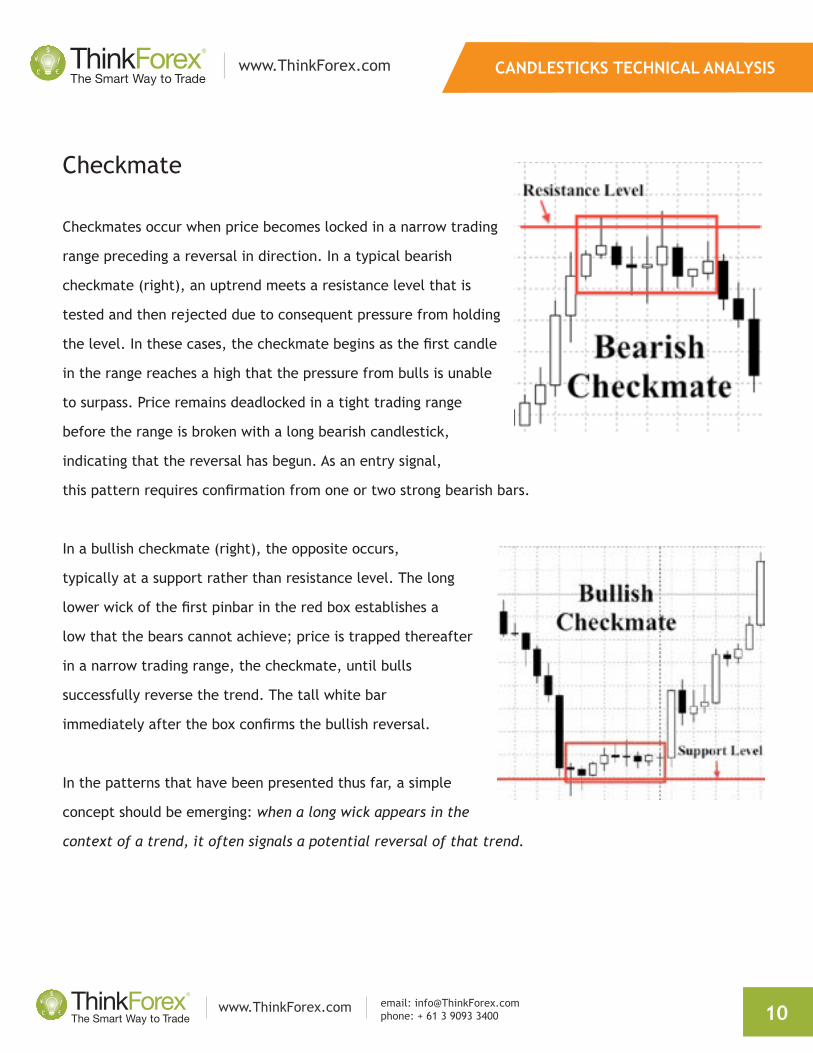
Checkmate
Checkmates occur when price becomes locked in a narrow trading
range preceding a reversal in direction. In a typical bearish
checkmate (right), an uptrend meets a resistance level that is
tested and then rejected due to consequent pressure from holding
the level. In these cases, the checkmate begins as the first candle
in the range reaches a high that the pressure from bulls is unable
to surpass. Price remains deadlocked in a tight trading range
before the range is broken with a long bearish candlestick,
indicating that the reversal has begun. As an entry signal,
this pattern requires confirmation from one or two strong bearish bars.
In a bullish checkmate (right), the opposite occurs,
typically at a support rather than resistance level. The long
lower wick of the first pinbar in the red box establishes a
low that the bears cannot achieve; price is trapped thereafter
in a narrow trading range, the checkmate, until bulls
successfully reverse the trend. The tall white bar
immediately after the box confirms the bullish reversal.
In the patterns that have been presented thus far, a simple
concept should be emerging: when a long wick appears in the
context of a trend, it often signals a potential reversal of that trend.
CANDLESTICKS TECHNICAL ANALYSIS
www.ThinkForex.com
www.ThinkForex.com email: [email protected]: + 61 3 9093 3400
www.ThinkForex.com
www.ThinkForex.com email: [email protected]: + 61 3 9093 3400
CANDLESTICKS TECHNICAL ANALYSIS
11
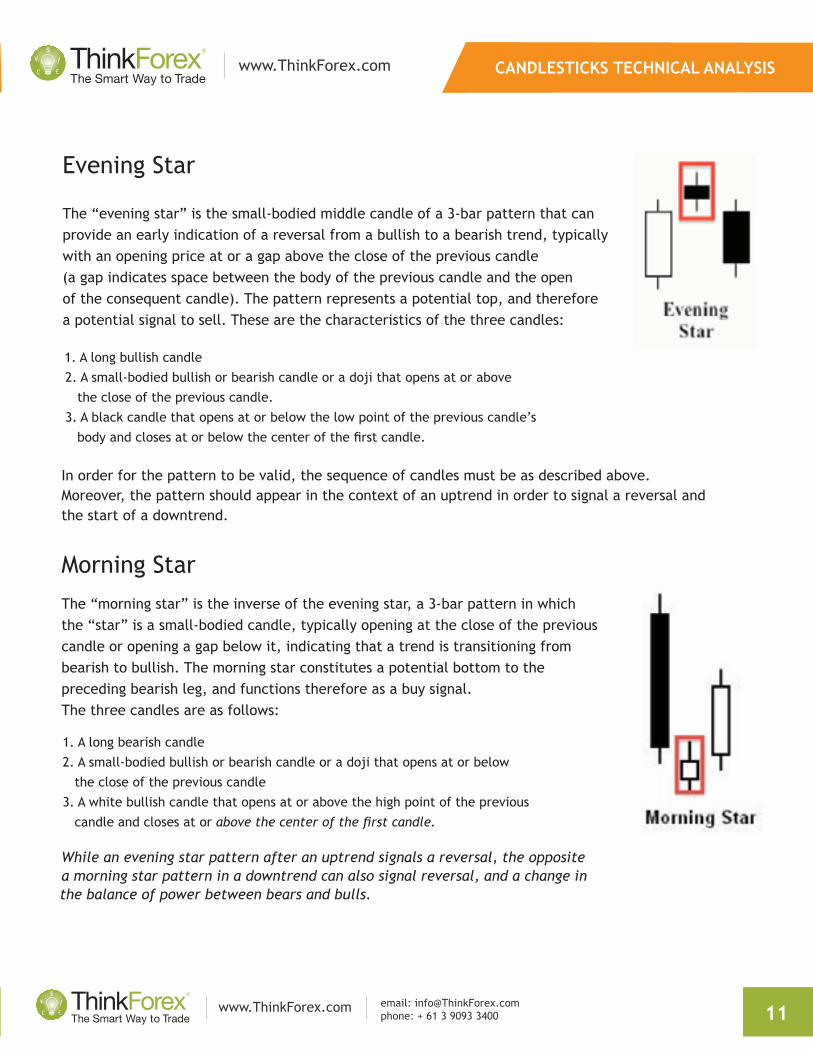
Evening Star
The “evening star” is the small-bodied middle candle of a 3-bar pattern that can provide an early indication of a reversal from a bullish to a bearish trend, typically with an opening price at or a gap above the close of the previous candle (a gap indicates space between the body of the previous candle and the open of the consequent candle). The pattern represents a potential top, and therefore a potential signal to sell. These are the characteristics of the three candles:
1. A long bullish candle 2. A small-bodied bullish or bearish candle or a doji that opens at or above the close of the previous candle. 3. A black candle that opens at or below the low point of the previous candle’s body and closes at or below the center of the first candle.
1. A long bearish candle2. A small-bodied bullish or bearish candle or a doji that opens at or below the close of the previous candle3. A white bullish candle that opens at or above the high point of the previous candle and closes at or above the center of the first candle.
Morning Star The “morning star” is the inverse of the evening star, a 3-bar pattern in which the “star” is a small-bodied candle, typically opening at the close of the previous candle or opening a gap below it, indicating that a trend is transitioning from bearish to bullish. The morning star constitutes a potential bottom to the preceding bearish leg, and functions therefore as a buy signal. The three candles are as follows:
While an evening star pattern after an uptrend signals a reversal, the oppositea morning star pattern in a downtrend can also signal reversal, and a change in the balance of power between bears and bulls.
In order for the pattern to be valid, the sequence of candles must be as described above. Moreover, the pattern should appear in the context of an uptrend in order to signal a reversal and the start of a downtrend.
www.ThinkForex.com
www.ThinkForex.com email: [email protected]: + 61 3 9093 3400
www.ThinkForex.com
www.ThinkForex.com email: [email protected]: + 61 3 9093 3400
CANDLESTICKS TECHNICAL ANALYSIS
12
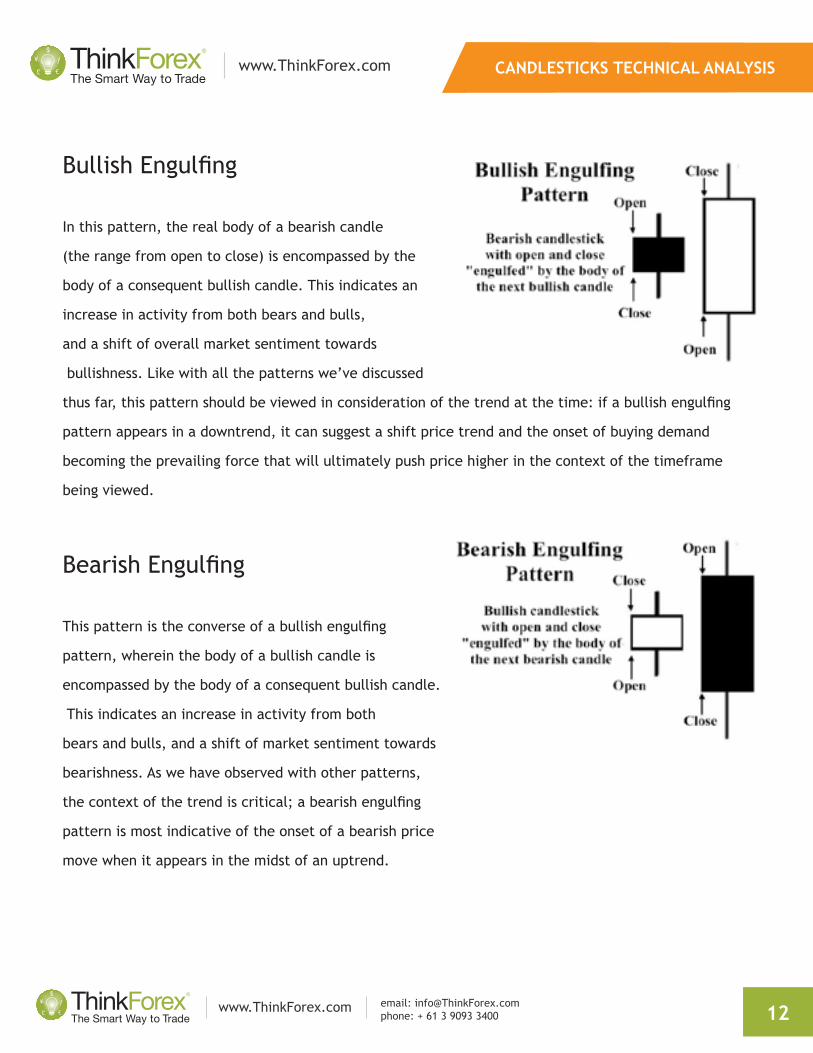
Bullish Engulfing
In this pattern, the real body of a bearish candle
(the range from open to close) is encompassed by the
body of a consequent bullish candle. This indicates an
increase in activity from both bears and bulls,
and a shift of overall market sentiment towards
bullishness. Like with all the patterns we’ve discussed
thus far, this pattern should be viewed in consideration of the trend at the time: if a bullish engulfing
pattern appears in a downtrend, it can suggest a shift price trend and the onset of buying demand
becoming the prevailing force that will ultimately push price higher in the context of the timeframe
being viewed.
Bearish Engulfing
This pattern is the converse of a bullish engulfing
pattern, wherein the body of a bullish candle is
encompassed by the body of a consequent bullish candle.
This indicates an increase in activity from both
bears and bulls, and a shift of market sentiment towards
bearishness. As we have observed with other patterns,
the context of the trend is critical; a bearish engulfing
pattern is most indicative of the onset of a bearish price
move when it appears in the midst of an uptrend.
CANDLESTICKS TECHNICAL ANALYSIS
www.ThinkForex.com
www.ThinkForex.com email: [email protected]: + 61 3 9093 3400
www.ThinkForex.com
www.ThinkForex.com email: [email protected]: + 61 3 9093 3400
CANDLESTICKS TECHNICAL ANALYSIS
13
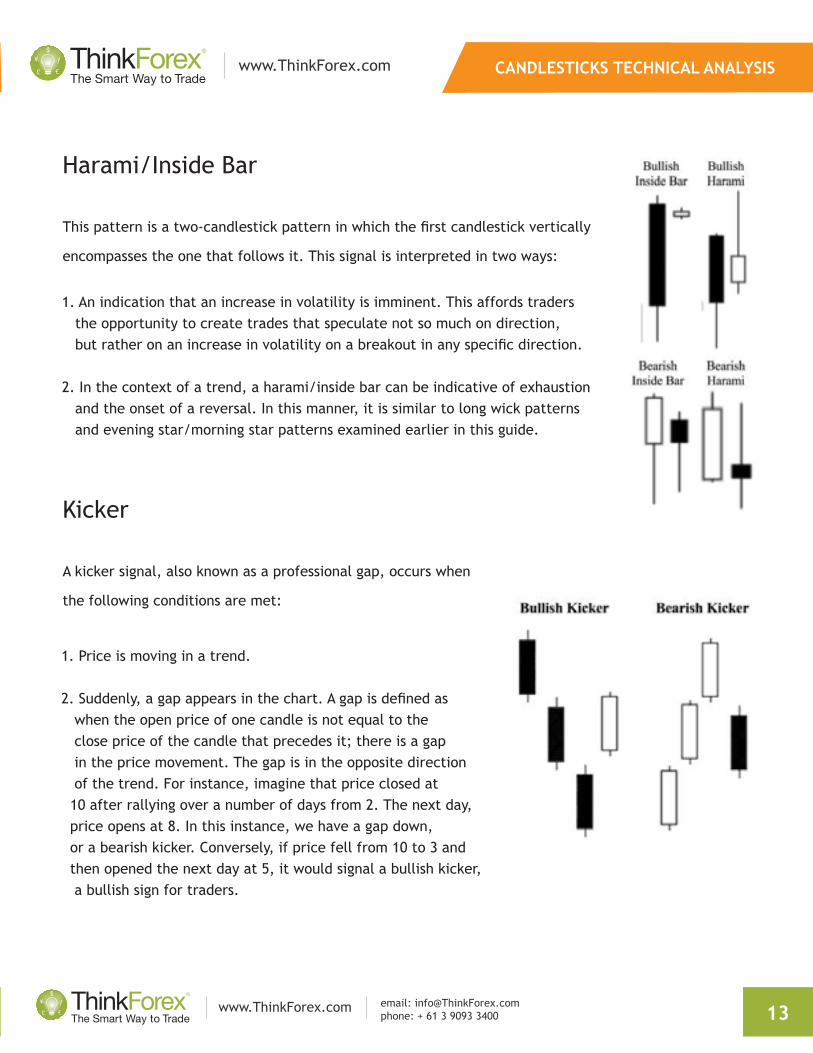
Harami/Inside Bar
This pattern is a two-candlestick pattern in which the first candlestick vertically
encompasses the one that follows it. This signal is interpreted in two ways:
Kicker
A kicker signal, also known as a professional gap, occurs when
the following conditions are met:
1. An indication that an increase in volatility is imminent. This affords traders the opportunity to create trades that speculate not so much on direction, but rather on an increase in volatility on a breakout in any specific direction.
2. In the context of a trend, a harami/inside bar can be indicative of exhaustion and the onset of a reversal. In this manner, it is similar to long wick patterns and evening star/morning star patterns examined earlier in this guide.
1. Price is moving in a trend.
2. Suddenly, a gap appears in the chart. A gap is defined as when the open price of one candle is not equal to the close price of the candle that precedes it; there is a gap in the price movement. The gap is in the opposite direction of the trend. For instance, imagine that price closed at 10 after rallying over a number of days from 2. The next day, price opens at 8. In this instance, we have a gap down, or a bearish kicker. Conversely, if price fell from 10 to 3 and then opened the next day at 5, it would signal a bullish kicker, a bullish sign for traders.
www.ThinkForex.com
www.ThinkForex.com email: [email protected]: + 61 3 9093 3400
www.ThinkForex.com
www.ThinkForex.com email: [email protected]: + 61 3 9093 3400
CANDLESTICKS TECHNICAL ANALYSIS
14
A kicker signal can be a very powerful sign that a trend is reversing. It is often interpreted as a sign that
professional investors have quickly realized that a trend is over, and are looking to get out immediately.
As such, this signal often precipitates a rapid reversal of the prior trend.
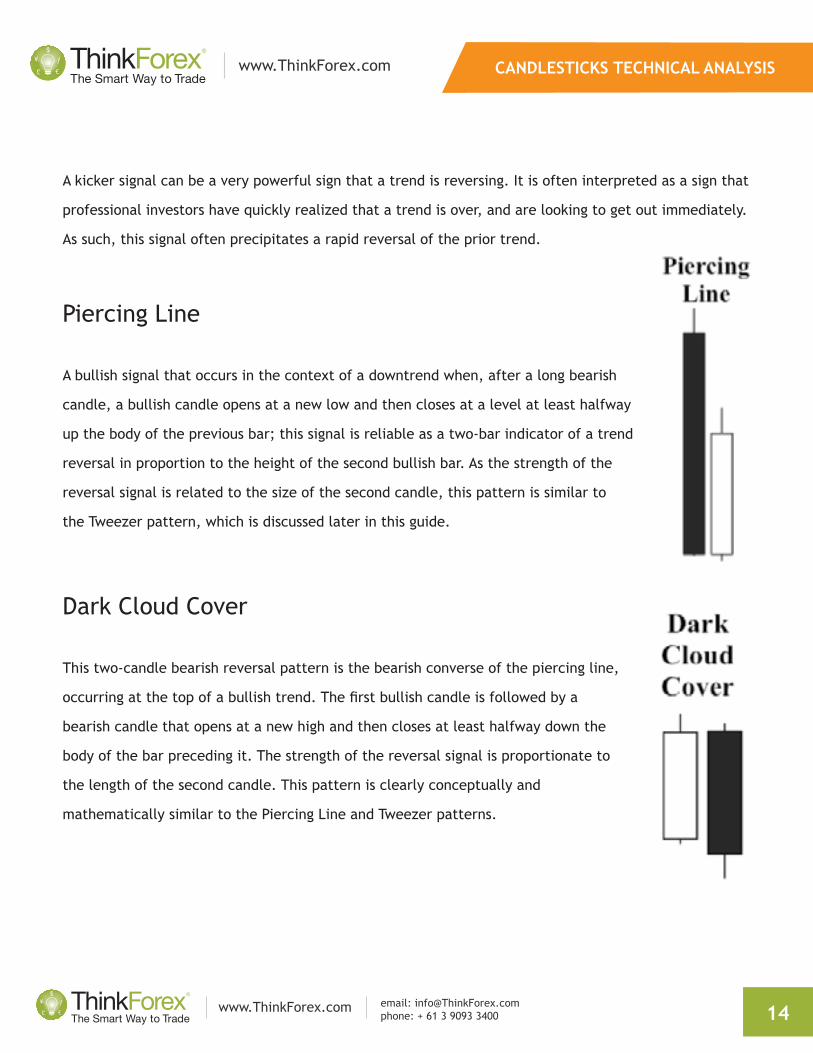
Piercing Line
A bullish signal that occurs in the context of a downtrend when, after a long bearish
candle, a bullish candle opens at a new low and then closes at a level at least halfway
up the body of the previous bar; this signal is reliable as a two-bar indicator of a trend
reversal in proportion to the height of the second bullish bar. As the strength of the
reversal signal is related to the size of the second candle, this pattern is similar to
the Tweezer pattern, which is discussed later in this guide.
Dark Cloud Cover
This two-candle bearish reversal pattern is the bearish converse of the piercing line,
occurring at the top of a bullish trend. The first bullish candle is followed by a
bearish candle that opens at a new high and then closes at least halfway down the
body of the bar preceding it. The strength of the reversal signal is proportionate to
the length of the second candle. This pattern is clearly conceptually and
mathematically similar to the Piercing Line and Tweezer patterns.
CANDLESTICKS TECHNICAL ANALYSIS
www.ThinkForex.com
www.ThinkForex.com email: [email protected]: + 61 3 9093 3400
www.ThinkForex.com
www.ThinkForex.com email: [email protected]: + 61 3 9093 3400
CANDLESTICKS TECHNICAL ANALYSIS
15
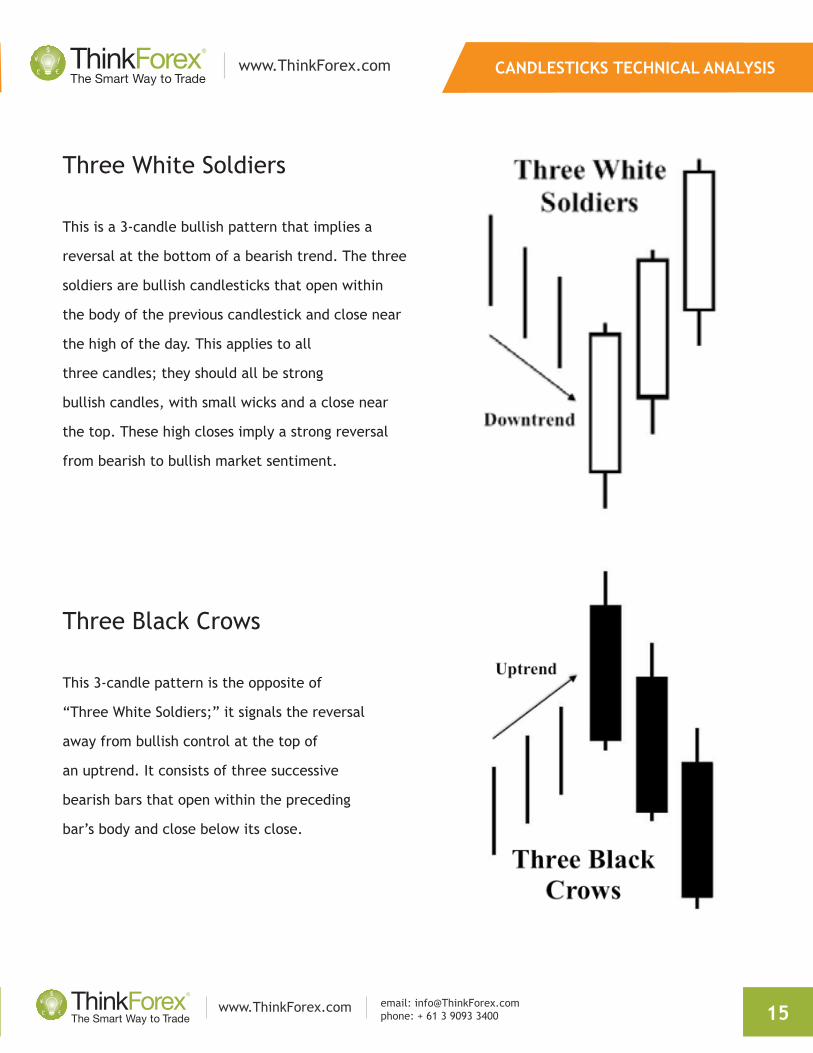
Three White Soldiers
This is a 3-candle bullish pattern that implies a
reversal at the bottom of a bearish trend. The three
soldiers are bullish candlesticks that open within
the body of the previous candlestick and close near
the high of the day. This applies to all
three candles; they should all be strong
bullish candles, with small wicks and a close near
the top. These high closes imply a strong reversal
from bearish to bullish market sentiment.
Three Black Crows
This 3-candle pattern is the opposite of
“Three White Soldiers;” it signals the reversal
away from bullish control at the top of
an uptrend. It consists of three successive
bearish bars that open within the preceding
bar’s body and close below its close.
www.ThinkForex.com
www.ThinkForex.com email: [email protected]: + 61 3 9093 3400
www.ThinkForex.com
www.ThinkForex.com email: [email protected]: + 61 3 9093 3400
CANDLESTICKS TECHNICAL ANALYSIS
16
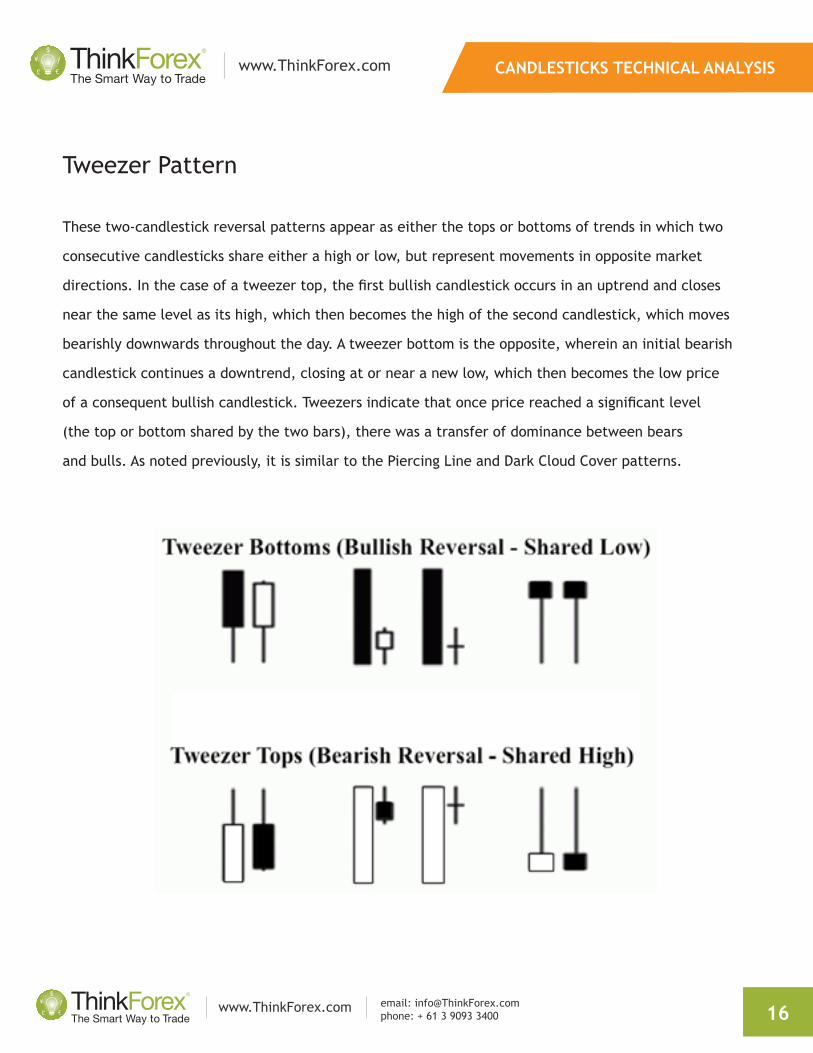
Tweezer Pattern
These two-candlestick reversal patterns appear as either the tops or bottoms of trends in which two
consecutive candlesticks share either a high or low, but represent movements in opposite market
directions. In the case of a tweezer top, the first bullish candlestick occurs in an uptrend and closes
near the same level as its high, which then becomes the high of the second candlestick, which moves
bearishly downwards throughout the day. A tweezer bottom is the opposite, wherein an initial bearish
candlestick continues a downtrend, closing at or near a new low, which then becomes the low price
of a consequent bullish candlestick. Tweezers indicate that once price reached a significant level
(the top or bottom shared by the two bars), there was a transfer of dominance between bears
and bulls. As noted previously, it is similar to the Piercing Line and Dark Cloud Cover patterns.
CANDLESTICKS TECHNICAL ANALYSIS
www.ThinkForex.com
www.ThinkForex.com email: [email protected]: + 61 3 9093 3400
www.ThinkForex.com
www.ThinkForex.com email: [email protected]: + 61 3 9093 3400
CANDLESTICKS TECHNICAL ANALYSIS
17
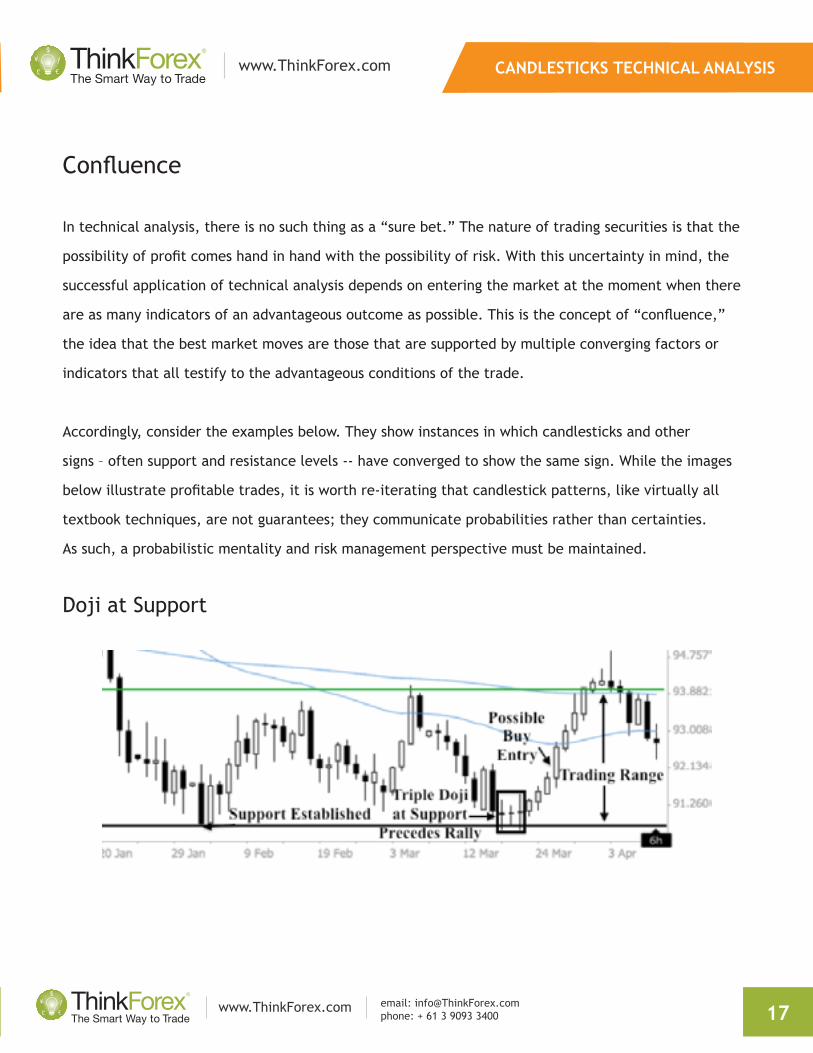
Confluence
In technical analysis, there is no such thing as a “sure bet.” The nature of trading securities is that the
possibility of profit comes hand in hand with the possibility of risk. With this uncertainty in mind, the
successful application of technical analysis depends on entering the market at the moment when there
are as many indicators of an advantageous outcome as possible. This is the concept of “confluence,”
the idea that the best market moves are those that are supported by multiple converging factors or
indicators that all testify to the advantageous conditions of the trade.
Accordingly, consider the examples below. They show instances in which candlesticks and other
signs – often support and resistance levels -- have converged to show the same sign. While the images
below illustrate profitable trades, it is worth re-iterating that candlestick patterns, like virtually all
textbook techniques, are not guarantees; they communicate probabilities rather than certainties.
As such, a probabilistic mentality and risk management perspective must be maintained.
Doji at Support
www.ThinkForex.com
www.ThinkForex.com email: [email protected]: + 61 3 9093 3400
www.ThinkForex.com
www.ThinkForex.com email: [email protected]: + 61 3 9093 3400
CANDLESTICKS TECHNICAL ANALYSIS
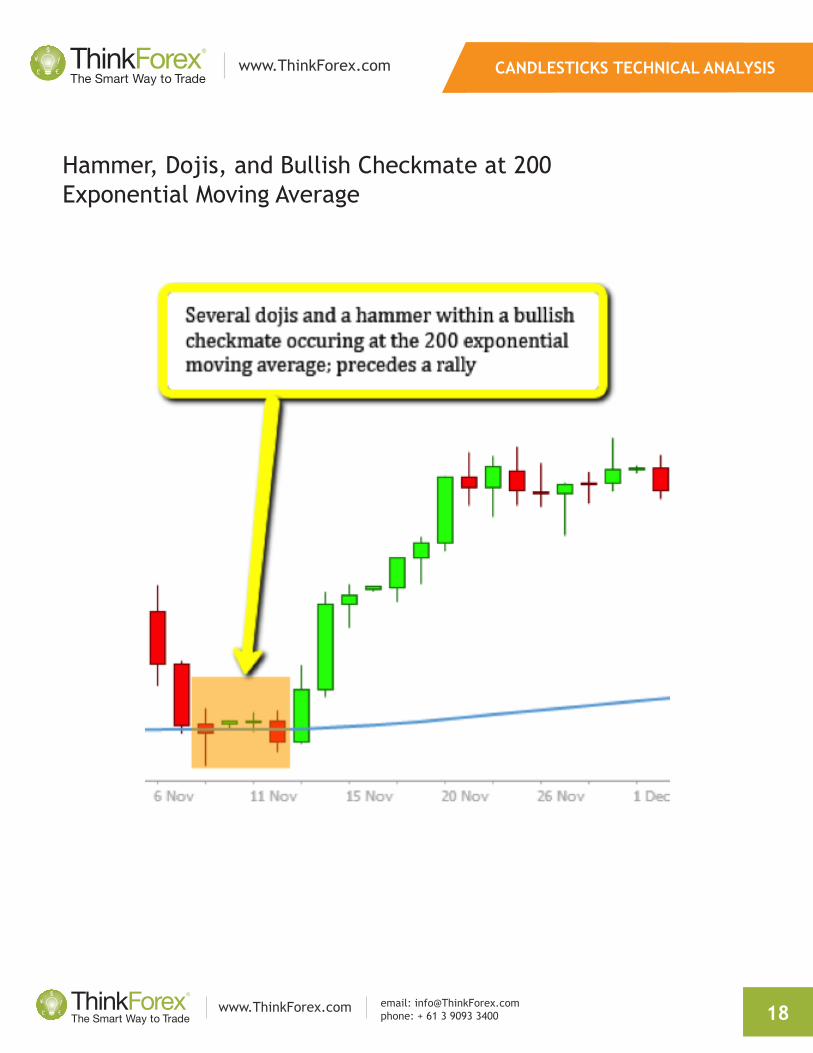
18
Hammer, Dojis, and Bullish Checkmate at 200 Exponential Moving Average

CANDLESTICKS TECHNICAL ANALYSIS
www.ThinkForex.com
www.ThinkForex.com email: [email protected]: + 61 3 9093 3400
www.ThinkForex.com
www.ThinkForex.com email: [email protected]: + 61 3 9093 3400
CANDLESTICKS TECHNICAL ANALYSIS
19
EDUCATE YOUR TRADING
Thank you for reading this introduction to Price Action trading! Hopefully it has piqued your interest
in this methodology. Now you’re ready to discover how this and other technical analysis methods can
be put to use for your own account. You can continue learning about Forex trading with the educational
resources available from ThinkForex, including guides like this one and technical analysis videos
and seminars from professional traders.
Get Technical AnalysisUpdates Today!
Subscribe forWeekly Webinars!
OPEN DEMO ACCOUNTOPEN LIVE ACCOUNT


![arXiv:1901.05237v2 [cs.CE] 1 Jun 2020patterns capture information on the candles. According to Thomas Bulkowski’s Encyclopedia of Candlestick Charts, there are 103 candlestick patterns](https://img.pdfslide.us/doc/110x75/60bffa7c3f13a13fce0dba97/arxiv190105237v2-csce-1-jun-2020-patterns-capture-information-on-the-candles.jpg)