Embed Size (px)
Citation preview
Introduction to Budget Lines and
Production Possibilities Curves
Introduction
Introduction
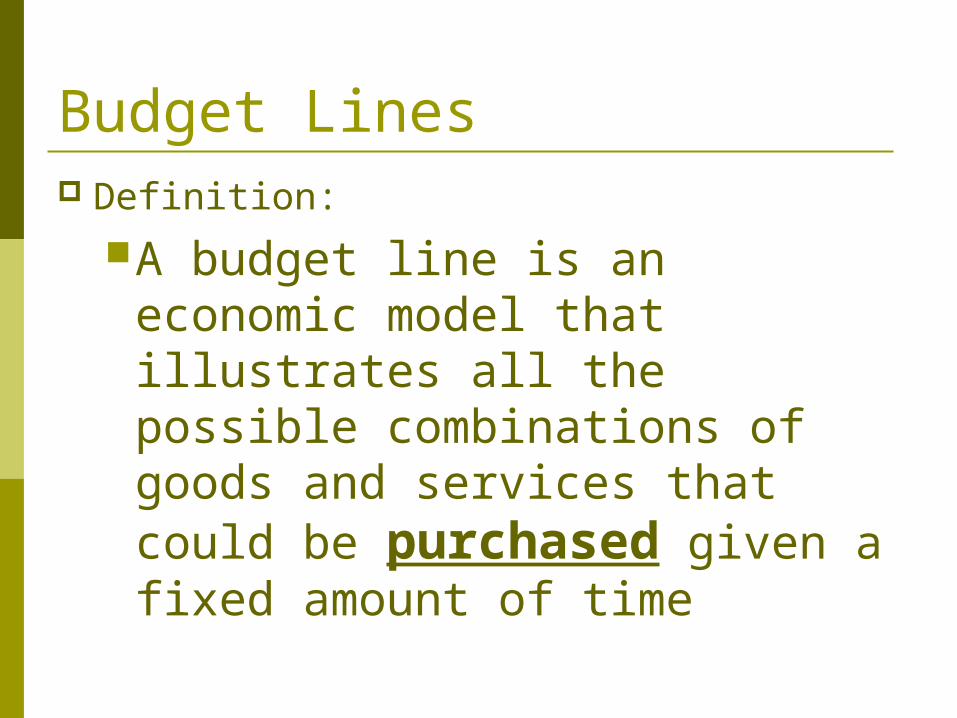
Budget Lines Definition:
A budget line is an economic model that illustrates all the possible combinations of goods and services that could be purchased given a fixed amount of time
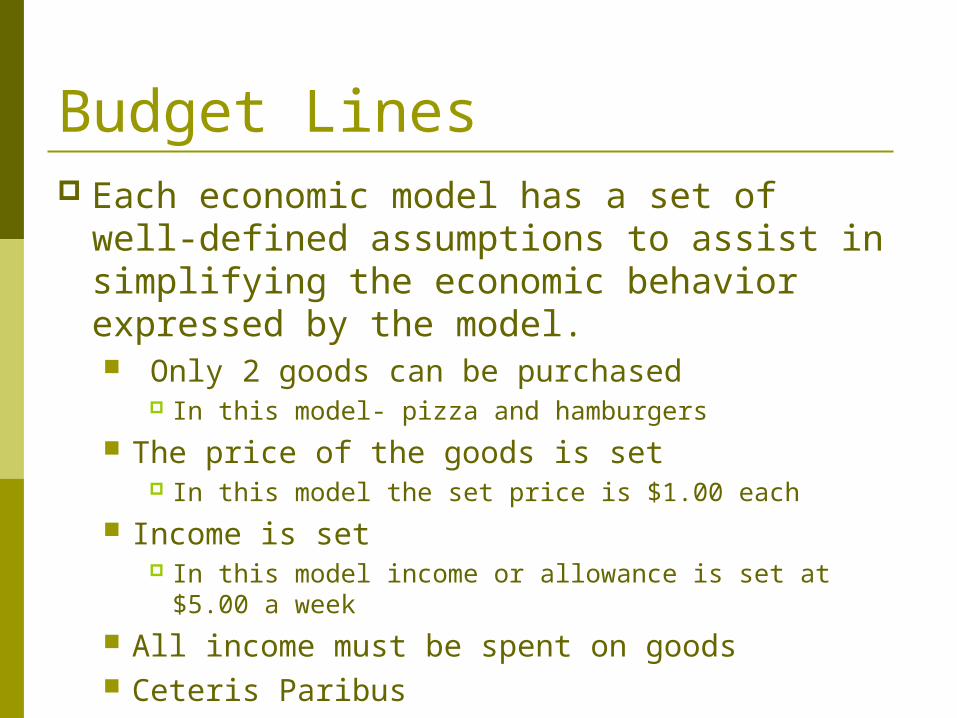
Budget Lines Each economic model has a set of well-
defined assumptions to assist in simplifying the economic behavior expressed by the model. Only 2 goods can be purchased
In this model- pizza and hamburgers The price of the goods is set
In this model the set price is $1.00 each Income is set
In this model income or allowance is set at $5.00 a week
All income must be spent on goods Ceteris Paribus
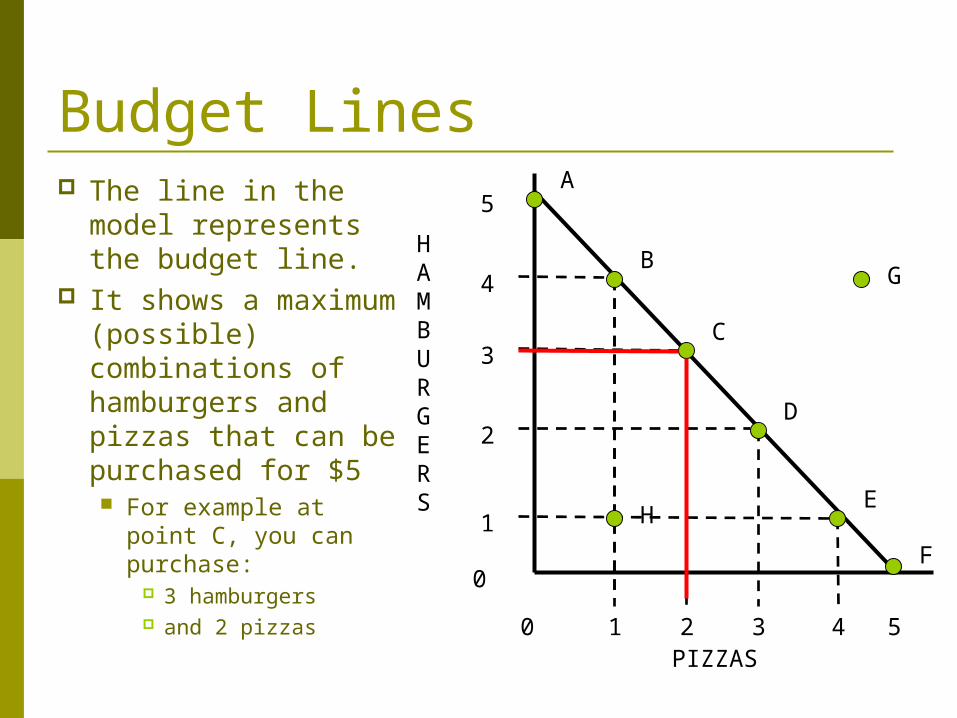
Budget Lines The line in the
model represents the budget line.
It shows a maximum (possible) combinations of hamburgers and pizzas that can be purchased for $5 For example at point
C, you can purchase: 3 hamburgers and 2 pizzas
4
5
5
3
2
1
4321
0
0
A
B
C
D
E
F
H
GHAMBURGERS
PIZZAS
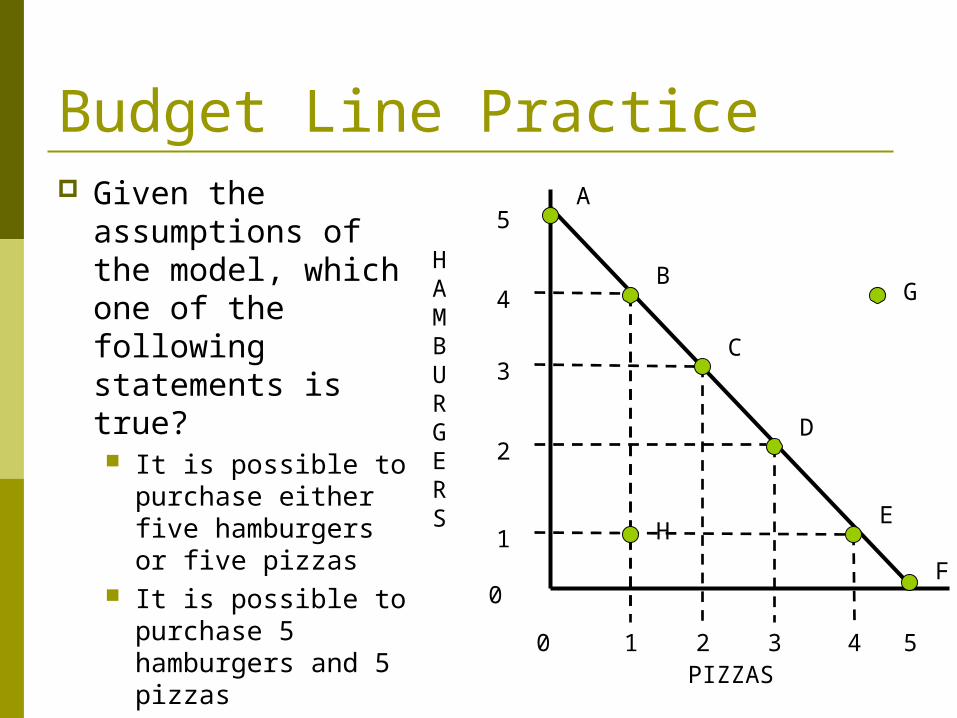
Budget Line Practice Given the
assumptions of the model, which one of the following statements is true? It is possible to
purchase either five hamburgers or five pizzas
It is possible to purchase 5 hamburgers and 5 pizzas
4
5
5
3
2
1
4321
0
0
A
B
C
D
E
F
H
GHAMBURGERS
PIZZAS
Budget Line Practice
4
5
5
3
2
1
4321
0
0
A
B
C
D
E
F
H
GHAMBURGERS
PIZZAS
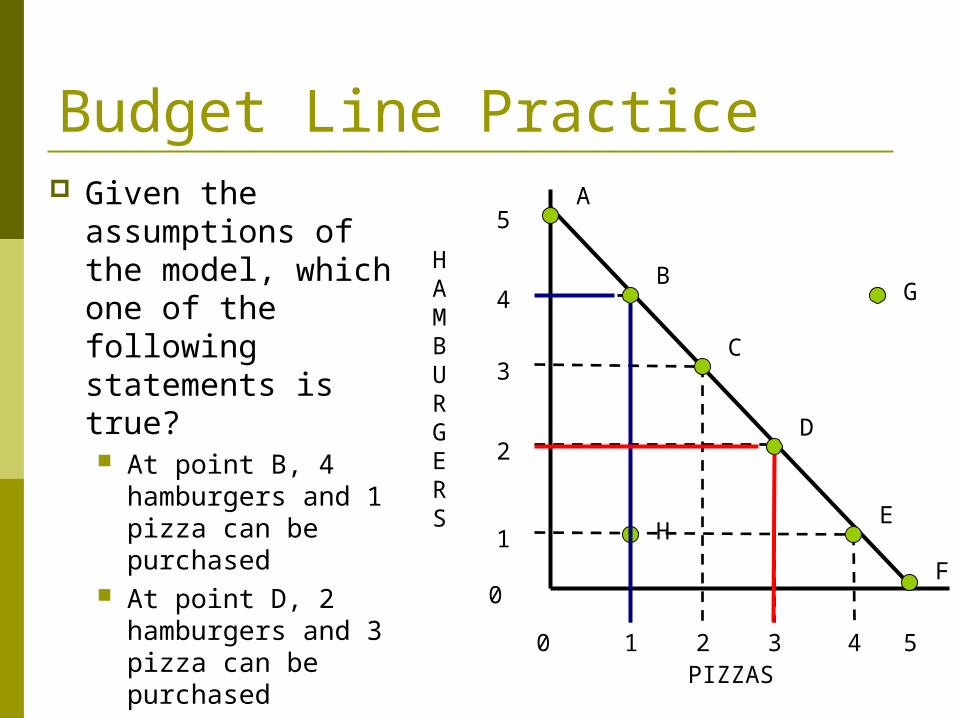
Given the assumptions of the model, which one of the following statements is true? At point B, 4
hamburgers and 1 pizza can be purchased
At point D, 2 hamburgers and 3 pizza can be purchased
All of the above
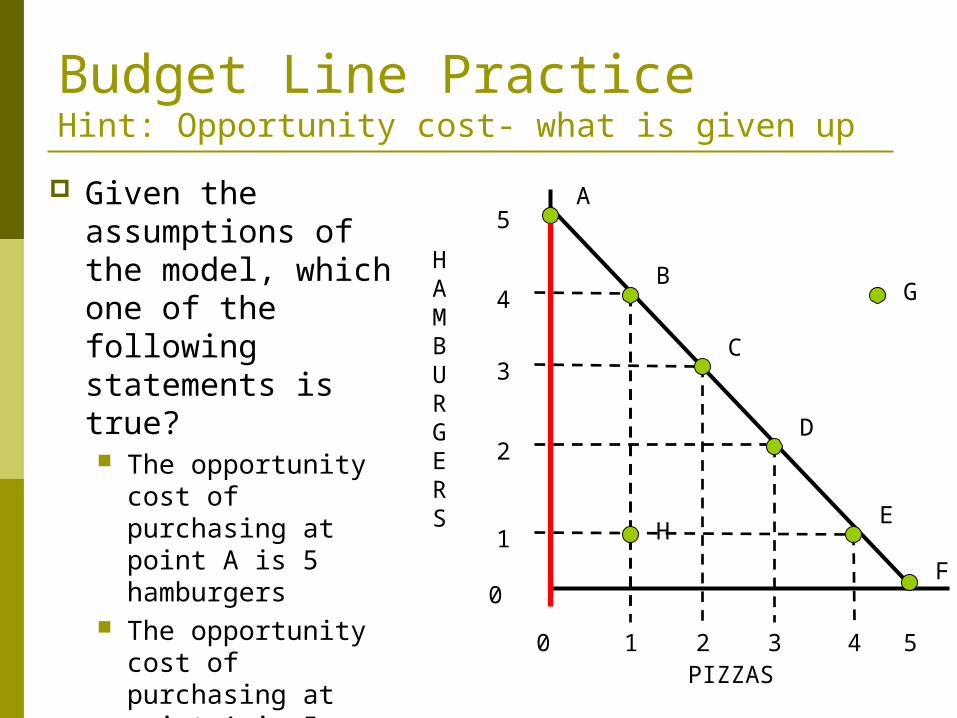
Budget Line PracticeHint: Opportunity cost- what is given up
Given the assumptions of the model, which one of the following statements is true? The opportunity cost
of purchasing at point A is 5 hamburgers
The opportunity cost of purchasing at point A is 5 Pizzas
There is no opportunity cost for purchasing at point A
4
5
5
3
2
1
4321
0
0
A
B
C
D
E
F
H
GHAMBURGERS
PIZZAS
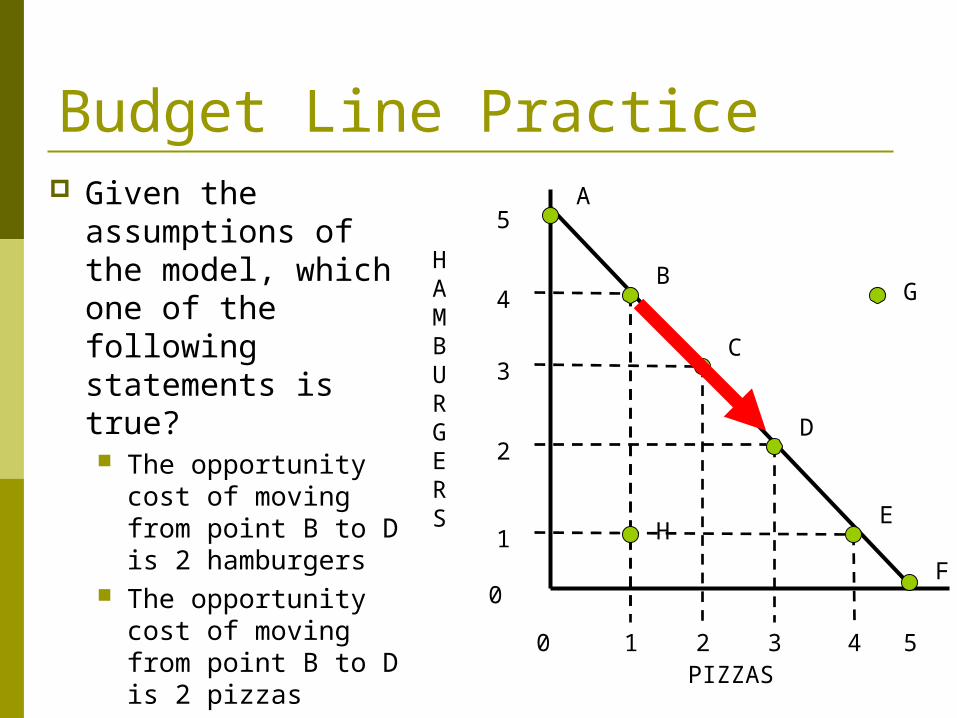
Budget Line Practice Given the
assumptions of the model, which one of the following statements is true? The opportunity cost
of moving from point B to D is 2 hamburgers
The opportunity cost of moving from point B to D is 2 pizzas
There is no opportunity cost of moving from B to D
4
5
5
3
2
1
4321
0
0
A
B
C
D
E
F
H
GHAMBURGERS
PIZZAS
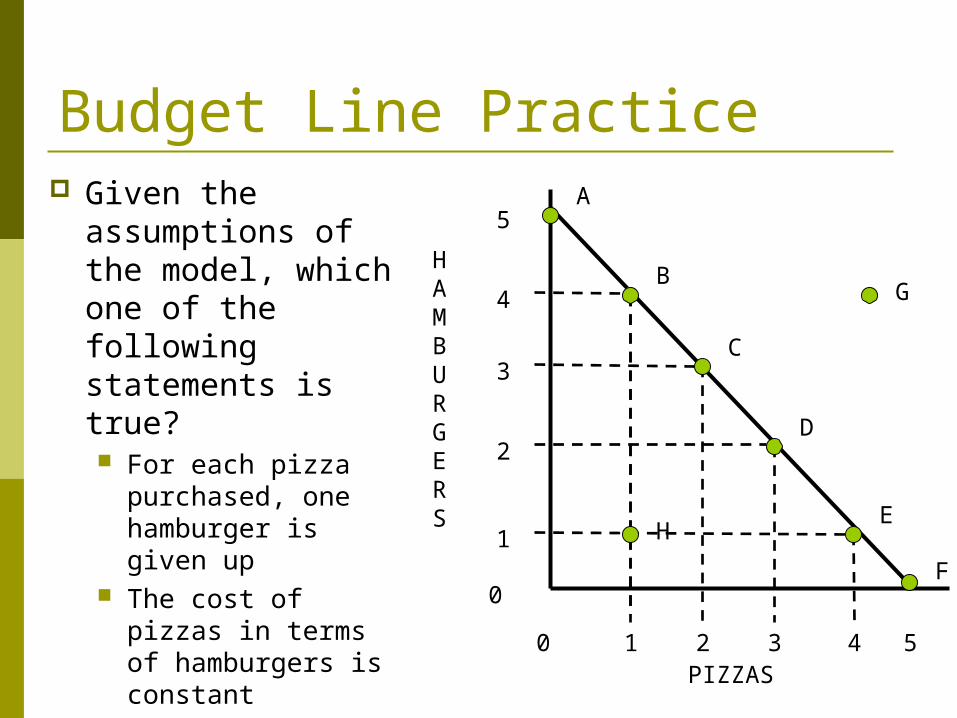
Budget Line Practice Given the
assumptions of the model, which one of the following statements is true? For each pizza
purchased, one hamburger is given up
The cost of pizzas in terms of hamburgers is constant
All of the above are true
HAMBURGERS
4
5
5
3
2
1
4321
0
0
A
B
C
D
E
F
H
G
PIZZAS
Budget Line Practice
F
4
5
5
3
2
1
4321
0
0
A
B
C
D
EH
GHAMBURGERS
PIZZAS
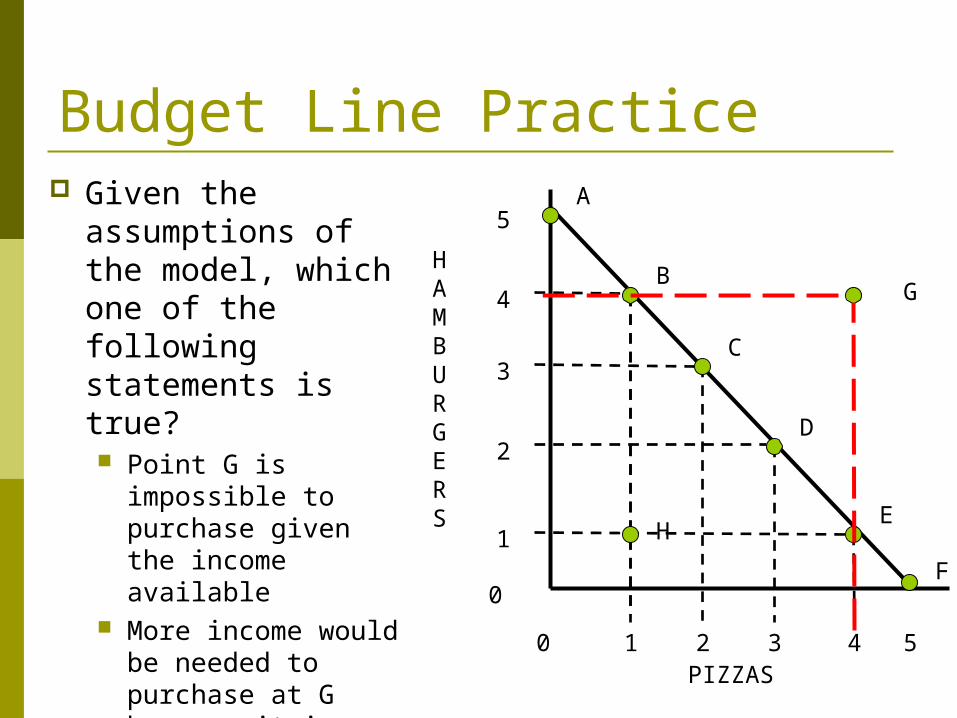
Given the assumptions of the model, which one of the following statements is true? Point G is impossible
to purchase given the income available
More income would be needed to purchase at G because it is outside of the budget line
All of the above are true
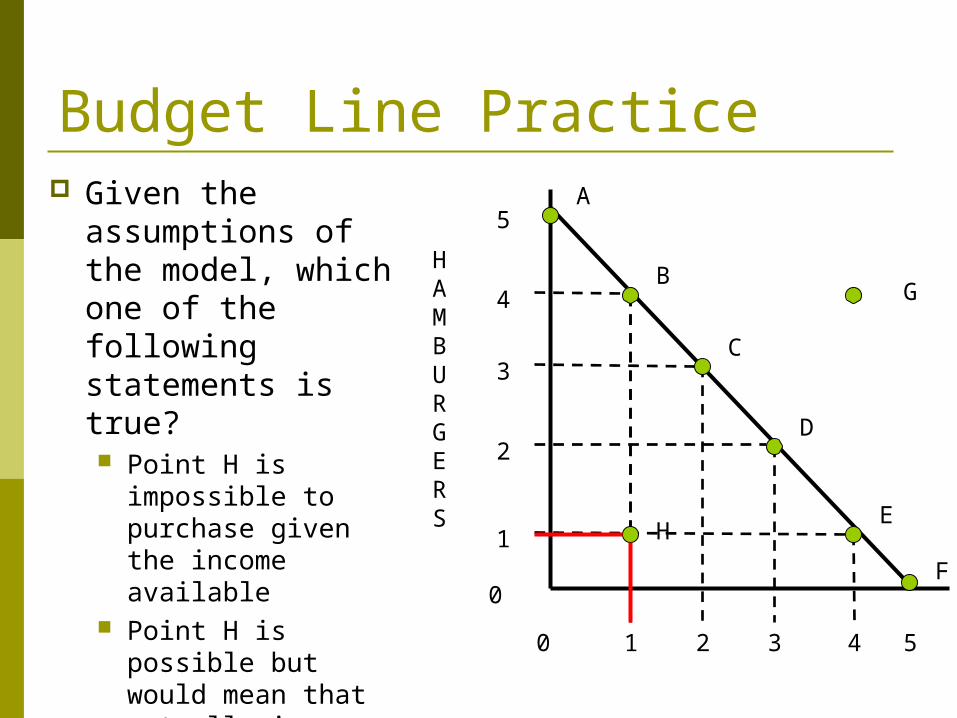
Budget Line Practice Given the
assumptions of the model, which one of the following statements is true? Point H is impossible
to purchase given the income available
Point H is possible but would mean that not all given income would be spent
All of the above are true
F
4
5
5
3
2
1
4321
0
0
A
B
C
D
EH
GHAMBURGERS
Production Possibilities Curves Definition:
A production possibilities curve is an economic model that illustrates all the possible combinations of output that could be produced by an economy given the resources available
Differences? What is the difference between PPC and
Budget Lines? Budget Lines show what can be purchased PPC show what can be produced
Assumptions of PPC Only two products can be produced
In this example guns and butter All resources are fixed
Resources are land, labor, capital and entrepreneurship
All technology is fixed All resources are used fully and efficiently Ceteris paribus
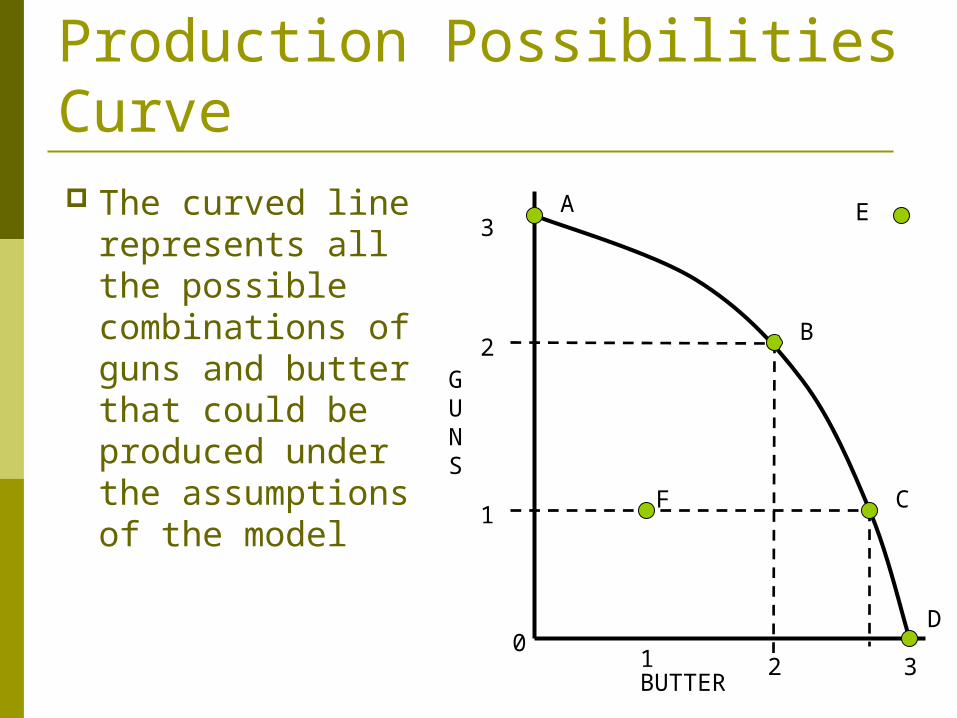
Production Possibilities Curve The curved line
represents all the possible combinations of guns and butter that could be produced under the assumptions of the model
3
2
1
3210
A
B
C
D
E
F
GUNS
BUTTER
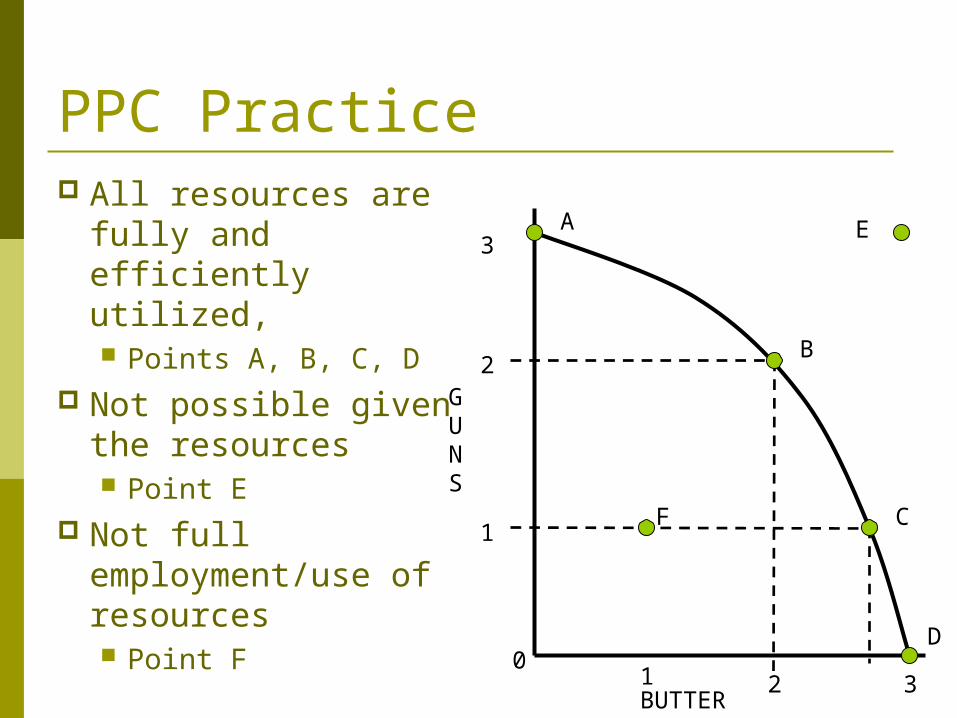
PPC Practice All resources are
fully and efficiently utilized, Points A, B, C, D
Not possible given the resources Point E
Not full employment/use of resources Point F
3
2
1
3210
A
B
C
D
E
F
GUNS
BUTTER
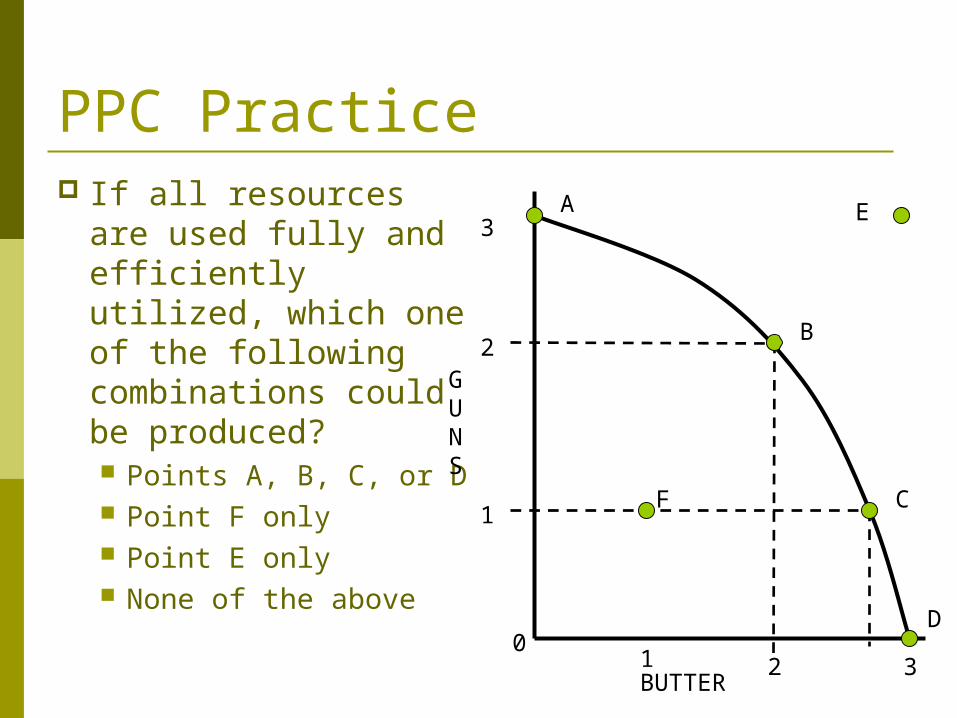
PPC Practice If all resources are
used fully and efficiently utilized, which one of the following combinations could be produced? Points A, B, C, or D Point F only Point E only None of the above
3
2
1
3210
A
B
C
D
E
F
GUNS
BUTTER
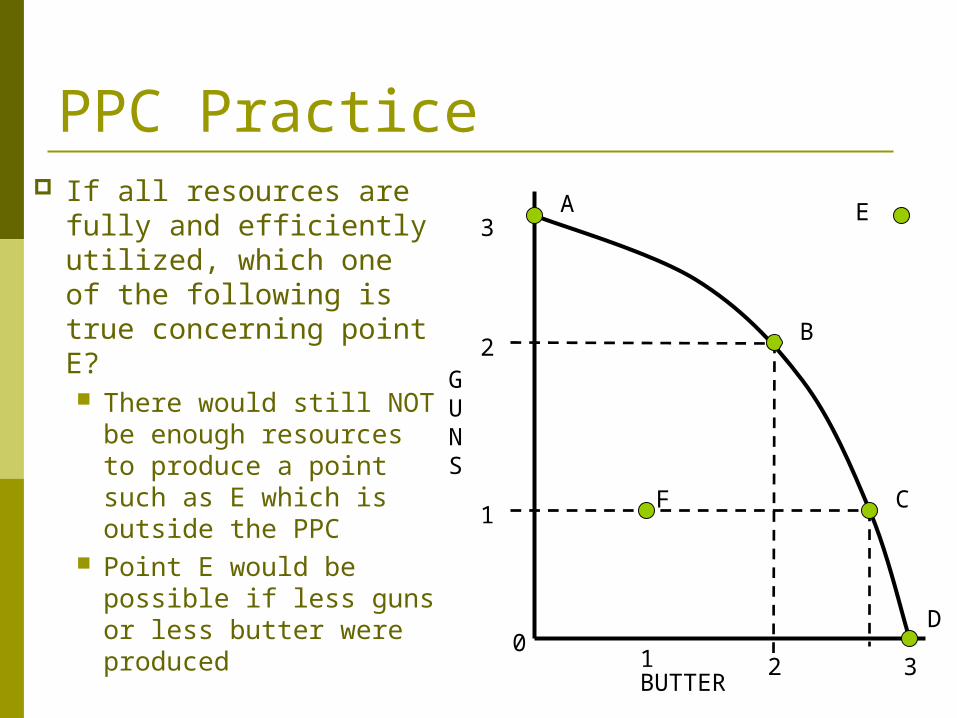
PPC Practice If all resources are
fully and efficiently utilized, which one of the following is true concerning point E? There would still NOT
be enough resources to produce a point such as E which is outside the PPC
Point E would be possible if less guns or less butter were produced
3
2
1
3210
A
B
C
D
E
F
GUNS
BUTTER
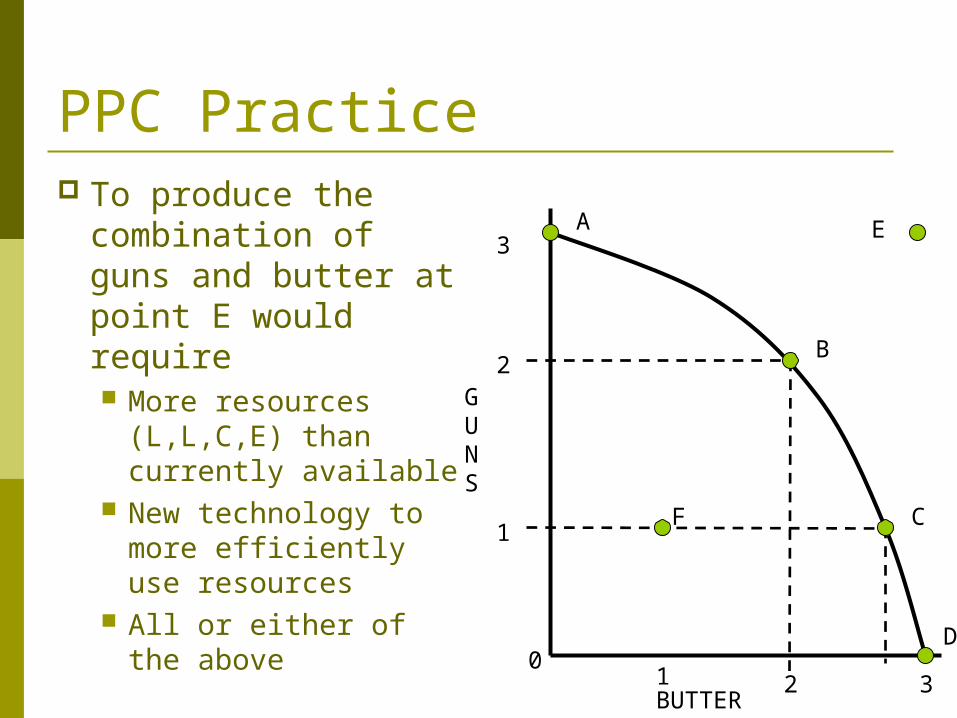
PPC Practice To produce the
combination of guns and butter at point E would require More resources
(L,L,C,E) than currently available
New technology to more efficiently use resources
All or either of the above
3
2
1
3210
A
B
C
D
E
F
GUNS
BUTTER
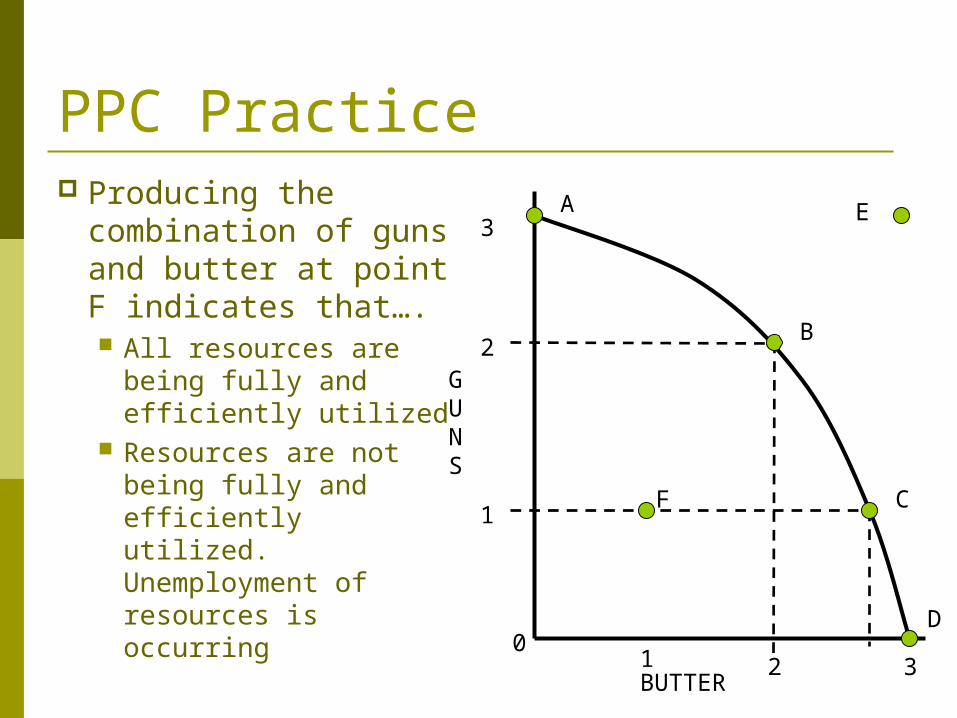
PPC Practice Producing the
combination of guns and butter at point F indicates that…. All resources are
being fully and efficiently utilized
Resources are not being fully and efficiently utilized. Unemployment of resources is occurring
3
2
1
3210
A
B
C
D
E
F
GUNS
BUTTER
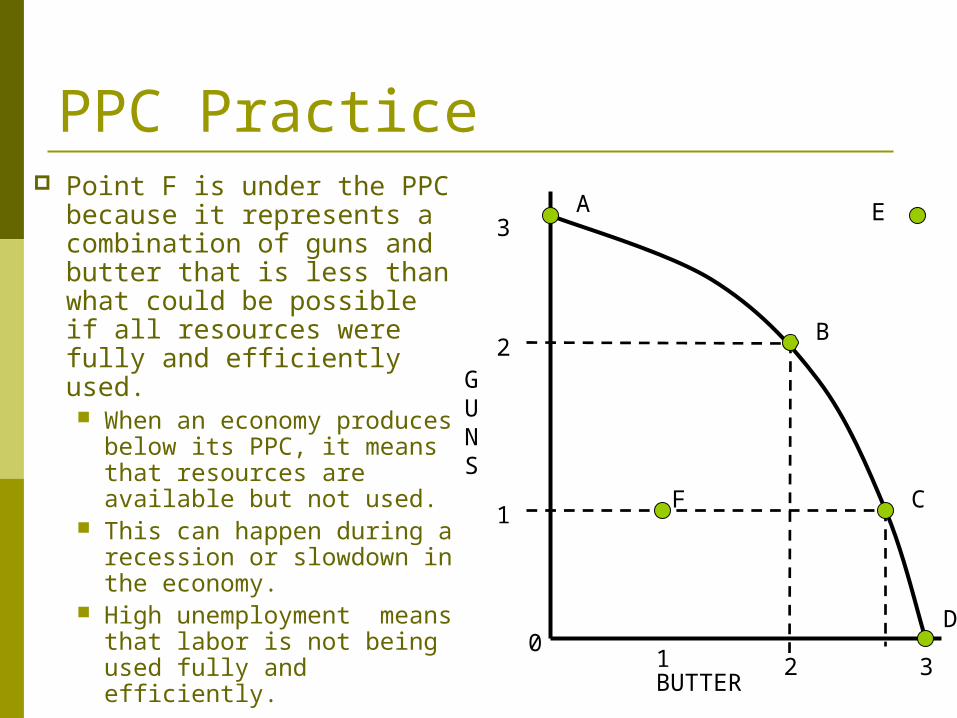
PPC Practice Point F is under the PPC
because it represents a combination of guns and butter that is less than what could be possible if all resources were fully and efficiently used. When an economy
produces below its PPC, it means that resources are available but not used.
This can happen during a recession or slowdown in the economy.
High unemployment means that labor is not being used fully and efficiently.
3
2
1
3210
A
B
C
D
E
F
GUNS
BUTTER
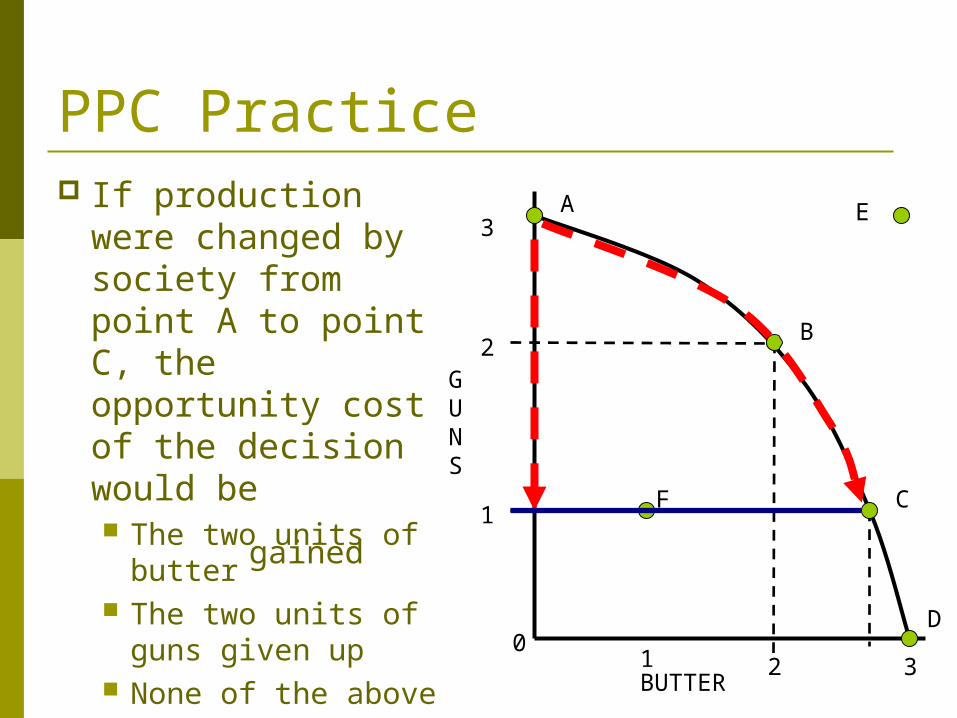
PPC Practice If production were
changed by society from point A to point C, the opportunity cost of the decision would be The two units of
butter The two units of
guns given up None of the above
3
2
1
3210
A
B
C
D
E
F
GUNS
BUTTER
gained
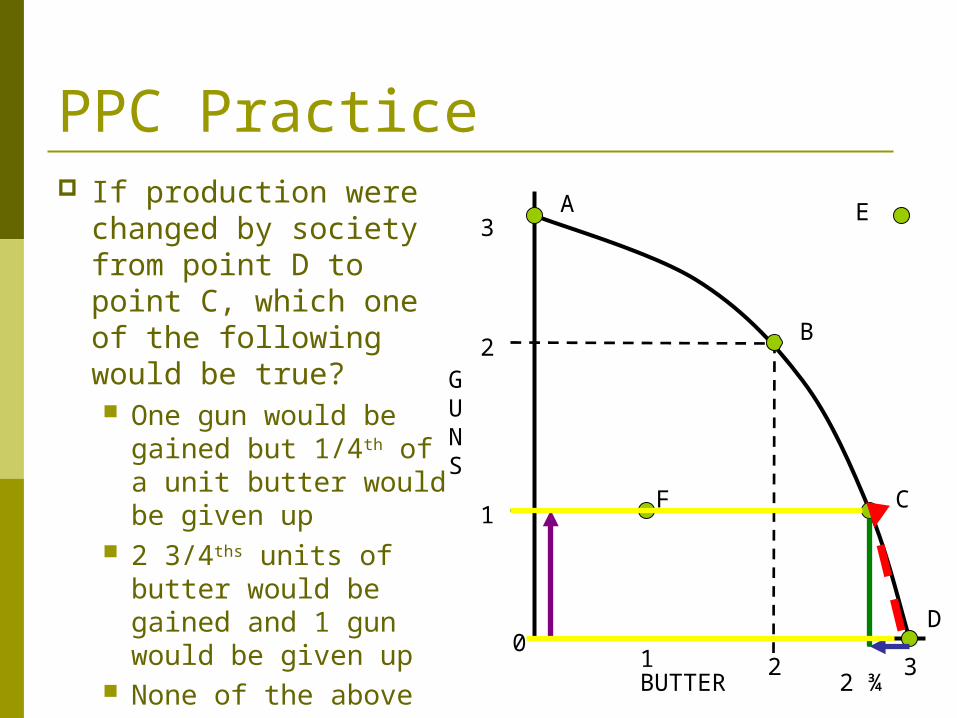
PPC Practice If production were
changed by society from point D to point C, which one of the following would be true? One gun would be
gained but 1/4th of a unit butter would be given up
2 3/4ths units of butter would be gained and 1 gun would be given up
None of the above
3
2
1
3210
A
B
C
D
E
F
GUNS
BUTTER 2 ¾
PPC Practice
3
2
1
3210
A
B
C
D
E
F
GUNS
BUTTER
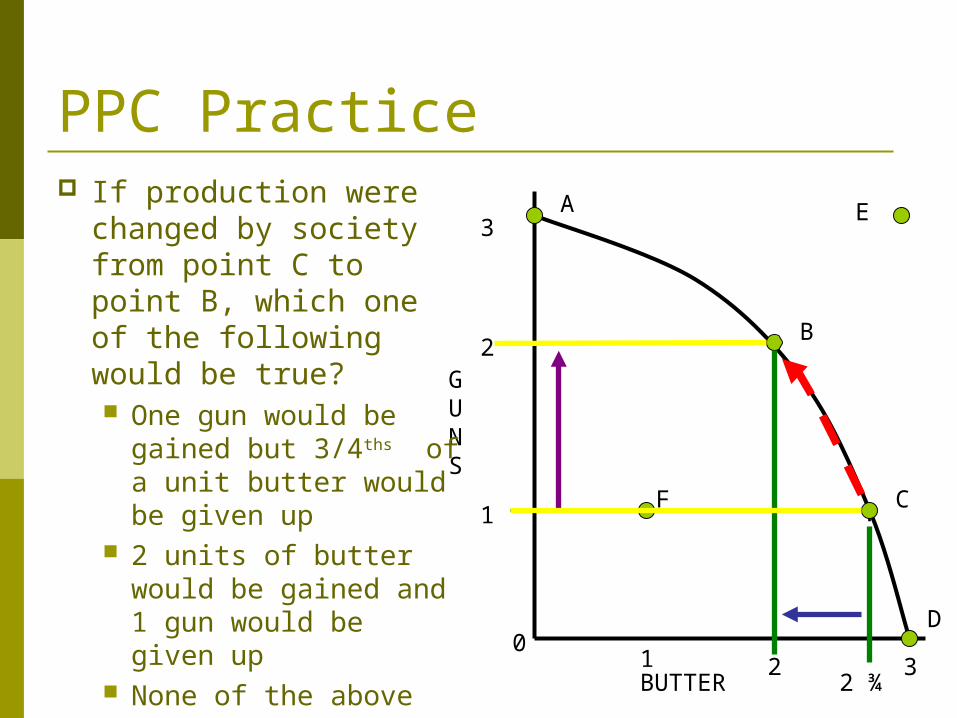
If production were changed by society from point C to point B, which one of the following would be true? One gun would be
gained but 3/4ths of a unit butter would be given up
2 units of butter would be gained and 1 gun would be given up
None of the above 2 ¾
PPC Practice
3
2
1
3210
A
B
C
D
E
F
GUNS
BUTTER
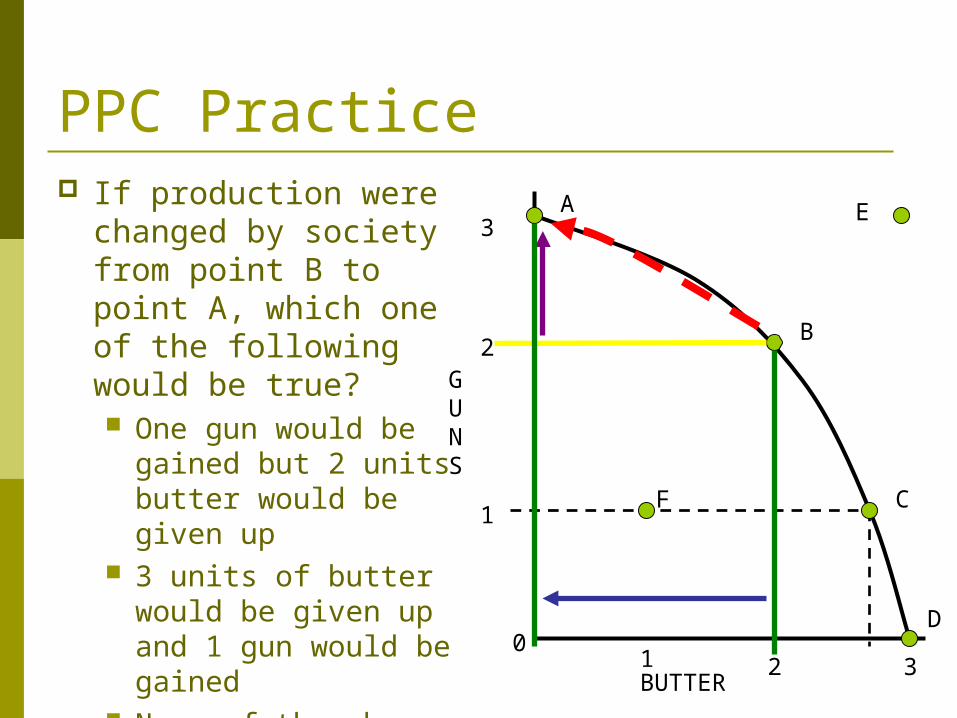
If production were changed by society from point B to point A, which one of the following would be true? One gun would be
gained but 2 units butter would be given up
3 units of butter would be given up and 1 gun would be gained
None of the above
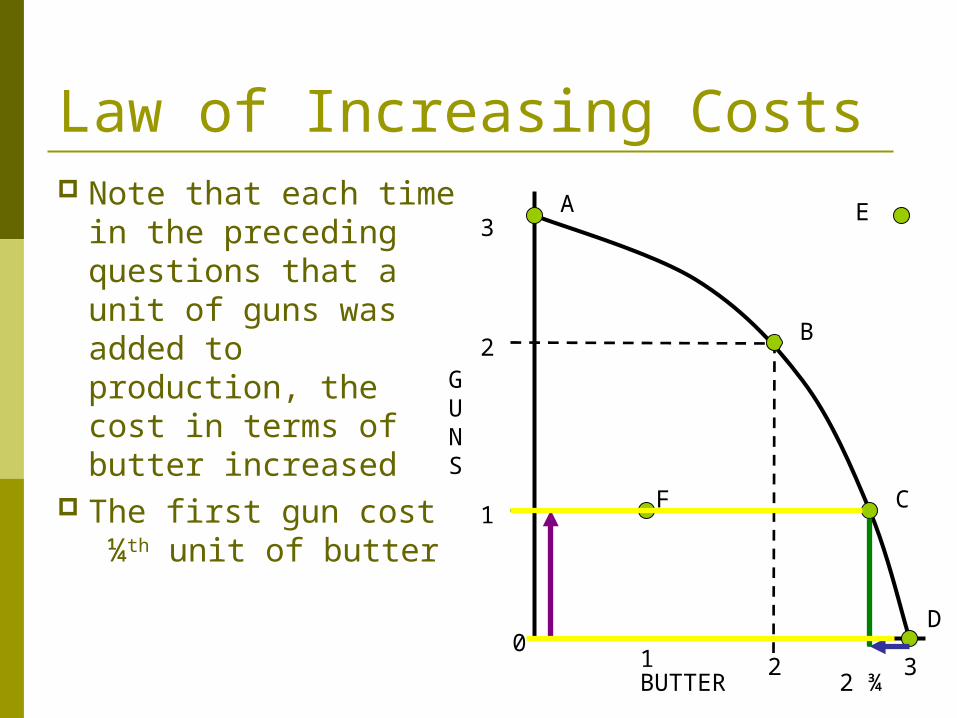
Law of Increasing Costs Note that each time
in the preceding questions that a unit of guns was added to production, the cost in terms of butter increased
The first gun cost ¼th unit of butter
3
2
1
3210
A
B
C
D
E
F
GUNS
BUTTER 2 ¾
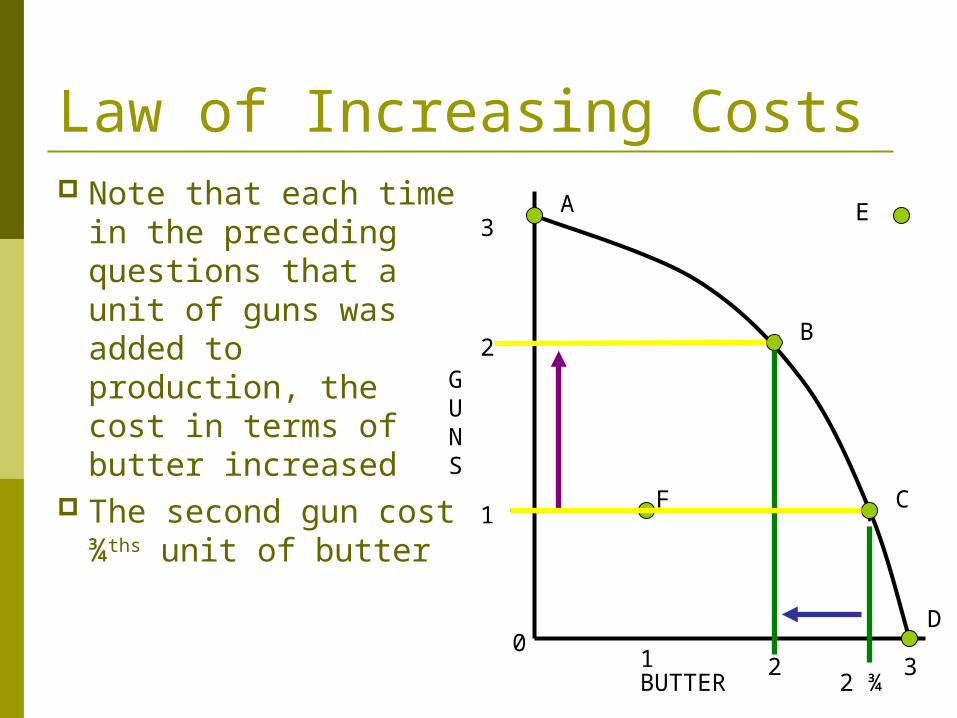
Law of Increasing Costs Note that each time
in the preceding questions that a unit of guns was added to production, the cost in terms of butter increased
The second gun cost ¾ths unit of butter
3
2
1
3210
A
B
C
D
E
F
GUNS
BUTTER 2 ¾
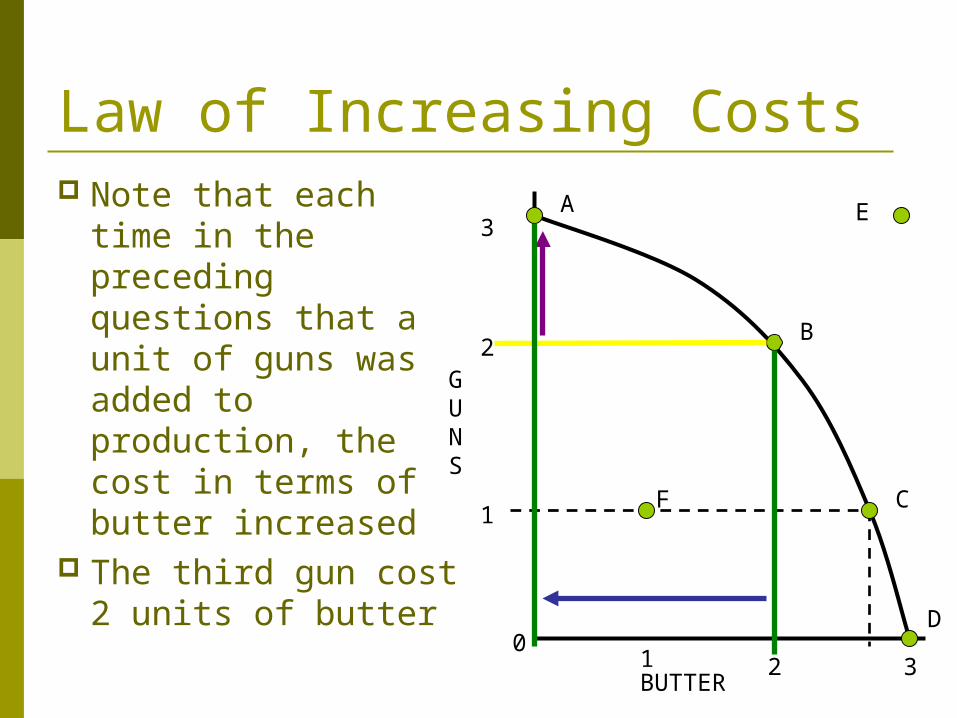
Law of Increasing Costs Note that each time
in the preceding questions that a unit of guns was added to production, the cost in terms of butter increased
The third gun cost 2 units of butter
3
2
1
3210
A
B
C
D
E
F
GUNS
BUTTER
Law of Increasing Costs This is due to the LAW OF INCREASING
COSTS
The law of increasing costs states: As more of a product is produced, each
additional unit has a higher opportunity cost.
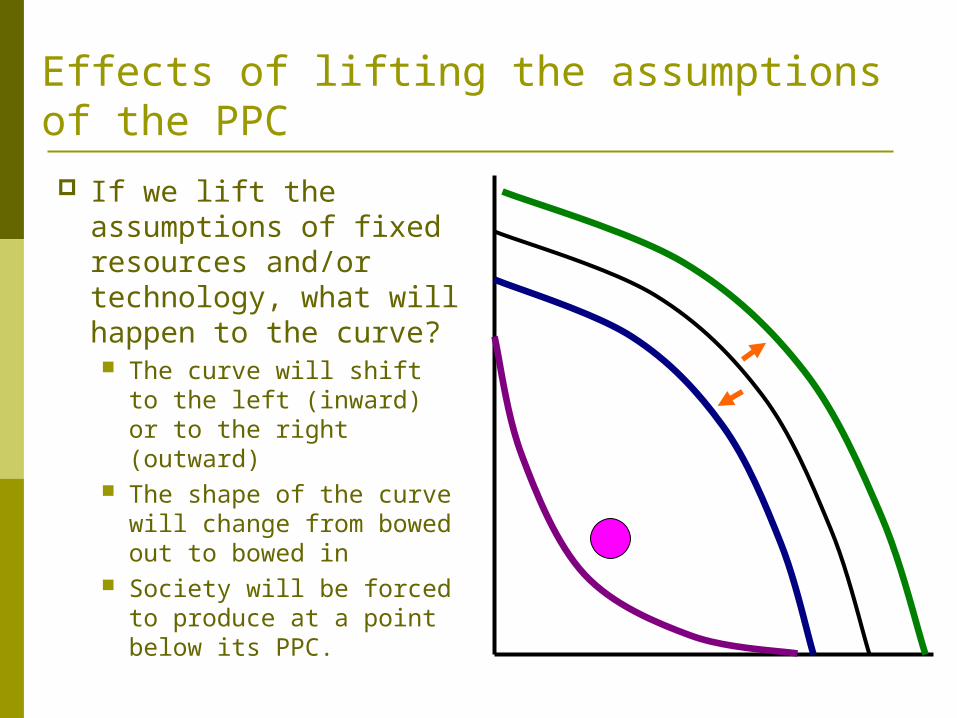
Effects of lifting the assumptions of the PPC
If we lift the assumptions of fixed resources and/or technology, what will happen to the curve? The curve will shift to
the left (inward) or to the right (outward)
The shape of the curve will change from bowed out to bowed in
Society will be forced to produce at a point below its PPC.
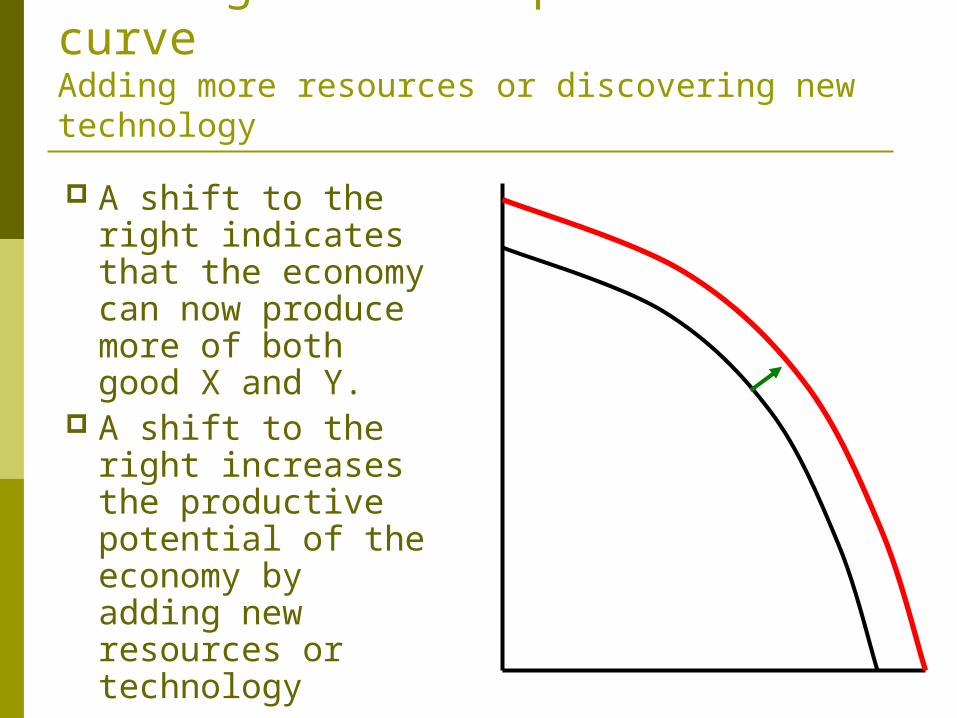
Lifting the assumptions of the curveAdding more resources or discovering new technology
A shift to the right indicates that the economy can now produce more of both good X and Y.
A shift to the right increases the productive potential of the economy by adding new resources or technology
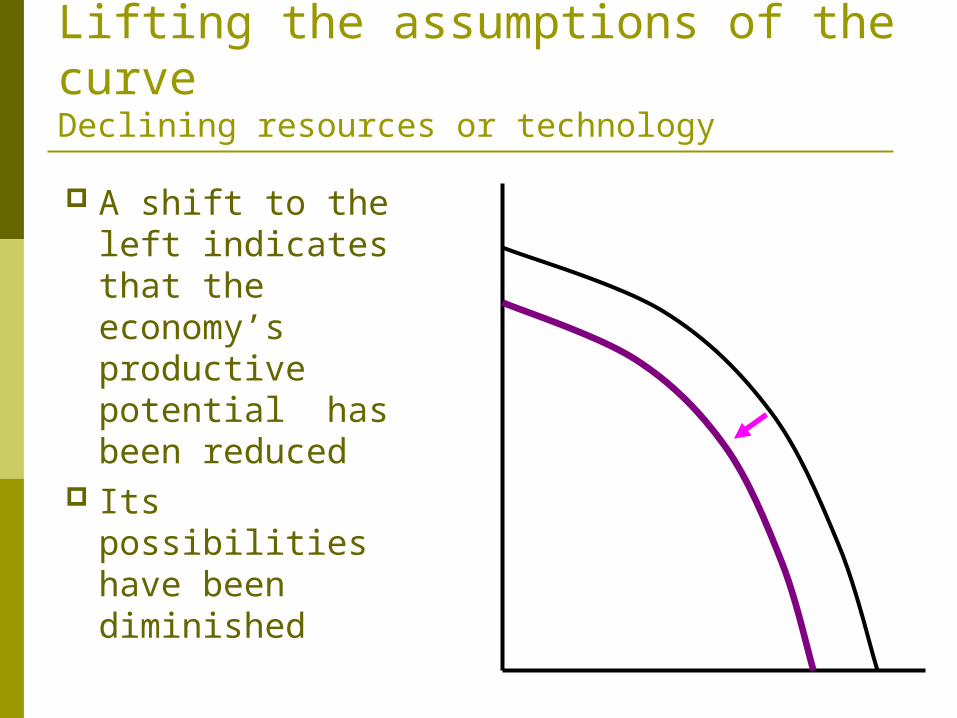
Lifting the assumptions of the curveDeclining resources or technology
A shift to the left indicates that the economy’s productive potential has been reduced
Its possibilities have been diminished
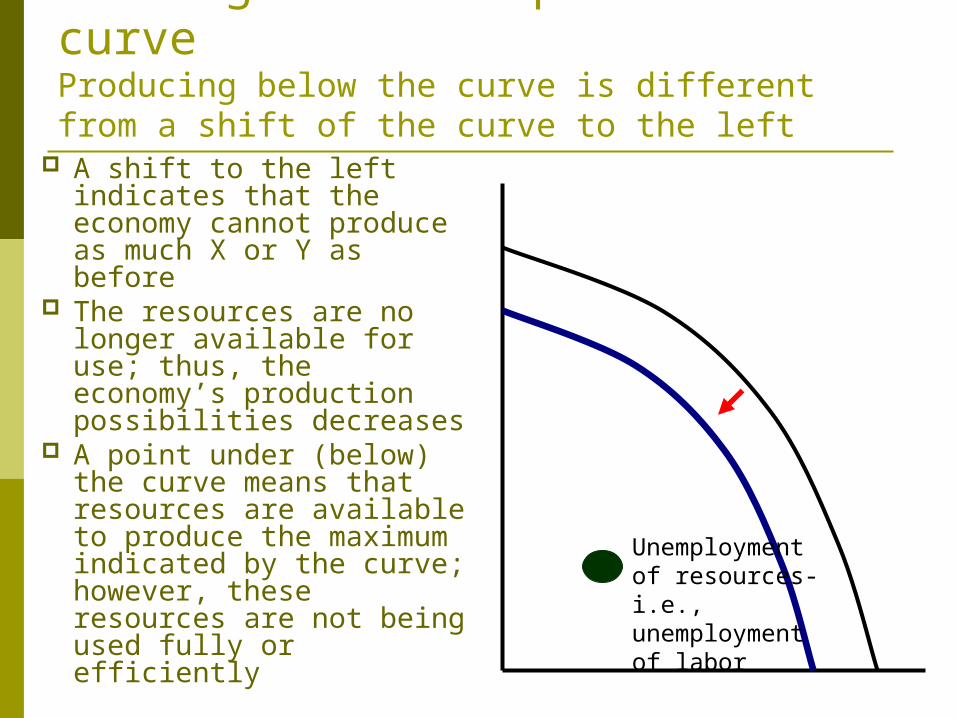
Lifting the assumptions of the curveProducing below the curve is different from a shift of the curve to the left
A shift to the left indicates that the economy cannot produce as much X or Y as before
The resources are no longer available for use; thus, the economy’s production possibilities decreases
A point under (below) the curve means that resources are available to produce the maximum indicated by the curve; however, these resources are not being used fully or efficiently
Unemployment of resources- i.e., unemployment of labor


![Role of Geometric Relaxation in Oxygen Binding to Metal ...theory.cm.utexas.edu/henkelman/pubs/lu11_1237.pdfd curves to quadratic forms [E d(R)=AR2/2] and E a curves to straight lines](https://img.pdfslide.us/doc/110x75/5f11e619dabfa333981c3b47/role-of-geometric-relaxation-in-oxygen-binding-to-metal-d-curves-to-quadratic.jpg)