Embed Size (px)
Citation preview
Introduction to Bioinformatics
Christopher Lee
September 26, 2011

This course is for people who may wantto invent new kinds of bioinformatics
1
Bioinformatics is the study of theinherent structure of biological
information.
There is inherent structure: many kinds of patterns.
• Algorithms that solve the pattern finding problem.
• Statistical metrics that distinguish information from random noise.
2
This class neither assumes nor teachesany biology.
• We only introduce simple models (e.g. binomial) and simple prob-
lems that use those models.
• Focus in this class is on theory and problem solving skills, not
biological applications.
• Jones & Pevzner chapters 1-3 give useful background.
3
This class is online:
http://c260a.bioinformatics.ucla.edu
Videos, texts, handouts etc.
4
Foundations: ConceptualUnderstanding
Solving problems in the real world requires above all
understanding the fundamental concepts and how to
apply them correctly.
But this is easier said than done. First of all, what does
“understanding the concepts” actually mean?
5
What It Isn’t
• memorization: “remembering what the textbook says”
• plug-and-chug: remembering how to do one kind of
calculation, by practicing it over and over.
• solving equations: given a pre-specified set of condi-
tions, solve for the unknown(s).
6
What’s the difference between thinkingyou know the “right answer” vs. really
being able to solve problems in all sortsof situations?
7
Knowing the “right answer” is notenough.
You need to understand why it’s right,or you’ll probably go wrong when you
try to use it.
8
The Importance of Error Models
Truly understanding an idea means knowing which of its
possible variations are not valid, and why they are wrong.
9
To learn the error model, you have tomake the error, and then see for
yourself that the result makes no sense.
10
We can learn even more from ourmistakes than our successes!
11
Learning to the n-th Power
We can learn a lot more by seeing how others solved a
problem, and what mistakes they made.
12
Requirements for Learning
• Make the error, or see someone else make it
• See that it leads to a bad result
• Generalize the principle: what is the error model and
why is it wrong?
• Lather; rinse; repeat.13
In-Class Exercises
• We’ll take time each class to solve conceptual problems;
• Submit answers to online server so we can categorize, share and
discuss answers.
• Our goal is to capture the common mistakes we make, to clear up
confusions for everyone in class.
• Together we’ll filter out error models vs the solution.
14
Reading vs. Lectures
• In the past, the reading and the lectures covered the same mate-
rial.
• If we use class time to work on problems, not as much time can
be given to lecturing on the same material covered in the reading.
• In fact, in order to work on problems in-class, you need to arrive
already familiar with the basic definitions, and ready to try to use
them.
15
Reading Quizzes
• You must do the assigned reading before class!!
• So we will have daily reading quizzes that simply check that you’ve
done the reading. That just means: you know the basic definitions
of terms and concepts.
16
Grading++
• Let’s grade according to last year’s curve...
• ...but even if this year’s class scores higher overall,keep the old grade cutoffs (so more people get As).
• You are not in competition with each other!
• Help each other learn. Everybody wins!
17
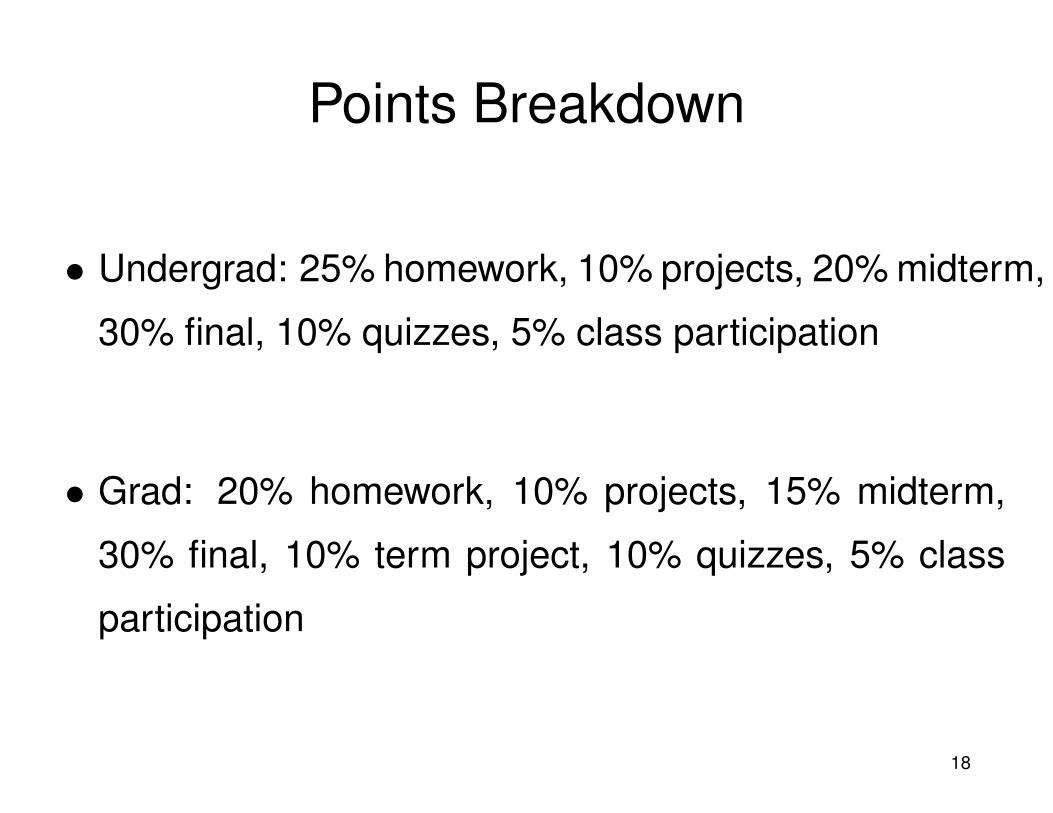
Points Breakdown
• Undergrad: 25% homework, 10% projects, 20% midterm,
30% final, 10% quizzes, 5% class participation
• Grad: 20% homework, 10% projects, 15% midterm,
30% final, 10% term project, 10% quizzes, 5% class
participation
18
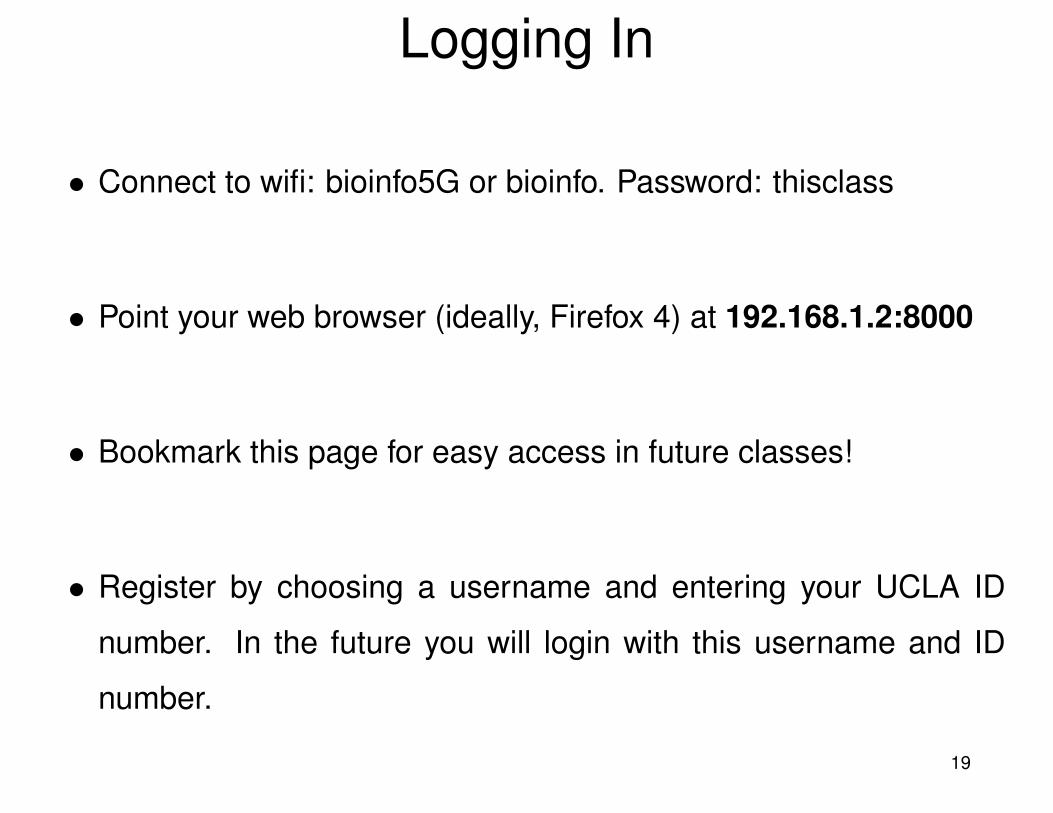
Logging In
• Connect to wifi: bioinfo5G or bioinfo. Password: thisclass
• Point your web browser (ideally, Firefox 4) at 192.168.1.2:8000
• Bookmark this page for easy access in future classes!
• Register by choosing a username and entering your UCLA ID
number. In the future you will login with this username and ID
number.
19
Using the System
• This requires that we all proceed through the steps together, so
we can share, analyze, and discuss our answers.
• Fill in your answer and click Go to submit it.
• If you get a message saying you left out some information, click
your browser’s Back button and re-submit the form.
• Then wait until I tell you to proceed to the next step.
20
Download your Assignments Today!
• Reading for Wednesday’s class. You must read this before class
in preparation for Wednesday’s quiz!
• This week’s homework, due a week from today.
• Download from http://c260a.bioinformatics.ucla.edu
21
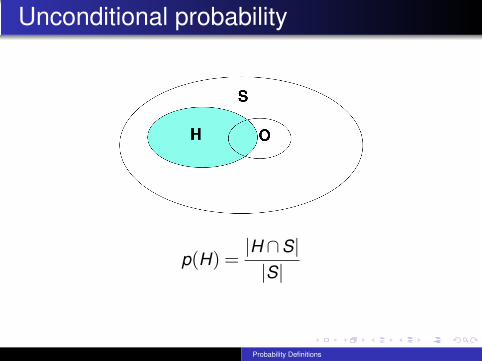
Unconditional probability
p(H) =|H ∩S||S|
Probability Definitions
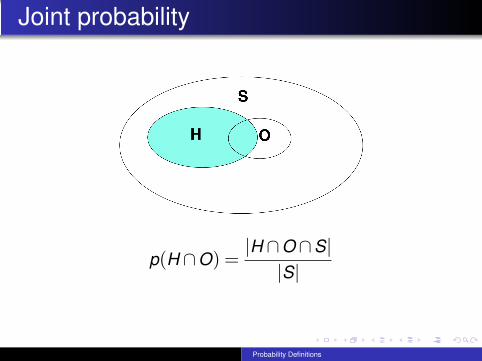
Joint probability
p(H ∩O) =|H ∩O ∩S|
|S|
Probability Definitions
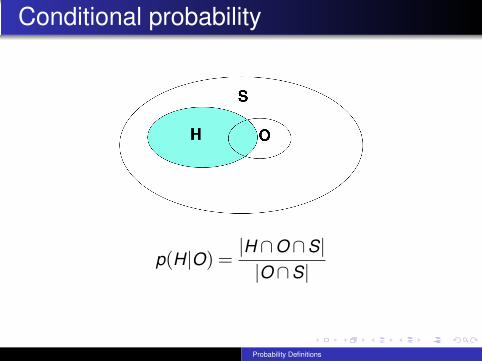
Conditional probability
p(H|O) =|H ∩O ∩S||O ∩S|
Probability Definitions
Hidden vs. Observable Variables
An observable is something you know with zerouncertainty. Concretely, this means ameasurement taken directly from someexperiment or measurement process you havedefined.A hidden variable is any value about which youhave some uncertainty. By definition, anythingthat isn’t observable.
Example:observable: measurement in “feet”hidden: the true length of some object.
Probability Definitions
Statistical inference
Observables are what you know.Hidden variables are what you want to know.Statistical inference is the mathematical processof computing probabilities of hidden variable(s)H based on actual observed values ofobservable variable(s) O.Concretely this means computing p(H|O).
Probability Definitions
hide notes
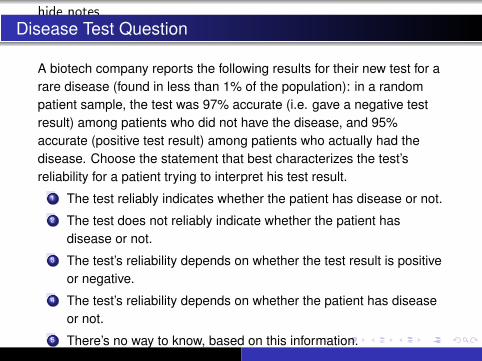
Disease Test Question
A biotech company reports the following results for their new test for arare disease (found in less than 1% of the population): in a randompatient sample, the test was 97% accurate (i.e. gave a negative testresult) among patients who did not have the disease, and 95%accurate (positive test result) among patients who actually had thedisease. Choose the statement that best characterizes the test’sreliability for a patient trying to interpret his test result.
1 The test reliably indicates whether the patient has disease or not.2 The test does not reliably indicate whether the patient has
disease or not.3 The test’s reliability depends on whether the test result is positive
or negative.4 The test’s reliability depends on whether the patient has disease
or not.5 There’s no way to know, based on this information.
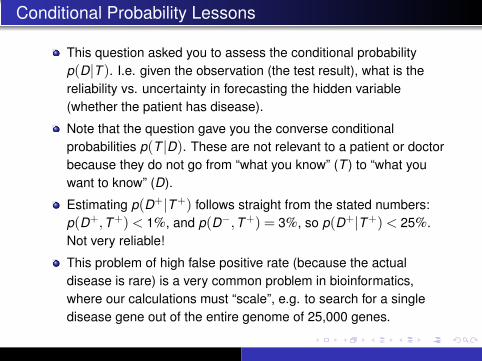
Conditional Probability Lessons
This question asked you to assess the conditional probabilityp(D|T ). I.e. given the observation (the test result), what is thereliability vs. uncertainty in forecasting the hidden variable(whether the patient has disease).
Note that the question gave you the converse conditionalprobabilities p(T |D). These are not relevant to a patient or doctorbecause they do not go from “what you know” (T ) to “what youwant to know” (D).
Estimating p(D+|T +) follows straight from the stated numbers:p(D+,T +) < 1%, and p(D−,T +) = 3%, so p(D+|T +) < 25%.Not very reliable!
This problem of high false positive rate (because the actualdisease is rare) is a very common problem in bioinformatics,where our calculations must “scale”, e.g. to search for a singledisease gene out of the entire genome of 25,000 genes.
Venn Diagram Conditional Probability
Draw a Venn diagram for two intersecting events A and B, and definethe conditional probability p(A|B) in terms of regions on the Venndiagram. Then use the Venn diagram to find the mathematical relationbetween p(A∩B) versus p(A|B) and p(B).
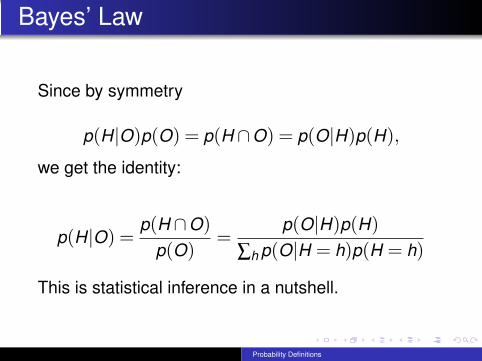
Bayes’ Law
Since by symmetry
p(H|O)p(O) = p(H ∩O) = p(O|H)p(H),
we get the identity:
p(H|O) =p(H ∩O)
p(O)=
p(O|H)p(H)∑h p(O|H = h)p(H = h)
This is statistical inference in a nutshell.
Probability Definitions