Embed Size (px)
DESCRIPTION
Introduction to a 2-step analysis for persistent organic pollutants. Peggy Krahn National Oceanic and Atmospheric Administration National Marine Fisheries Service. Peggy Krahn directs the National Marine Fisheries Environmental Conservation Division Laboratory in Seattle. - PowerPoint PPT Presentation
Citation preview

Introduction to a 2-step analysis for persistent organic pollutants
Peggy Krahn
National Oceanic and Atmospheric Administration
National Marine Fisheries Service
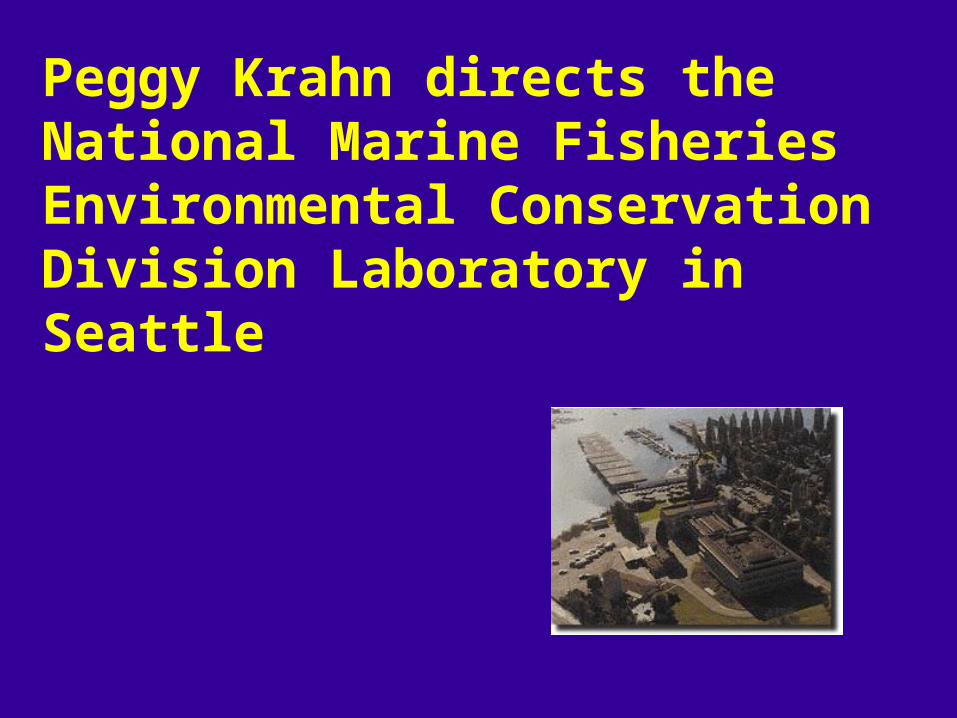
Peggy Krahn directs the National Marine Fisheries Environmental Conservation Division Laboratory in Seattle
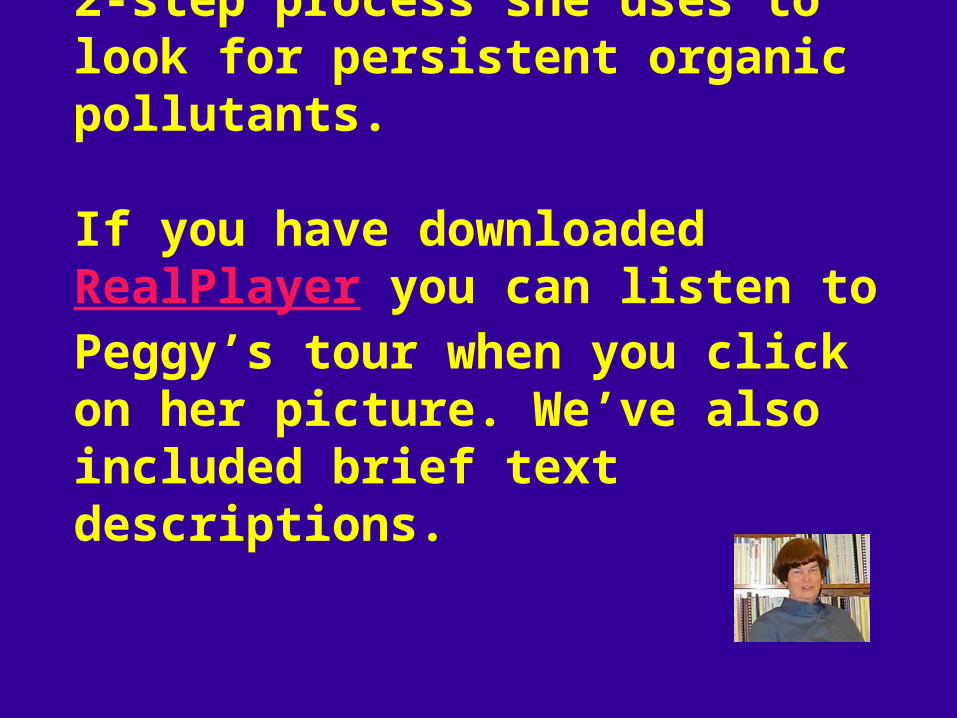
Peggy gave us a tour of the 2-step process she uses to look for persistent organic pollutants.
If you have downloaded RealPlayer you can listen to Peggy’s tour when you click on her picture. We’ve also included brief text descriptions.

The reason for a 2-step process is to start looking for contaminants with a less expensive approach.
If the first “rapid analysis” stage shows that there are contaminants, then the second stage can provide more complete information.
Let’s start with the rapid analysis step.
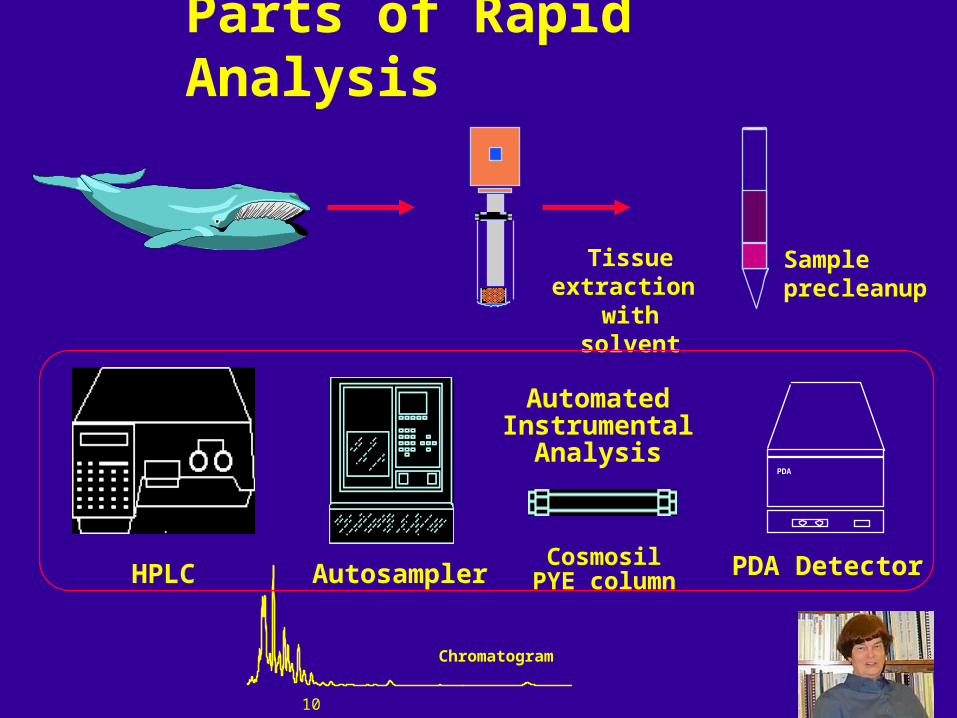
Parts of Rapid Analysis
Tissue extraction
with solvent
Sample precleanup
HPLC Autosampler
AutomatedInstrumental
Analysis
CosmosilPYE column
PDA
PDA Detector
10
Chromatogram

Compounds the rapid analysis step can identify and measure these contaminants
Pesticides: HCB, o,p’-DDT, p,p’-DDT, o,p’-DDD, p,p’-DDD,p,p’-DDE
Specific types of PCBs (“congeners”) 77, 101*, 105, 110, 114, 118, 126, 128, 138, 153, 156, 157, 169, 170/190, 180, 189, 200, total PCBs

The first step is to get rid of the water in the sample and mix it with gasoline-like solvents.

The next step is to separate the solids from the liquids. You do this with a centrifuge that spins the mixture very rapidly. Before using the centrifuge, you have to make sure it is balanced. Otherwise it will walk off the table with your sample!
The centrifuge itself is behind Darr’s arm.

There is now too much solvent in the sample. Darr here is boiling the solvents off under a hood that keeps the fumes away from her.

Next, Darr is using a column to separate natural materials in the sample from the contaminants
The black band in the glass column is the natural materials being captured, allowing the contaminants to go through to the bottle at the bottom

Back to the hood to boil off solvents

These are the actual instruments that measure the contaminants

The computer calculates a graph with peaks that show amounts of specific contaminants measured by the instruments in the previous slide
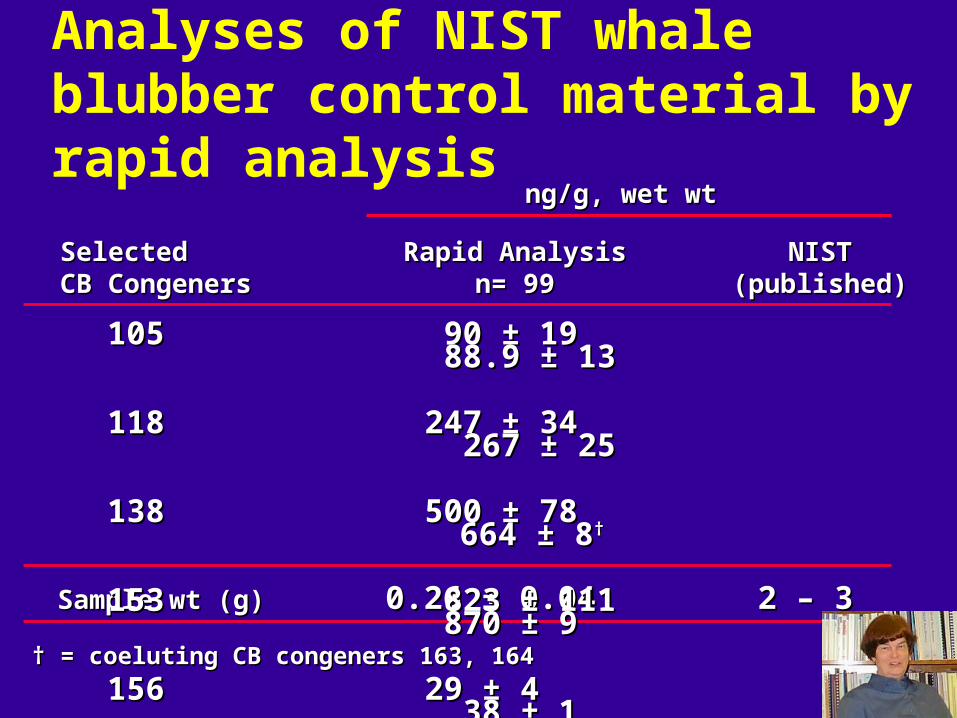
Sample wt (g)Sample wt (g) 0.26 ± 0.040.26 ± 0.04 2 – 32 – 3
SelectedSelected Rapid AnalysisRapid Analysis NISTNISTCB CongenersCB Congeners n= 99n= 99 (published)(published)
† † = coeluting CB congeners 163, 164= coeluting CB congeners 163, 164
ng/g, wet wtng/g, wet wt
105105 90 ± 19 90 ± 19 88.9 ± 1388.9 ± 13
118118 247 ± 34 247 ± 34 267 ± 25267 ± 25
138138 500 ± 78 500 ± 78 664 ± 8664 ± 8† †
153153 823 ± 111 823 ± 111870 ± 9 870 ± 9
156156 29 ± 4 29 ± 4 38 ± 1 38 ± 1
180180 495 ± 69 495 ± 69 483 ± 9 483 ± 9
Analyses of NIST whale blubber control material by rapid analysis

Parts of Detailed Analysis
Tissue extraction
with solvent
Sample precleanup
Automated Instrumental Analysis
10
Chromatogram
MSD
GC/MSHPLC

Contaminants measured in detailed analysis
Pesticides: HCB, -HCH, ß-HCH, lindane, aldrin, dieldrin, endosulfan I & II & sulfate, HPE, heptaclor, heptaclor epoxide, oxychlordane,-chlordane, -chlordane, trans-nonachlor, cis-nonachlor, o,p’-DDT, p,p’-DDT, o,p’-DDD, p,p’-DDD,o,p’-DDE, p,p’-DDE
PCBs: 17, 18, 28, 31, 33, 44, 49, 52, 66, 70, 74, 82, 87, 95, 99, 101/90, 105, 110, 118, 128, 138/163/164, 149, 151, 153/132, 156, 158, 170/190, 171, 177, 180, 183, 187/159/182, 191, 194, 195, 199, 205, 206, 208, 209
Toxaphenes PAHs

A marine mammal blubber sample (1-2 g) is weighed.
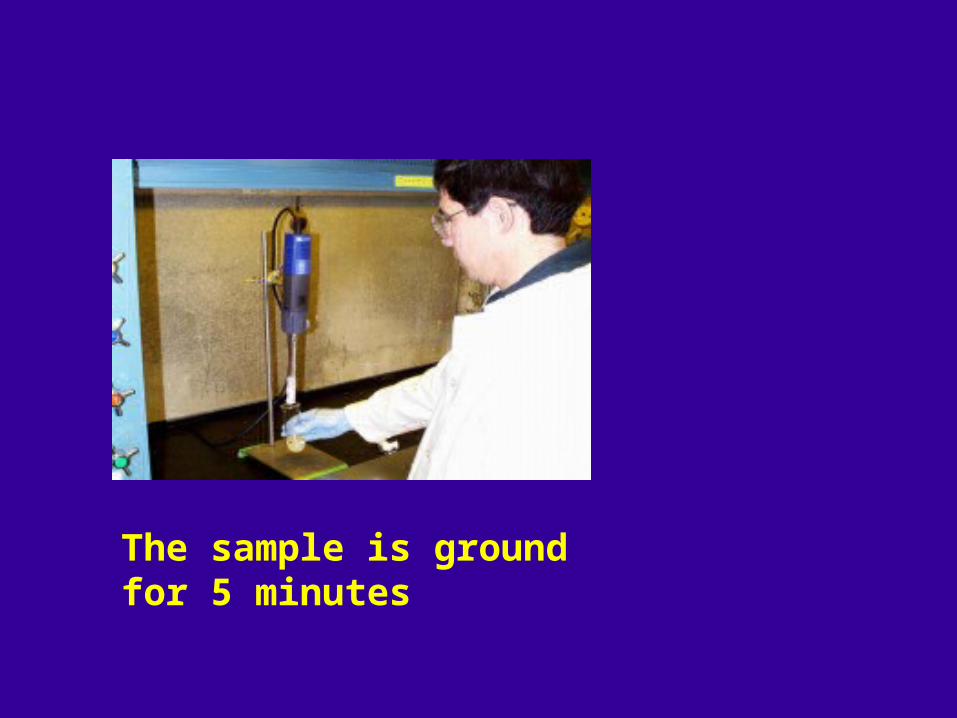
The sample is ground for 5 minutes

Balancing the sample for the centrifuge to separate the solid from the liquid

Pouring the liquid off through a column to take out the natural materials and leave the contaminants in the liquid
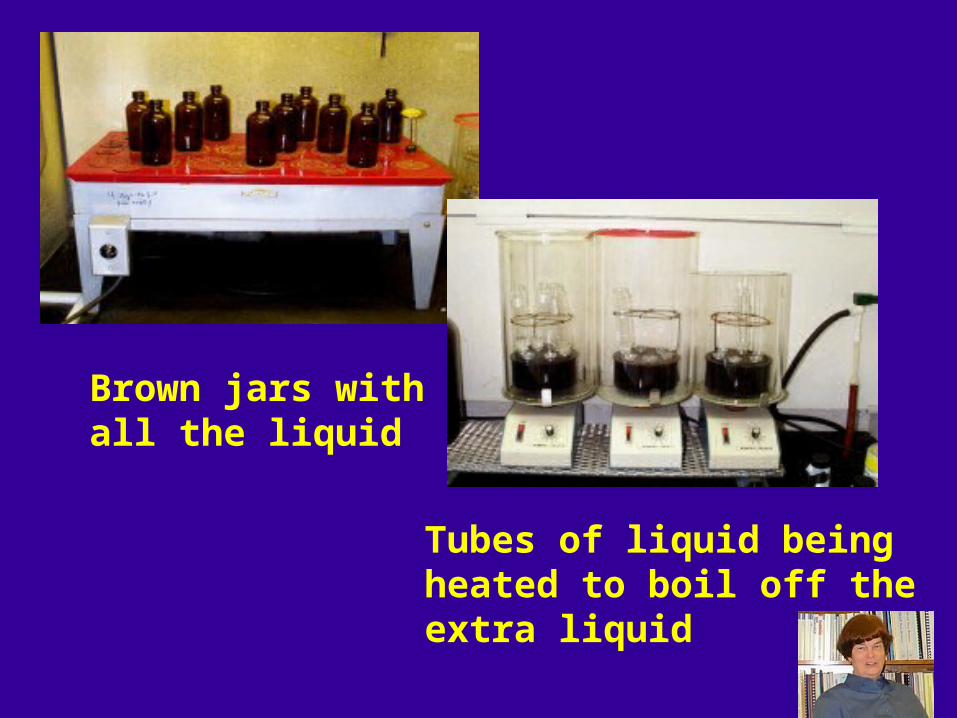
Brown jars with all the liquid
Tubes of liquid being heated to boil off the extra liquid

The High Performance Liquid Chromatograph (HPLC) to get rid of the rest of the lipids (fats)

We use this column filled with sand with a coating on it to separate the lipids from the contaminants

We boil off solvent again. Then we go further by putting it in the vial and use nitrogen gas get rid of more solvent. Then we can see contaminant peaks on the instrument.

A chromotgram from the Mass Spectrometer showing great detail
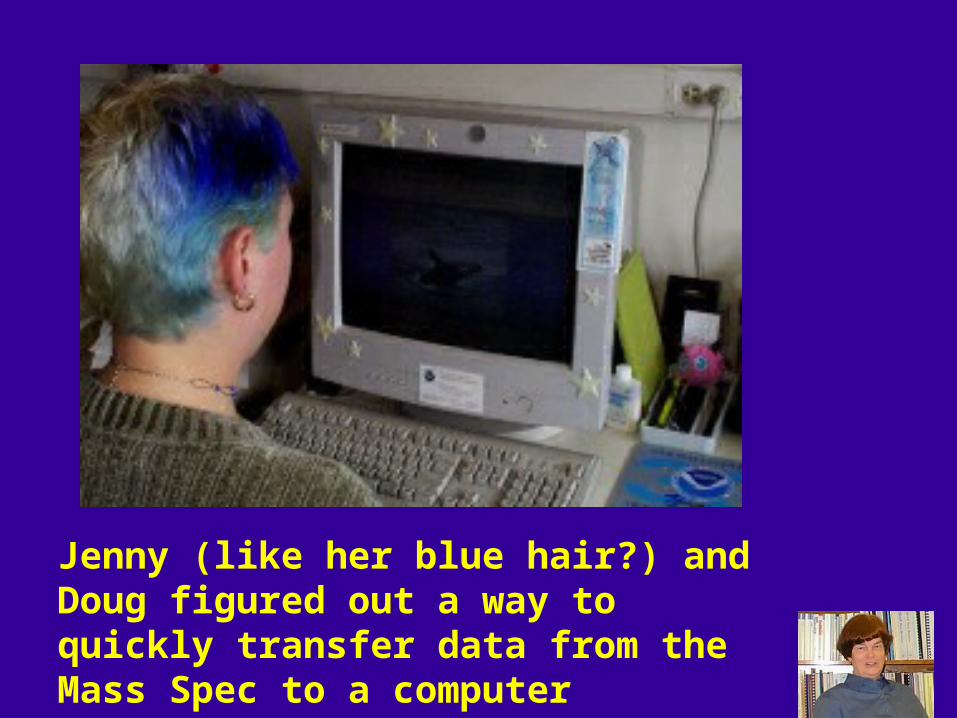
Jenny (like her blue hair?) and Doug figured out a way to quickly transfer data from the Mass Spec to a computer database

SelectedSelected NISTNIST
AnalytesAnalytes GC/MS GC/MS (certified)(certified)
Sample wt (g)Sample wt (g) ~ 1.5~ 1.5 2 – 32 – 3
ng/g, wet wtng/g, wet wt
HCBHCB 29.6 ± 1.3 29.6 ± 1.3 32.9 ± 1.732.9 ± 1.7
-chlordane-chlordane 50.0 ± 7.3 50.0 ± 7.3 46.9 ± 2.846.9 ± 2.8
p,p’-DDEp,p’-DDE 526 ± 33 526 ± 33 445 ± 37 445 ± 37
105105 27.0 ± 1.627.0 ± 1.6 30.1 ± 2.3 30.1 ± 2.3
118118 77.4 ± 3.2 77.4 ± 3.2 74.6 ± 5.1 74.6 ± 5.1
153/132153/132 236 ± 11 236 ± 11 213 ± 19 213 ± 19 156156 11.4 ± 0.911.4 ± 0.9 10.3 ± 1.110.3 ± 1.1170/190 170/190 41.2 ± 4.841.2 ± 4.8 40.6 ± 2.640.6 ± 2.6
Comparison of Results of Detailed Analysis to NIST whale blubber Standard Reference Material

Return to the Resource Guide
Click below to return to the Resource Guide