Embed Size (px)
Citation preview

The Apprentice Asia, June 2013 IG Markets Limited is incorporated in England. ABN 84 099 019 851. Australian Financial Services Licence No. 220440. Authorised Futures Dealer in New Zealand, Company No. 2249573.
Page 1 of 6
A PROUD SPONSOR OF
IG is a proud sponsor of The Apprentice Asia. We are the world’s number one CFD provider* serving over 140,000 clients globally.
In the IG episode of the show, the candidates traded CFDs on IG’s platform. You can do the same and gain access to currencies, commodities, global shares and indices – all from the one account.
The following summarises the introduction the candidates were given to trading by IG’s Chief Market Strategist, Chris Weston, and world-renowned charting expert Daryl Guppy.
INTRODUCTION - THE BASICS
WHAT IS A CFD?
A Contract for Difference (CFD) is a derivative that lets you trade on the change in value of a financial asset (such as a share) without the need to physically own that asset.
CFDs are leveraged products. You trade on margin, with only a small deposit required to take a larger position in the market.
There are many benefits to trading CFDs:
• Potentially profit on both rising and falling markets – with the ability to go long (buy) or short (sell)
• Trade on leverage, allowing you to invest without tying up your capital
• Access thousands of markets worldwide, all from one account.
WHICH MARKETS CAN YOU TRADE AS CFDs?
IG offers an extensive range of markets:
• Over 80 FX pairs, including EUR/USD and USD/JPY
• Commodities, like spot gold and light crude oil
• 24-hour stock indices, including Hong Kong HS42 and Wall Street, so you can trade even when the underlying market is closed
• US, Hong Kong and Singapore stocks, plus thousands of other global shares, binaries, options, interest rates, bonds and more.
WHAT ARE THE COSTS?
IG’s trading costs are competitive. There’s either a commission charge for trading share CFDs or a spread charge (difference between a buy and sell price) for other products:
• Trade EUR/USD from a low 0.8 pips and share CFDs from 0.1% commission.
View the complete list of costs in the rates section of our website.
HOW DO CFDs WORK?
Below is an example of how to sell EUR/USD with IG:
OpENINg THE pOSITION• You open a short trade on the euro against the US dollar on our quote
of 1.28871/1.28879. With one contract worth €100,000, you decide to sell 2 contracts at 1.28871.
• The value of your position is €200,000 x 1.28871 = US$257,742.
• To open the position you supply a deposit of just 0.5% of the position’s value, 0.5% x US$257,742= US$1,288 . There is no commission to pay on FX trades.
INTEREST ADjUSTMENTS• Interest will be calculated and paid on a daily basis. For a full explanation
on the interest rate calculations please refer to rates section of the website.
ClOSINg THE pOSITION• One week later, EUR/USD has fallen to 1.27731/1.27739, and you take
your profit by buying 2 contracts at 1.27739. Your gross profit on the trade is calculated as follows:
pROFIT ON TRADE
Opening level €200,000 (2 contracts) x 1.28871 = US$257,742
Closing level €200,000 (2 contracts) x 1.27739 = US$255,478
Gross profit on trade: US$2,264
• To calculate the net result you also have to include interest adjustments. For more information, see the Contract Details sections for each market on our website.
• Of course, had the market moved in the opposite direction, you would have made a loss that may have exceeded your initial deposit .

The Apprentice Asia, June 2013 IG Markets Limited is incorporated in England. ABN 84 099 019 851. Australian Financial Services Licence No. 220440. Authorised Futures Dealer in New Zealand, Company No. 2249573.
Page 2 of 6
HOW TO MAKE TRADINg DECISIONS
The two common methods traders use to analyse and make decisions about financial markets are fundamental and technical analysis. On The Apprentice Asia Chris Weston taught contestants how to identify trading opportunities using fundamental analysis, whilst Daryl Guppy taught them technical analysis.
FUNDAMENTAl ANAlYSIS
CHRIS WESTON, Ig CHIEF MARKET STRATEgISTChris has worked for a number of investment banks and is an established figure in the media, discussing global markets, FX and commodities on a range of television and radio channels, including CNBC, Bloomberg and Sky News Business.
HOW TO USE FUNDAMENTAl ANAlYSIS• Fundamental analysis is used to determine the underlying value of an
asset and discover factors that drive price action.
• When trading shares, fundamental analysts focus on aspects such as the balance sheet, income and cash flow statements.
• With other asset classes, such as currencies and commodities, the metrics differ.
• Currencies are generally valued based on the robustness of the underlying economy the currency represents.
• As a result, factors such as the interest rate, GDP, trade balance, jobs figures, CPI and manufacturing data all play a big role in determining the value of the currency.
• Supply and demand factors for commodities are generally determined by economic robustness/growth forecasts.
• Economists and analysts come up with forecasts for these various factors, which are generally updated monthly/quarterly.
• With a forecast value in place, any major variation from this forecast/estimate would then result in the currency moving.
An example of this can be seen in the chart on the right, showing how FX pairs can be affected when a central bank issues an interest rate setting that is not in line with forecasts, which happened with the Reserve Bank of Australia’s May 2013 cash rate decision.
Traditionally trying to trade currencies purely on fundamentals is tough, as the market is forward-looking and tries to price in news events well before they have occurred. This is why it is wise to use a blend of both fundamentals and price action (technicals).
The stock market is also forward-looking, however rather than looking at inflation and the perception of future monetary policy, equities are driven by the perception of future cash flow and earnings.
STOCK FUNDAMENTAlS
Stock fundamentals are all about trying to bring the nuts and bolts of a company’s financial situation together to determine what it is worth, whether it is cheap or expensive, and whether the return you get from your investment is compelling.
So traditionally, what are the common fundamental metrics used to do this?
pRICE-TO-EARNINgS RATIOThe first (and most common) valuation metric is price-to-earnings (P/E). This is the ratio between the current share price divided by the current earnings per share. The higher the P/E, the greater the expected earnings are in the future. The other way of looking at a high P/E ratio is that the share price has pushed past fair value, and that current earnings are not supportive of the higher share price. It is also important for investors to understand the limitations of P/Es; they don’t account for the underlying assets of the company or the fact that earnings could be under pressure from capital expansion or a seasonal downturn. Therefore, it should not be viewed on its own.
pRICE-TO-BOOK RATIOThe second metric to look at is price-to-book (PB) or price-equity ratio. This is the current share price dividend by the total assets, minus intangible assets and liabilities from the last quarter. It looks at the total value of the assets the company owns, versus the share price. A low price-to-book ratio could suggest the company is cheap and that the market is undervaluing the current situation. However, it may also mean there are structural issues with the company’s assets, and it could see write-downs justifying the figure.
RETURN-ON-EQUITYReturn-on-equity (ROE) is the net income (in percentage terms) returned to shareholders. It illustrates how much profit the company makes with the capital shareholders invested in the company. It is calculated by dividing the net income for the full fiscal year by the equity held by the shareholder. The higher the percentage, the better the returns. Again, this considers just one part of the business, and it tends not to be forward-looking. In theory, equity markets are forward-looking, so it may not give the full picture as to the outlook of the company. Profit can be lost quickly if assets and earnings are under pressure.
■ While most economists expected the interest rate to remain on hold at 3%, the RBA cut rates by 0.25% to 2.75%.
■ The result saw a sharp drop in the AUD as traders responded to the revaluation of the currency from a yield perspective, and revised forecasts for future rate expectations.
■ This chart shows the sharp move on the back of the announcement.
The Apprentice Asia, June 2013 IG Markets Limited is incorporated in England. ABN 84 099 019 851. Australian Financial Services Licence No. 220440. Authorised Futures Dealer in New Zealand, Company No. 2249573.
Page 3 of 6
TECHNICAl ANAlYSIS
DARYl gUppY FOUNDER AND DIRECTOR OF gUppYTRADERS.COMDaryl Guppy, otherwise known as CNBC’s “Chart Man” is the founder and Director of Guppytraders.com and a much sought-after speaker in Asia, Europe and Australia. As
an active trader in equities and derivatives, Daryl is recognised globally for the quality of his analysis and has a weekly column on www.cnbc.com. He is also the author of many successful trading books and contributes to several other financial publications around the world, including Your Trading Edge, China Daily and Active Trader. He accurately predicted the Asian Financial Crisis and the Global Financial Crisis.
UNDERSTANDINg CHARTS• Charts are used to understand market behaviour and identify
trading opportunities.
• Charting uses price action to understand and infer what market participants know.
• When a trade is made and a new price is set, the chart captures all of the information known at that point in time. The trading activity shows the behaviour and thinking of the market participants.
• If you understand the behaviour then you can anticipate how the next price move may develop. This analysis is independent of any other information about the company, index, currency or commodity, and is called ‘reading the chart’.
■ This chart shows sudden changes in the trend behaviour.
■ The price activity alone shows that important information is leaking into the market.
■ We do not need to know the exact nature of the information to understand that it is having a significant impact on price.
■ Just understanding the price activity provides a trading opportunity in advance of the formal release of news to the general public.
HOW TO IDENTIFY FUNDAMENTAl AND TECHNICAlTRADINg OppORTUNITIES
IG’s unique insight centre provides the essential fundamental and technical information traders require, including:
• Economic Calendar – updates economic announcements in real time, displaying key economic data the second they are released to the market.
• Spot Chart Patterns – finding charts displaying certain patterns, such as upward sloping triangles which Daryl Guppy taught The Apprentices, is made easy with Autochartist.
• IG Client Sentiment – on every market, our insight centre gives you a unique, consolidated overview of our clients’ trading patterns to allow you to gauge market sentiment.
• Live Reuters News – keep up to date with all the key market-moving news with our professional-level news service.
To gain access to our insight, news and analysis centre, plus thousands of markets and IG’s trading platform, open an account in minutes online today.
The Apprentice Asia, June 2013 IG Markets Limited is incorporated in England. ABN 84 099 019 851. Australian Financial Services Licence No. 220440. Authorised Futures Dealer in New Zealand, Company No. 2249573.
Page 4 of 6
MORE INFORMATION ON TECHNICAl INDICATORS
After talking contestants through the basics of technical analysis, Daryl went in to more detail about making decisions using technical indicators.
UNDERSTANDINg CHART pATTERNS• Price behaviour often develops into a well-defined pattern. These include
triangle, head and shoulder, cup and flag patterns.
• Patterns are useful because they identify common behaviour which is likely to develop in a particular way.
• Chart patterns set high probability price targets. Traders like patterns because the price target is often achieved.
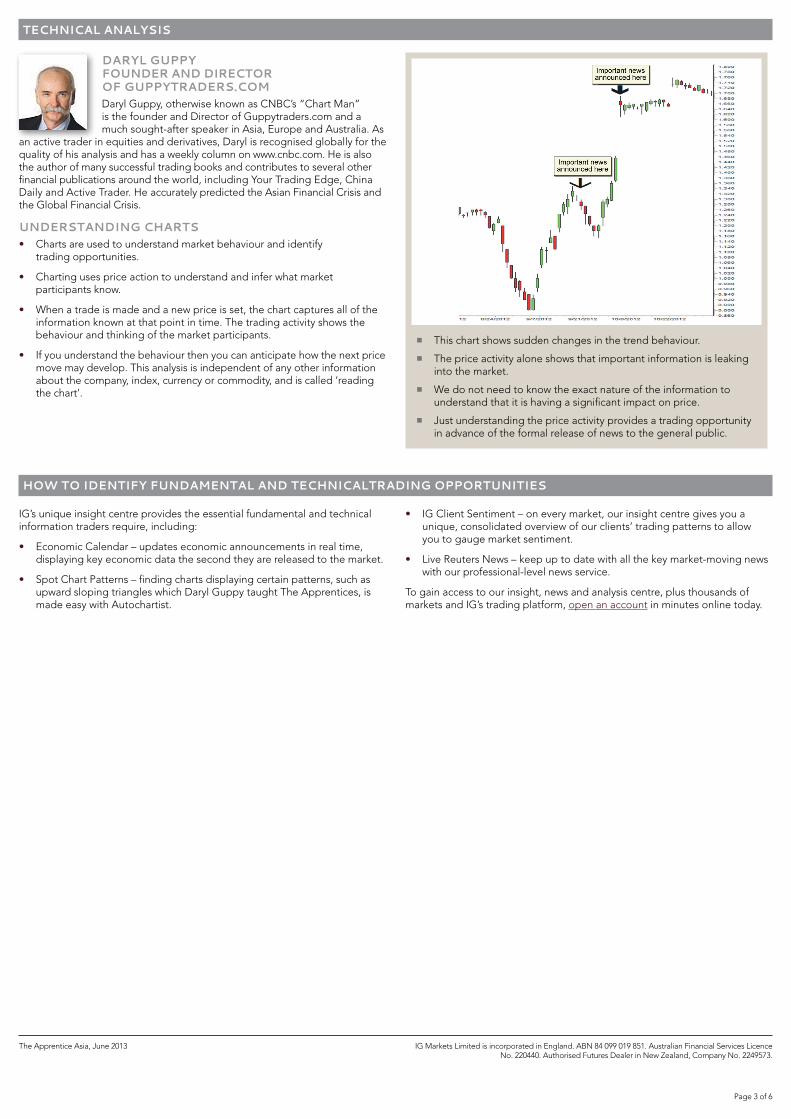
■ The up-sloping triangle pattern shows existing shareholders believe the stock has stopped rising. Every time the price moves towards the resistance level they sell. Their selling drives down the price.
■ The up-sloping tend line defines the activity of people who want to become shareholders because they believe the stock’s future is very good. As time goes by these potential shareholders become worried they might miss out, so they enter buy orders in the market at higher and higher prices. The activity creates the up-sloping trend line.
■ The base of the triangle pattern is used to calculate the potential upside price target. When all the previous shareholders who wanted to sell at the resistance level have sold their stock then the price often moves up very rapidly. This is a pattern breakout.
■ These patterns can be used to identify the start of a new trend, or, as with a head and shoulder pattern, the end of an existing trend.
UNDERSTANDINg TECHNICAl INDICATORS• Mathematical analysis is used to identify the behaviour of the market and
the probability of it continuing.
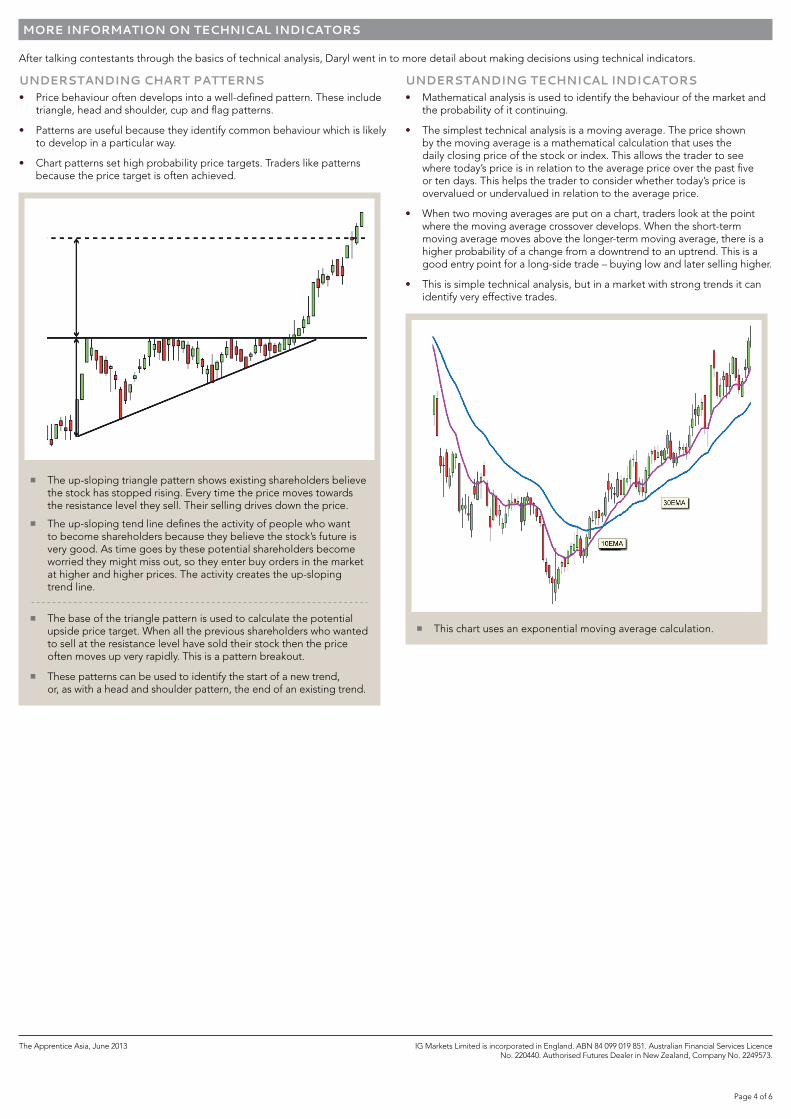
• The simplest technical analysis is a moving average. The price shown by the moving average is a mathematical calculation that uses the daily closing price of the stock or index. This allows the trader to see where today’s price is in relation to the average price over the past five or ten days. This helps the trader to consider whether today’s price is overvalued or undervalued in relation to the average price.
• When two moving averages are put on a chart, traders look at the point where the moving average crossover develops. When the short-term moving average moves above the longer-term moving average, there is a higher probability of a change from a downtrend to an uptrend. This is a good entry point for a long-side trade – buying low and later selling higher.
• This is simple technical analysis, but in a market with strong trends it can identify very effective trades.
■ This chart uses an exponential moving average calculation.

The Apprentice Asia, June 2013 IG Markets Limited is incorporated in England. ABN 84 099 019 851. Australian Financial Services Licence No. 220440. Authorised Futures Dealer in New Zealand, Company No. 2249573.
Page 5 of 6
■ One of the most useful signals is a divergence signal. This appears when the trend in the indicator is moving in the opposite direction to the trend on the price or index chart. This divergence suggests that the trend on the price or index chart has a high probability of ending.
■ Divergence is an important concept because it suggests that the trader can look behind the first impression created by a chart, or market activity. When the crowd roars at a football match we cannot tell which team kicked the goal, nor if this is a goal added to a high, or a low score. The roar tells us something happened, but we need additional information to determine its importance.
■ When the roar comes after a high score, we know to ignore it because it’s not a winning goal for a team that is so far behind. We see a divergence - nice roar, but a lousy single goal. If the roar is for a goal which puts the team ahead, then it’s a different matter, and we pay greater attention. Divergence warns us that all may not be as it seems on the surface.
■ Technical analysis can also be used to understand the inferred behaviour of market participants. The two most important market participants are traders and investors. Traders take a short-term view of the market. They try to quickly identify changes in the trend.
■ Investors are more cautious. They wait for trend changes to be confirmed before they enter the market. The Guppy Multiple Moving Average (GMMA) captures the behaviour of these two groups in the market.
■ Although the indicator uses a group of moving averages, the important information does not come from the moving average crossover. What is important is the information about the strength of the trend and its potential for a sustainable change.
■ When the two groups of moving averages compress it shows agreement about price and value. This often precedes a major change in the trend. Wide separation in each group of averages, and wide separation between the groups, shows a stable and sustainable trend.
■ It’s safe to buy on dips in the price because the uptrend has a high probability of continuing. This type of analysis allows traders to develop better trading tactics for the market conditions.
The Apprentice Asia, June 2013 IG Markets Limited is incorporated in England. ABN 84 099 019 851. Australian Financial Services Licence No. 220440. Authorised Futures Dealer in New Zealand, Company No. 2249573.
Page 6 of 6
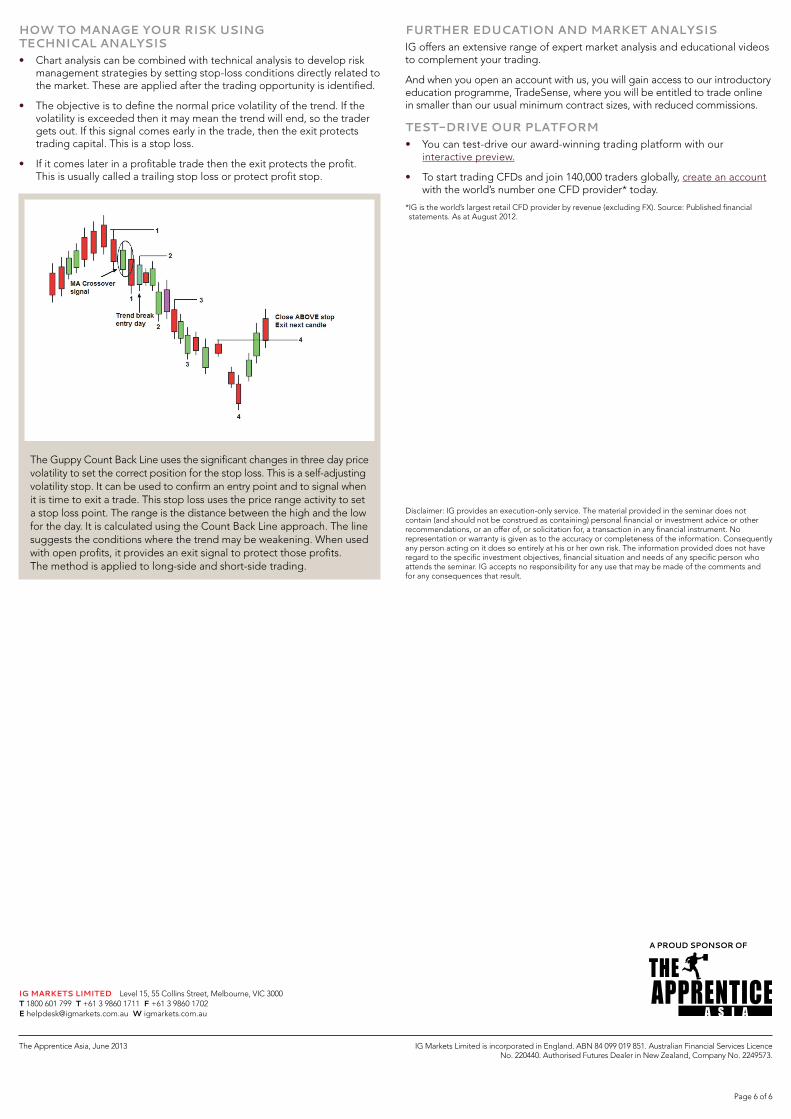
HOW TO MANAgE YOUR RISK USINg TECHNICAl ANAlYSIS• Chart analysis can be combined with technical analysis to develop risk
management strategies by setting stop-loss conditions directly related to the market. These are applied after the trading opportunity is identified.
• The objective is to define the normal price volatility of the trend. If the volatility is exceeded then it may mean the trend will end, so the trader gets out. If this signal comes early in the trade, then the exit protects trading capital. This is a stop loss.
• If it comes later in a profitable trade then the exit protects the profit. This is usually called a trailing stop loss or protect profit stop.
FURTHER EDUCATION AND MARKET ANAlYSISIG offers an extensive range of expert market analysis and educational videos to complement your trading.
And when you open an account with us, you will gain access to our introductory education programme, TradeSense, where you will be entitled to trade online in smaller than our usual minimum contract sizes, with reduced commissions.
TEST-DRIVE OUR plATFORM• You can test-drive our award-winning trading platform with our
interactive preview.
• To start trading CFDs and join 140,000 traders globally, create an account with the world’s number one CFD provider* today.
* IG is the world’s largest retail CFD provider by revenue (excluding FX). Source: Published financial statements. As at August 2012.
Disclaimer: IG provides an execution-only service. The material provided in the seminar does not contain (and should not be construed as containing) personal financial or investment advice or other recommendations, or an offer of, or solicitation for, a transaction in any financial instrument. No representation or warranty is given as to the accuracy or completeness of the information. Consequently any person acting on it does so entirely at his or her own risk. The information provided does not have regard to the specific investment objectives, financial situation and needs of any specific person who attends the seminar. IG accepts no responsibility for any use that may be made of the comments and for any consequences that result.
Ig MARKETS lIMITED Level 15, 55 Collins Street, Melbourne, VIC 3000 T 1800 601 799 T +61 3 9860 1711 F +61 3 9860 1702 E [email protected] W igmarkets.com.au
A PROUD SPONSOR OF
The Guppy Count Back Line uses the significant changes in three day price volatility to set the correct position for the stop loss. This is a self-adjusting volatility stop. It can be used to confirm an entry point and to signal when it is time to exit a trade. This stop loss uses the price range activity to set a stop loss point. The range is the distance between the high and the low for the day. It is calculated using the Count Back Line approach. The line suggests the conditions where the trend may be weakening. When used with open profits, it provides an exit signal to protect those profits. The method is applied to long-side and short-side trading.