Embed Size (px)
Citation preview
The Institute on DisabilitiesPennsylvania's University Center for Excellence in
Developmental Disabilities
Independent Monitoring for Quality (IM4Q)A Statewide Summary
2011-2012
Submitted to: Pennsylvania Office of Developmental ProgramsStatewide Steering Committee on Independent
Monitoring
Submitted by: Celia S. Feinstein, James A. Lemanowicz, Mary Kay R. Cunningham and Ross Whiting The Institute on DisabilitiesPennsylvania's University Center for Excellence in Developmental DisabilitiesTemple UniversityStudent Center, 411S1755 North 13th StreetPhiladelphia, PA 19122
January, 2013

Introduction
In 1997, Pennsylvania’s Office of Developmental Programs (ODP) developed a
multi-year plan that represented a significant effort to convey its vision, values and goals
for the coming years. As a result, recommendations were made to create a
subcommittee of individuals, families, providers, advocates, administrative entity staff
and ODP staff to create an independent monitoring program across the state of
Pennsylvania. At the same time, a national project was developed to identify
performance indicators that states could collect to determine the status of their system
via the experiences of individuals, families, and providers delivering supports.
Pennsylvania aligned the project created by ODP’s subcommittee with the newly
developed National Core Indicators to create the Independent Monitoring for Quality
(IM4Q) Program.
As a result of the IM4Q Program, ODP has developed and begun to implement
quality improvement strategies (QIS) to ensure the continued improvement of services
and supports people receive through Pennsylvania’s intellectual disability system. The
IM4Q data are one source of information used to increase the quality of ODP’s services
and supports. The IM4Q Program is contracted through each of the 48 Administrative
Entities (AEs). Each year, the AEs develop contracts with Local IM4Q Programs to
independently conduct interviews and enter data into the DPW HCSIS web-based
system. The IM4Q data are analyzed and reports are developed for dissemination to
ODP staff, individuals, families, guardians, AEs, Local Programs, providers and other
interested people.
A list of the number of individuals receiving services and their family, friends and
guardians who completed surveys in the following years is listed in the table below:
Fiscal Year Individuals Surveyed Friends, Family, Guardians Surveyed
2000-2001 5298 2224
2001-2002 5659 2494
2002-2003 4687 3163
Independent Monitoring for Quality Report 2011-2012 Page 1
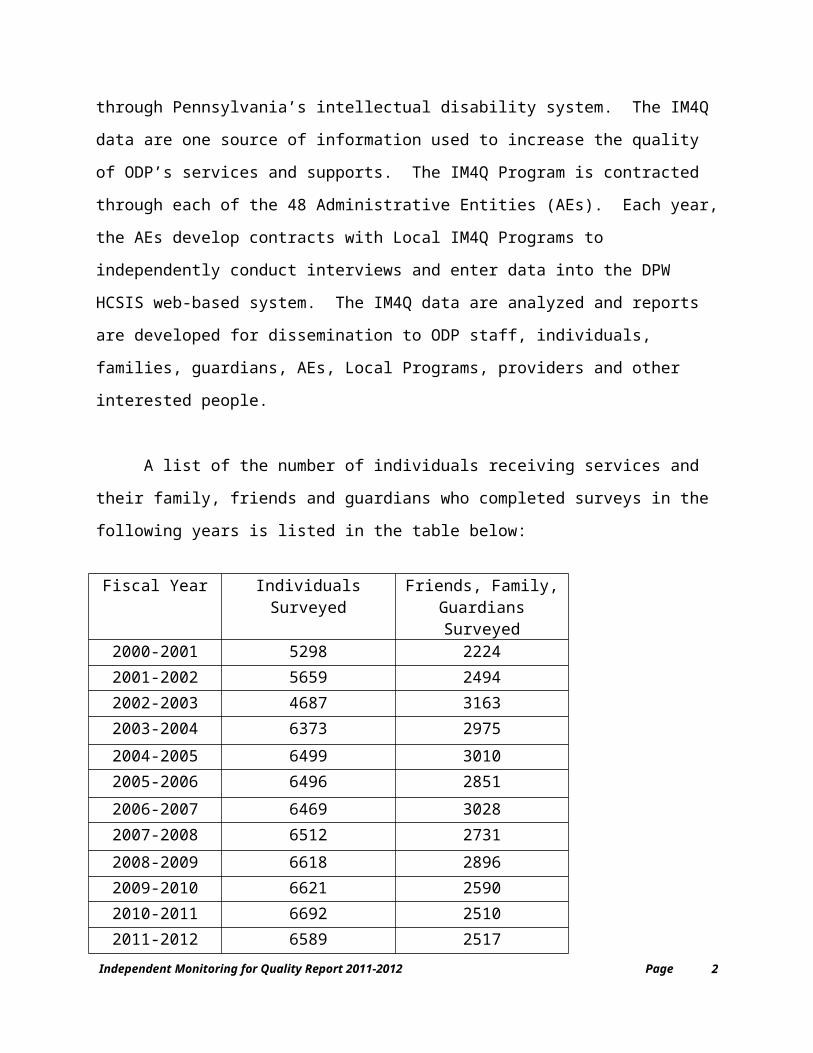
2003-2004 6373 2975
2004-2005 6499 3010
2005-2006 6496 2851
2006-2007 6469 3028
2007-2008 6512 2731
2008-2009 6618 2896
2009-2010 6621 2590
2010-2011 6692 2510
2011-2012 6589 2517
Methodology
Instrument
The interview instruments for IM4Q include the Essential Data Elements (EDE) survey,
which includes a pre-survey form, and the Family/Friend/Guardian (F/F/G) survey. The
IM4Q Essential Data Elements (EDE) survey has a total of 85 questions, reduced from
the 101 questions asked previously. Thirty-five of the questions can only be answered
by the individuals receiving supports and services.
The EDE for fiscal year 2011-2012 includes all survey questions included in the FY
2011-2012 NCI Adult Consumer Survey. At the time of this report, approximately 1415
individuals included in this report are represented in the NCI sample for 2011-2012,
based on a sampling methodology established by ODP and the Human Services
Research Institute (HSRI). A copy of the NCI report for FY 2011-12 is available on the
HSRI website at www.nationalcoreindicators.org.
The Essential Data Elements (EDE) instrument is comprised of the following sections:
A pre-survey, which was completed by the AE designee prior to the scheduling of the appointment with the individual to give the local IM4Q Program information needed to schedule the interview with the individuals. Information includes: the person’s address, contact people, supports coordinator information, accessibility and the individual’s communication style (which may require the use of an interpreter, e.g. Sign Language or Spanish). Often this information is provided by the supports coordination organization (SCO).
Independent Monitoring for Quality Report 2011-2012 Page 2

A pre-survey addendum, which was completed by the AE for only those individuals who were designated as part of the NCI sample. The addendum provides demographic information, along with information about the individual’s degree and type of disability(ies), work and day activity routines.
Satisfaction – this section was only to be completed based on the responses of the individual receiving supports. Questions were asked about satisfaction with where the individual works and lives, as well as with staff who support the individual.
Dignity, Respect and Rights – this section was also only to be completed based on responses of the individual receiving supports. Questions were asked about whether roommates and staff treated people with respect, whether people were afforded their rights, and whether they had fears at home, at work or in the community.
Choice and Control – the questions in this section were answered by the individual, or by a family member, friend or staff person. Questions were asked about the extent to which individuals exerted choice and control over various aspects of their lives.
Relationships – the questions in this section were answered by the individual, or by a family member, friend or staff person; questions were asked about friends, family and neighbors, and individuals’ opportunity to visit and contact them.
Inclusion – the questions in this section were answered by the individual, or by a family member, friend or staff person. Questions were asked about opportunities for community inclusion; a section of the Harris Poll was included for comparative purposes.
Monitor Impressions – this section of the survey was completed by the Independent Monitoring team, after they had completed their visit. Questions were asked in the areas of physical setting, staff support and opportunities for growth and development.
Major Concerns – this form was completed whenever there was an issue related to physical danger, significant sanitation problems, or evidence of physical or psychological abuse or neglect. Each program was required to develop a mechanism for communicating this information. In the event of imminent danger, teams were instructed not to leave the home until resolution of some kind was achieved.
Family/Friend/Guardian (F/F/G) Survey – a survey was conducted with each family once the individual gave his/her approval. Questions related to the families’ satisfaction with their relatives’ living situation, as well as perceived satisfaction of their relatives. The survey was conducted either by phone or face-to-face at the time of the EDE interview.
SampleIndependent Monitoring focuses on the quality of life and services and supports to
children ages three and over, and to adults supported by the Office of Developmental
Programs service system for individuals with intellectual disabilities. In Fiscal Year
1999-2000, the sample for IM4Q was restricted to individuals living in licensed
Independent Monitoring for Quality Report 2011-2012 Page 3

residential settings in 19 AEs, including licensed community homes and apartments,
family living arrangements, non-state operated private intermediate care facilities for
people with intellectual disabilities (ICFs/ID) and large community homes (formerly
private licensed facilities).
In Fiscal Year 2000-01, the sample for IM4Q was expanded to include individuals not
receiving residential supports. This resulting sample included 30 adults per county in
the NCI subset and others living at home with families, in unlicensed living
arrangements and independently. The proportion of individuals in non-residential
settings for purposes of the NCI sample was to be proportional to the number of people
receiving non-residential supports in the AE. Administrative Entities were instructed to
draw a random sample of approximately one-third of the individuals living in licensed
residential settings. AEs were provided with written instructions for drawing the entire
Fiscal Year 2001-02 sample; once the sample was selected, ODP staff checked the
samples before individual names were given to the local IM4Q Program, to ensure
consistency in the sample selection.
During fiscal year 2003-04, in addition to the NCI and residential samples, each AE was
instructed to include 30 individuals who participate in the Person and Family Directed
Supports (PFDS) Waiver. Individuals participating in the PFDS Waiver continued to be
included in the sample in each subsequent year.
The sampling procedure for this year continues to be drawn through the Home and
Community Services Information System (HCSIS); ODP’s computerized database
continues to be used to enter IM4Q data as well. The following table shows the
breakdown of the sample by type of residential setting. As the table shows, the majority
of the people in the sample live in supervised living settings. Many people in the
sample live at home with families, due in part to the sub-sample of people receiving
supports through the PFDS waiver as well as for those who are a part of the NCI
sample.
Independent Monitoring for Quality Report 2011-2012 Page 4

N PercentState-Operated ICF/MR 72 1.1% State MH Hospital 3 0.0%Homeless 0 0.0%Temporary Shelter 1 0.0% Foster Care 11 0.2%Nursing Home/Facility 98 1.5%Domiciliary Care 29 0.4%Personal Care Home 134 2.1%Family Living/Life sharing 371 5.7%Unlicensed Family Living 39 0.6% Own Residence 482 7.3%Relative’s Home 1752 26.8%Children’s Facility 5 0.1%Approved Private School 7 0.1%Private ICF/MR <4 71 1.1%Private ICF/MR 5-8 139 2.1%Private ICF/MR 9-15 17 0.3%Private ICF/MR 16+ 245 3.7%Community Home 1 154 2.4%Community Home 2-4 2496 38.2%Community Home 5-6 216 3.3%Community Home 7-8 77 1.2%Community Home 9-15 30 0.5%Community Home 16+ 37 0.6%Other 49 0.7%Missing 54 0.7%Total 6589 100%
Procedure
Selection of Local IM4Q Programs
ODP requested that AEs select local IM4Q Programs to conduct interviews with
individuals and families using the EDE and F/F/G Survey. All potential IM4Q programs
were screened by the State IM4Q Steering Committee. Selection criteria included:
independence of the programs from service delivering entities, consumer and family
involvement on governing boards, and involvement of individuals receiving supports and
families in data collection activities. Local IM4Q Programs were selected by AEs from a
variety of organizations, including non-service providing chapters of The Arc,
Consumer Satisfaction Teams (in the mental health system), parent groups, universities
and colleges, Centers for Independent Living, and newly formed entities.
Independent Monitoring for Quality Report 2011-2012 Page 5
Training
Local IM4Q Programs received training on the EDE, F/F/G Survey and interviewing
protocols from technical advisors from the Institute on Disabilities at Temple University.
Trainings were held in each of the four regions for project staff and monitors, wherever
possible. Additional training was provided on an AE-by-AE basis for monitors, as
requested. Data entry instruction was provided by ODP.
Sample and Team Interview Process
Once an annual HCSIS drawn random sample is sent to the AE from ODP, the AE
establishes a final list of individuals to be monitored. This list is forwarded to the Local
Independent Monitoring for Quality Program which assigns the IM4Q teams. IM4Q
teams are comprised of a minimum of two people, one of whom must be an individual
with a disability or a family member. Teams may also include other interested citizens
who are not part of the ODP service system. Visits to individuals’ homes are scheduled
with the individual, or with the person designated on the pre-survey form that is
completed prior to the visit.
Participation in the interview is voluntary; if an individual refuses to participate, s/he is
replaced in the sample with another individual. The interview takes place at the home
of the individual, but if s/he prefers that the interview take place elsewhere, alternate
arrangements are made. The interview is conducted in private whenever possible,
unless the individual expresses a desire to have others present. Once the interview is
completed, if the individual gives his/her permission, a survey is conducted with the
family/friend/guardian, either face-to-face (at the time of the interview) or by phone.
After the EDE is completed by the IM4Q team, the completed Essential Data Elements
forms are returned to the local IM4Q Program for data entry. Family/Friend/Guardian
data are collected either by the interview team or by staff of the local IM4Q program.
EDE and F/F/G Survey data are entered directly onto the HCSIS website. Data for the
2011-12 survey cycle were collected by June 30, 2012 and entered into HCSIS by
Independent Monitoring for Quality Report 2011-2012 Page 6

August 15, 2012. A data file was received by the Institute on Disabilities in November,
2012. This report presents data on the individuals surveyed by the IM4Q Local
Programs, representing the 48 AEs across the state. In addition to this report, each AE
and local program will receive a report about the people monitored in their county.
Separate reports will also be developed by HSRI for those individuals in the NCI sample
and by the Institute on Disabilities for those individuals in the PFDS sample and those
living in state centers.
Closing the Loop/Follow-up
In addition to this summary report and similar ones for each of the AEs, each local IM4Q
Program has developed a process, referred to as “closing the loop” which ensures that
follow-up activity with the AE is completed related to individual considerations for
improvement. “Closing the loop” is an integral part of the quality improvement process,
as it places quality improvement responsibilities with the AEs, supports coordinators,
and other providers of service. “Closing the loop” is also facilitated by provider level
reporting in HCSIS, which enables providers of service and the AEs to review finalized
aggregate IM4Q results. The IM4Q data warehouse in HCSIS also allows AE, regional
and state personnel to review IM4Q aggregate data based on key demographic
variables such as age, gender, race and type of living arrangement.
RESULTSThe following table displays the distribution of interviews conducted by each
independent monitoring program by Administrative Entity.# of People Percent
Allegheny 665 10.1%Armstrong/Indiana 107 1.6%Beaver 112 1.7%Bedford/Somerset 83 1.3%Berks 172 2.6%Blair 107 1.6%Bradford/Sullivan 49 0.7%Bucks 239 3.6%Butler 97 1.5%Cambria 98 1.5%Cameron/Elk 22 0.3%Carbon/Monroe/Pike 111 1.7%Centre 76 1.2%
Independent Monitoring for Quality Report 2011-2012 Page 7
Chester 168 2.5%Clarion 51 0.8%Clearfield/Jefferson 86 1.3%Columbia/Montour/Snyder/Union 102 1.5%Crawford 93 1.4%Cumberland/Perry 98 1.5%Dauphin 165 2.5%Delaware 278 4.2%Erie 260 3.9%Fayette 89 1.4%Forest/Warren 49 0.7%Franklin/Fulton 82 1.2%Greene 40 0.6%Huntington/Mifflin/Juniata 83 1.2%Lackawanna/Susquehanna 159 2.4%Lancaster 163 2.5%Lawrence 87 1.3%Lebanon 74 1.1%Lehigh 158 2.4%Luzerne/Wyoming 145 2.2%Lycoming/Clinton 109 1.7%McKean 50 0.8%Mercer 83 1.3%Montgomery 323 4.9%Northampton 126 1.9%Northumberland 92 1.4%Philadelphia 777 11.8%Potter 24 0.4%Schuylkill 93 1.4%Tioga 46 0.7%Venango 56 0.8%Washington 90 1.4%Wayne 39 0.6%Westmoreland 159 2.4%York/Adams 154 2.3%TOTAL 6589 100%
Independent Monitoring for Quality Report 2011-2012 Page 8

Satisfaction
Respondents: Only the individual receiving services/supports could answer the
questions on satisfaction. A consistency check was performed and 96 individuals’
surveys were not included in the satisfaction section. The percent of people who
responded to questions in this section ranged from 33% to 64%.
Satisfaction with Living Arrangements
91% of individuals liked where they live.
79% wanted to stay where they currently live but 16% wanted to move
somewhere else.
Satisfaction with Work/Day Activity 91% of individuals with a day activity/work liked what they did during the day.
72% wanted to continue their current daytime activities/work, but 21% wanted to
do something else.
Like What I Have Now Inbetween Want Something Else
79%
5%
16%
72%
7%
21%
Want to Stay or Change Living Arrangement and Work/Day Activity
Living Arrangement (n=3798) Work/Day Arrangement (n=3849)
Independent Monitoring for Quality Report 2011-2012 Page 9

Daily Life 90% of the individuals reported getting the services they needed to be able to live
in their home, 6% said yes, but they sometimes need more, and 4% said they do
not get the services they need to be able to live.
On most weekdays, 36% of individuals attended an adult training program, 28%
attended a vocational facility, 24% stayed home, 19% went out and did things in
the community, 10% worked part time for pay, 7% volunteered, 5% helped
neighbors and friends, 5% attended school, 3% are retired, 2% worked full time
for pay, and less than 1% attended college or a trade school.
Happiness and Loneliness 83% reported feeling happy overall, 14% reported being neither happy nor sad,
and 3% reported feeling sad overall.
61% of individuals reported never feeling lonely, 34% reported sometimes feeling
lonely, and 5% reported always feeling lonely.
92% reported having friends they like to do things with – for 75% of these people
their friends are not staff or family.
75% reported that they can go on a date if they want to or are married; 13%
reported that they can go on a date if they want to but there are some restrictions
and rules and 13% are not allowed to date.
Privacy 96% of the individuals surveyed reported that they have enough privacy (a place
to be alone) at home.
91% reported that other people always let them know before coming into their
home, 5% reported that sometimes other people let them know before coming
into their home, and 4% never let them know.
85% reported that people let them know before coming into their bedroom, 8%
reported sometimes people let them know before coming into their room, and 8%
never let them know.
Independent Monitoring for Quality Report 2011-2012 Page 10

Are People Nice or Mean? Most people, 89% of respondents reported that their housemates are very nice or
nice.
95% of the people interviewed reported that the staff who work with them at
home are very nice or nice.
96% reported that staff who work with the respondents at work or day activity are
nice or very nice.
Nice Inbetween Mean
96%
4% 1%
95%
5% 1%
89%
9%2%
Are People Mean or Nice?Staff at Work/Day Activity (n=3011) Staff at Home (n=2112)Housemates (n=3002)
Satisfaction Scale: Based on 6 individual items, a Satisfaction Scale was developed.
Scores on the Satisfaction Scale could range from 0 to 100, with a higher score
indicating greater satisfaction.
The average (mean) score was 85.54 with a standard deviation of 19.31.
The mode (the value that occurs the most frequently) was 100, indicating that
many people were very satisfied on all measures of satisfaction
Note on Satisfaction Research
Although these percentages indicate a high level of satisfaction, this type of
research usually yields high satisfaction rates. Individuals who receive supports
and services tend to appreciate getting such services and therefore see
Independent Monitoring for Quality Report 2011-2012 Page 11

themselves as satisfied. Moreover, people with limited options may not have the
experience to know that services could be better.
Compared to the Satisfaction section of the 2010-2011 report, there were no significant
differences. The criteria established for noting comparable differences was based on a
three-point range from the previous year.
Dignity, Respect and Rights
Respondents: Only the individual receiving services/supports could answer the
questions on dignity, respect and rights. A consistency check was performed and 96
individuals’ surveys were not included in the Dignity, Respect and Rights section. The
percent of people who responded to questions in this section ranged from 34% to 65%.
Forms of Identification 62% of individuals stated that they always carry a form of identification; 18%
never do.
Support with Problems and Goals 93% always have someone to go to for help if they have a problem.
58% of individuals want help to learn new things.
78% of individuals report that they get to help other people.
Being Afraid 84% reported never being afraid at home; 14% reported sometimes being afraid
at home.
86% reported never being afraid in the neighborhood; 12% reported sometimes
being afraid in the neighborhood.
90% reported never being afraid at work, school or day activity.
Independent Monitoring for Quality Report 2011-2012 Page 12

Always Sometimes Never
2%
14%
84%
3%12%
86%
2%8%
91%
Frequency of Being AfraidAfraid at Home (n=3914) Afraid in the Neighborhood (n=4058)Afraid at Work/Day Activities (n=3491)
Legal Rights 40% of the people said they vote, 47% of the people said they do not vote and
are not interested in voting, and 13% do not vote but would like to. It is our hope
that for those individuals expressing a desire to vote, a consideration has been
written to assist the individuals in registering to vote and in voting.
Yes
No, would like to
No, not in-terested
0% 10% 20% 30% 40% 50%
40%
13%
47%
Do you Vote? (n=3895)
Percentage
Independent Monitoring for Quality Report 2011-2012 Page 13

Supports Coordination/ Qualified Intellectual Disability Professional (QIDP)
Have one person who helps get services (n=4018)
Have met with QIDP/support coordinator (n=3965)
Will always help them get what they need (n=3422)
QIDP/supports coordinator gets back right away (n=2208)
0% 20% 40% 60% 80% 100%
97%
96%
88%
82%
Supports Coordination
% responding affirmatively
97% of individuals reported that they have one person (supports
coordinator/QIDP) who helps them get the services they need.
96% reported that they have met with their supports coordinator/QIDP in the last
year.
88% of individuals reported that if they ask, their support coordinator will always
help them get what they need; 10% said their support coordinator will sometimes
help.
82% of individuals reported that when they call, their supports coordinator/QIDP
always gets back to them right away.
69% of those surveyed have been told how much money is in their annual
budget.
Two distinct scales were created to represent this section of the survey. Independent Monitoring for Quality Report 2011-2012 Page 14

Dignity and Respect Scale: The Dignity and Respect Scale included three measures
that asked whether housemates/ roommates, staff at home, and staff at work/day
activity are nice or mean. Scores on the Dignity and Respect Scale could range from 0
to 100, with a higher score indicating greater dignity and respect (people treating you as
they would wish to be treated).
The average score was 83.40 with a standard deviation of 13.89.
The modal score was 75. Interestingly, the mode for the Dignity and Respect
Scale was much lower than the Satisfaction Scale. This indicates that many
individuals chose the most positive answer category (very satisfied) for all
measures of the Satisfaction Scale, whereas for the Dignity and Respect Scale
individuals were less likely to choose the most positive answer category for all
measures.
Afraid Scale: The scale included three measures that asked individuals if they feel
afraid in their home, neighborhood, or at work/day activity. Scores on the Afraid Scale
could range from 0 to 100, with a higher score indicating less fear.
The average (mean) score was 91.91 with a standard deviation of 16.62.
The mode was 100.
The average here was quite high, and therefore there was not a great deal of
fear reported among individuals receiving supports and services. The mode of
100 indicates that many individuals (74%) reported that they never feel afraid in
their home, neighborhood or work/day activity site
Open-Ended Questions: In this section, individuals who reported being afraid at least
sometimes were asked what made them afraid. We asked this question concerning
being afraid in one’s home, neighborhood and work / day activity site.
Independent Monitoring for Quality Report 2011-2012 Page 15

At home, individuals were most afraid of the weather, followed by a fear of staff,
consumers or co-workers.
In the neighborhood, individuals were most afraid of strangers or crime.
At work, individuals were most afraid of staff, consumers, followed by a fear of
noises.
At Home#
In Neighborhood#
At Work#
Alone 28 16 1Animals / Insects 19 42 2Being Scolded / Fear of Being Hurt / People Yelling / Fear of the Unknown 14 9 5Darkness / Sleep / Nightmares / Night 38 20 4Emergency Situations / Fire / Fire Alarms
16 5 10
Falling / Sickness / Seizures/ Death 22 14 11Neighbors / Local kids 1 10 0Work/school related-Lose job/ New things on job/ Making mistakes 4 1 11Noises 28 8 20Staff / Consumers / Co-Workers 43 4 32Strangers / Crime 38 77 9Transportation/ Traffic/ Emergency vehicles
6 24 3
Weather 96 27 9Houses/ Locked Rooms/ Office/ Stairs/ Elevator/ Escalator
1 1 0
Mythical & Fictional Creatures 12 7 4Scary Movies/ Halloween / TV 11 5 1Other people/ People in general/ Crowds
2 5 6
Fighting/ Violence/ Teasing/ Behavioral Outbursts
1 13 13
Neighborhood/ Getting lost/ Being outside
0 1 1
Other 16 8 13TOTAL 396 297 155
Compared to the Dignity, Respect and Rights section of the 2010-2011 report, there
were a few significant differences. Some differences included:
There was a 3% increase in the percentage of individuals who reported
getting to help other people.
Independent Monitoring for Quality Report 2011-2012 Page 16
There was a 9% decrease in the percentage of individuals who report being
told how much money is in their annual budget.
Choice and Control
Respondents: The questions in the choice and control section were answered by the
individual receiving supports, a family member, a friend, advocate or paid staff. On the
average,
43% of the questions were answered by the individual receiving supports
28% of the questions were answered by paid staff
13% of the questions were answered by the individual and staff
8% of the questions were answered by family/friend/advocate/guardian
7% of the questions were answered by the individual and family
1% of the questions were answered by staff and family
A value of missing was assigned when individuals did not answer, gave an
unclear answer, or responded, “do not know.”
Choice and Control at Home 34% of the individuals surveyed had a key/way to get into to their house or
apartment on their own.
For 51% of the individuals, someone else chose where they live; 21% of those
interviewed chose without assistance.
For those individuals who had some control in choosing where they live, 13%
saw no other places, 45% saw one other place, and 43% saw more than one
other place before moving in.
Independent Monitoring for Quality Report 2011-2012 Page 17

I did without help
I did it with some help
Someone else chose
21%28%
51%
35%31% 34%
Who Chose Where You Live and Work?Living Arrangement (n=4232) Work/Day Activity (n=4799)
68% of the individuals did not choose their housemates.
83% of the individuals surveyed met some or all of their roommates before living
together.
82% of the individuals had their own bedroom; however, for those who shared a
bedroom, only 39% chose some or all of their roommates.
For 80% of the individuals interviewed, their mail is never opened without
permission; 13% say their mail is always opened without permission.
Independent Monitoring for Quality Report 2011-2012 Page 18

Have a key to your house/apartment
(n=6167)
Chose all or some of your housemates (n=3886)
Met all or some of your housemates (n=3688)
Have your own bedroom (n=5402)
0% 10% 20% 30% 40% 50% 60% 70% 80% 90%
34%
32%
83%
82%
Choice and Control at Home
Percentage of pos-itive responses
Choice and Control During the Day and for Leisure Time 34% of the individuals interviewed reported that someone else chose what they
do during the day
35% of the people interviewed chose what they do during the day without
assistance
For those individuals who participated in choosing what they do during the day,
13% saw no other places, 47% saw one other place, and 41% saw more than
one other place before deciding
54% of the individuals surveyed chose their daily schedules without assistance
70% chose how they spend their free time without assistance
Choice and Control in Choosing Staff 31% of the individuals interviewed/chose at least some of the staff who help them
at home (alone or with assistance from family or provider).
32% of the individuals surveyed interviewed/chose the staff who help them at
work/day activity (alone or with assistance from family or provider).
Only 21% of individuals chose their supports coordinators (alone or with
assistance from family or provider).
Independent Monitoring for Quality Report 2011-2012 Page 19

Supports Coordinator (n=5882) Staff at Work/Community Activity (n=4600)
Staff at Home (n=4391)
79%
68% 69%
15% 17% 19%
6%
15% 12%
Did You Choose the Staff Who Work With You?Someone Else Chose Chose with Help Chose Alone
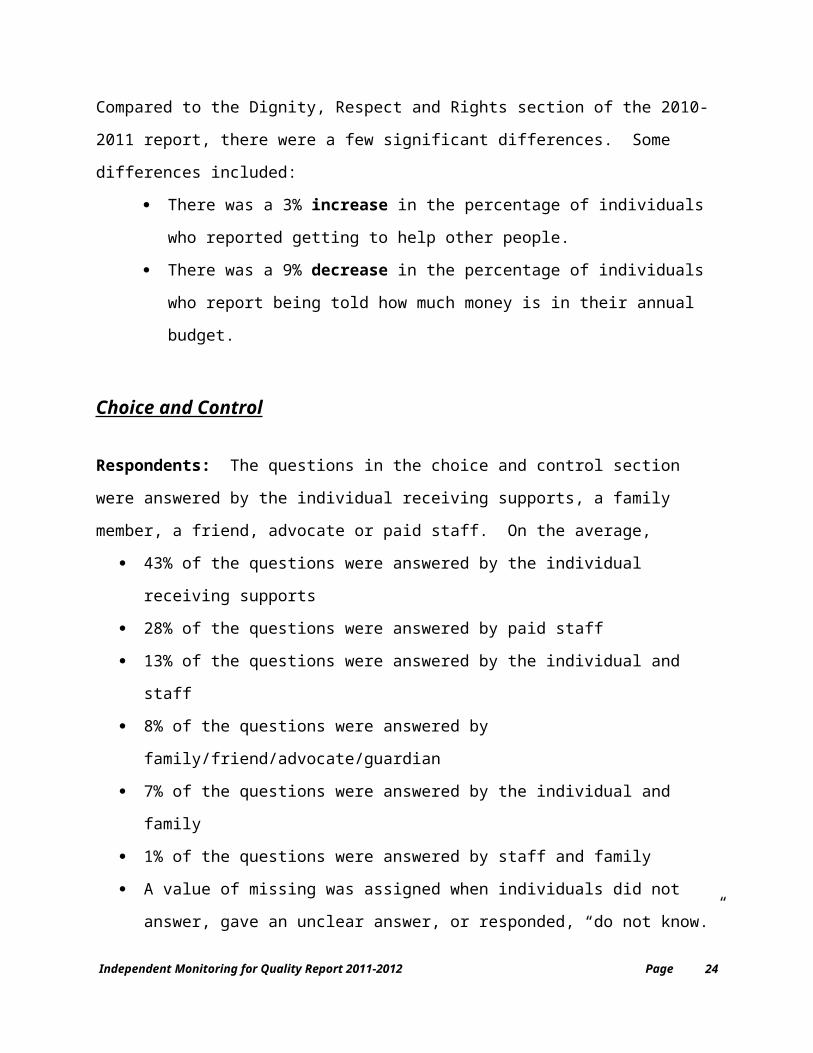
Choice and Control with Regard to Money 92% of the individuals have enough money to do many of the things they want to
do each week
61% of the individuals reported that they always choose what to buy with their
spending money
45% of the individuals reported they have a bank account that they can get to
independently to withdraw money when they want it.
Independent Monitoring for Quality Report 2011-2012 Page 20

Do you have enough money each week? (n=6032)
Do you always choose what you want to buy? (n=6283)
Do you have a bank account? (n=5627)
0% 10% 20% 30% 40% 50% 60% 70% 80% 90%100%
92%
61%
45%
Choice and Control Regarding Spending Money
Percentage of Pos-itive Responses
Access to Communication For those individuals who do not communicate using words, there is a formal
communication system in place for 28% of the people interviewed
For those people with formal communication systems in place, the systems are in
working order and utilized for 89% of the people interviewed
78% of individuals with a formal communication system reported using it across
all settings
Yes28%
No72%
If the person does not communicate verbally, is there a formal communication system in place? (n=1911)
Yes89%
No11%
If there is a formal communication system in place, is it in working order and being used? (n=457)
Independent Monitoring for Quality Report 2011-2012 Page 21

With regard to forms of communication individuals have and use, 84% have and
use cable television, 19% cell phones, 15% internet, 9% email, and 8% text
messaging.
Choice and Control Scale: The scale included twelve measures that asked individuals
about the extent to which individuals have choice and control in their lives. Scores on
the Choice and Control Scale could range from 0 to 100, with a higher score indicating
more opportunities to exert choice and control.
The average (mean) score was 48.10 with a standard deviation of 22.98.
The modal score was 52.63, indicating the most frequent score.
There were some significant differences regarding this year’s data in this section when
compared with the data from 2010-2011.
There was a 4% decrease in the percentage of individuals who reported that
someone else chose where they live.
There was a 4% decrease in the percentage of individuals who saw no other
places before they chose where they live, and a 3% increase in the amount of
individuals who reported seeing more than one place before choosing where to
live.
There was a 3% decrease in the percentage of individuals who reported
choosing all or some of their roommates.
There was a 3% decrease in the percentage of individuals who reported that
someone else chose what they do during the day.
There was a 3% increase in the percentage of individuals who reported that they
chose the staff who help them at work/day activity.
There was a 5% decrease in the percentage of individuals who reported having
a bank account where they can independently withdraw money if they want.
There was a 3% increase in the percentage of individuals who reported that if
they had a formal communication device they used it across all settings.
Employment Independent Monitoring for Quality Report 2011-2012 Page 22

Respondents: Of the 6589 individuals surveyed for the 2011-2012 Statewide IM4Q
sample, 509 respondents indicated they are employed.
Community Integrated Employment 8% (n=509) of individuals work in a community integrated setting while 92% do
not work.
The mean number of years individuals reported being competitively employed
was 8 years.
Types of Work 31% of individuals work in food services; 28% work in cleaning; 11% work in the
stock room; 8% work in assembly; 6% work in office work and 6% in
maintenance.
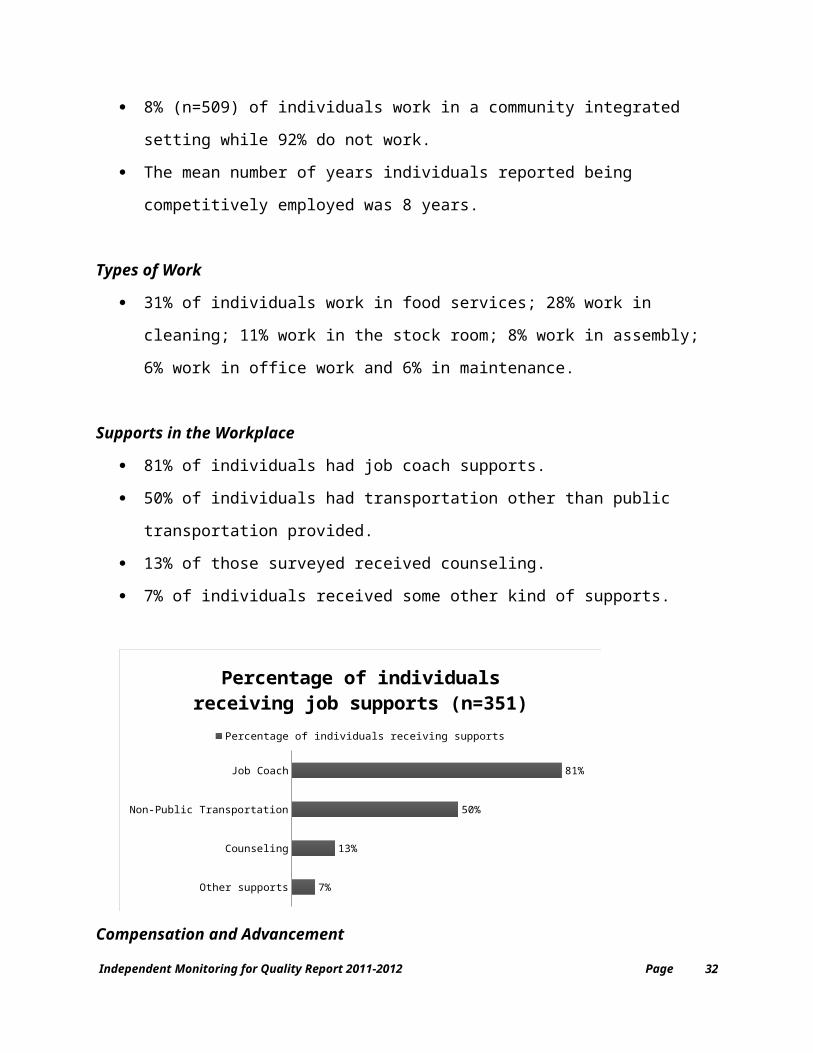
Supports in the Workplace 81% of individuals had job coach supports.
50% of individuals had transportation other than public transportation provided.
13% of those surveyed received counseling.
7% of individuals received some other kind of supports.
Other supports
Counseling
Non-Public Transportation
Job Coach
7%
13%
50%
81%
Percentage of individuals receiving job supports (n=351)
Percentage of individuals receiving supports
Compensation and Advancement
Independent Monitoring for Quality Report 2011-2012 Page 23
80% of individuals received paid time off, 32% received health insurance, 28%
received retirement benefits, and 14% received some other kind of benefit. Note:
individuals answering this question had the option to indicate more than one
response.
18% of individuals who work have been promoted.
The mean number of hours worked per week was 17 hours. Hours worked per
week ranged from 1 to 48 hours; the most common response was 20 hours per
week.
The mean hourly wage was $8.16. Hourly wage ranged from $2.42 to $20.00.
The mean yearly wage was $6,110.22. Wages earned per year ranged from
$30.00 to $28,000.00.
Other Benefits
Retirement Benefits
Health Insurance
Paid Time Off
14%
28%
32%
80%
Percentage of individuals receiving benefits (n=156)
Percentage of individuals receiving benefits
Self-employment and Supports: Of the 509 individuals who have community
integrated employment, 3% (n=13) of individuals are self-employed.
Four individuals report receiving assistance from a job coach and one individual
receive some other kind of assistance. Individuals answering this question had
the option to indicate more than one response.
Independent Monitoring for Quality Report 2011-2012 Page 24

Relationships
Respondents: The questions on relationships could be answered by the individual
receiving services/supports, a family member, a friend, or paid staff.
43% of the questions were answered by individuals receiving supports
29% were answered by paid staff
11% were answered by individuals receiving support and staff
9% were answered by family/friend/guardian/advocate
7% of the questions were answered by individuals receiving support and a
family/friend/guardian/advocate
1% of the questions were answered by staff and family
A value of missing was assigned when individuals did not answer, gave an
unclear answer, or responded, “do not know.”
Friendships 63% of people answered that they can see-talk-visit with old friends whenever
they want.
No13%
Yes, Sometmes24%Yes, Whenever I
want63%
Do you get a chance to see-talk-visit with old friends? (n= 4721)
Independent Monitoring for Quality Report 2011-2012 Page 25

Contact with Friends and Family 83% of individuals were always able to see friends whenever they wanted
89% of respondents were always able get in touch with family when they wanted
to
Always Sometimes Never
83%
15%
3%
89%
8%3%
Contact with Friends and FamilyCan you see your friends whenever you want to? (n=4903)Can you get in touch with family when you want to? (n=3704)
Inclusion
Respondents: The questions on inclusion could be answered by the individual
receiving services/supports, a family member, a friend, or paid staff. -
39% of the questions were answered by individuals receiving supports
29% were answered by paid staff
14% were answered by individuals receiving support and staff
9% were answered by family/friend/guardian/advocate
8% of the questions were answered by individuals receiving support and a
family/friend/guardian/advocate
1% of the questions were answered by staff and family
A value of missing was assigned when individuals did not answer, gave an
unclear answer, or responded, “do not know.”
Independent Monitoring for Quality Report 2011-2012 Page 26

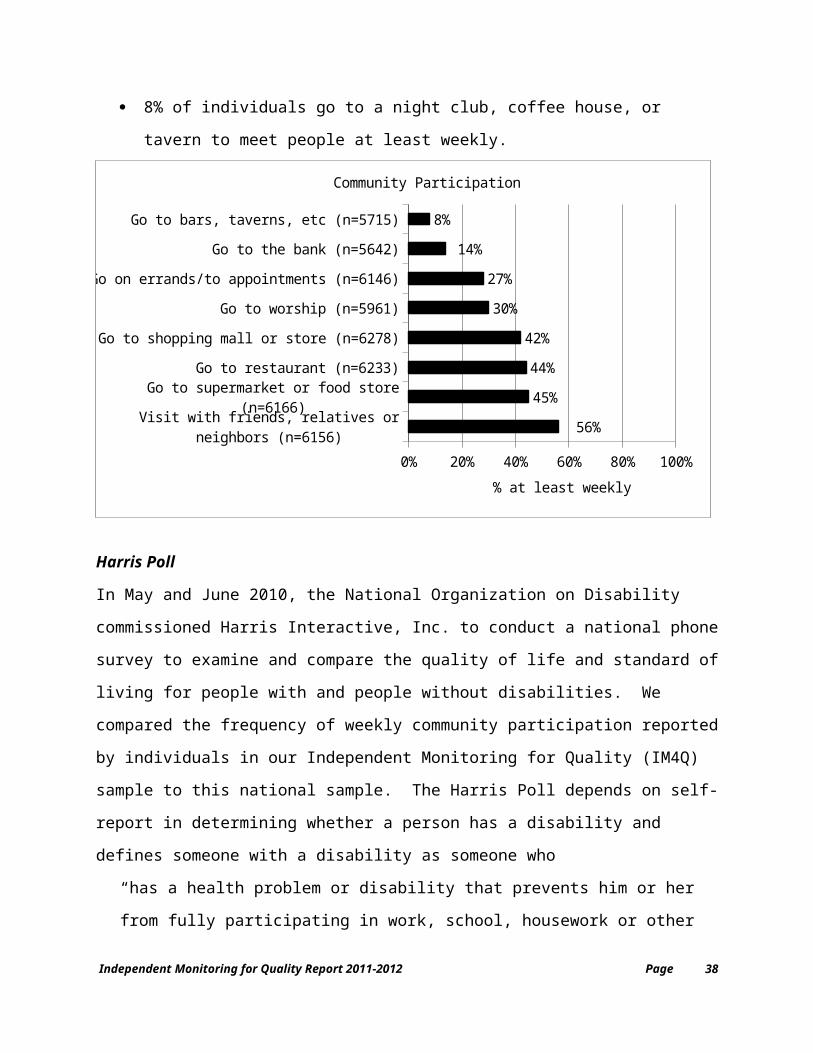
Community Participation 56% of the people visited with friends, relatives and neighbors at least weekly
45% of those surveyed went to a supermarket at least weekly
44% of respondents went to restaurants at least weekly
42% of individuals went to a shopping center or mall at least weekly
30% of respondents went to places of worship at least weekly
27% of those surveyed went out on errands or appointments at least weekly
14% of people went to the bank at least weekly.
8% of individuals go to a night club, coffee house, or tavern to meet people at
least weekly.
Visit with friends, relatives or neighbors (n=6156)
Go to supermarket or food store (n=6166)
Go to restaurant (n=6233)
Go to shopping mall or store (n=6278)
Go to worship (n=5961)
Go on errands/to appointments (n=6146)
Go to the bank (n=5642)
Go to bars, taverns, etc (n=5715)
0% 20% 40% 60% 80% 100%
56%
45%
44%
42%
30%
27%
14%
8%
Community Participation
% at least weekly
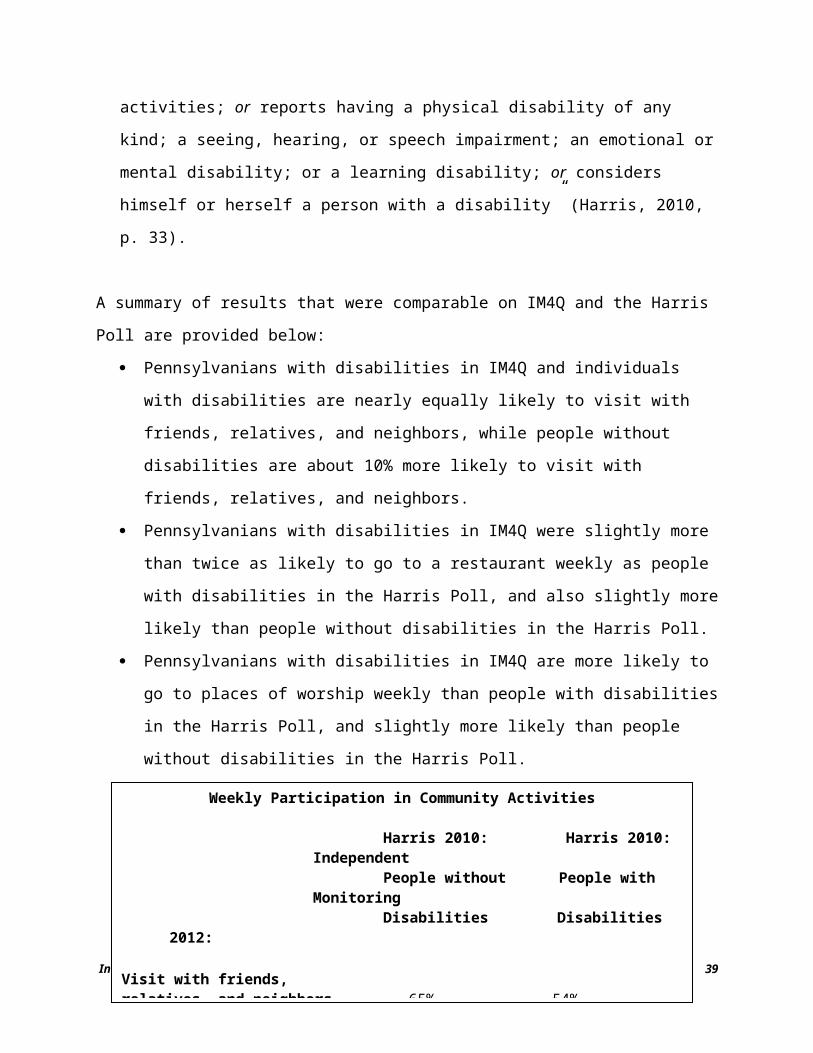
Harris PollIn May and June 2010, the National Organization on Disability commissioned Harris
Interactive, Inc. to conduct a national phone survey to examine and compare the quality
of life and standard of living for people with and people without disabilities. We
compared the frequency of weekly community participation reported by individuals in
our Independent Monitoring for Quality (IM4Q) sample to this national sample. The
Independent Monitoring for Quality Report 2011-2012 Page 27

Harris Poll depends on self-report in determining whether a person has a disability and
defines someone with a disability as someone who
“has a health problem or disability that prevents him or her from fully participating in
work, school, housework or other activities; or reports having a physical disability of
any kind; a seeing, hearing, or speech impairment; an emotional or mental disability;
or a learning disability; or considers himself or herself a person with a disability”
(Harris, 2010, p. 33).
A summary of results that were comparable on IM4Q and the Harris Poll are provided
below:
Pennsylvanians with disabilities in IM4Q and individuals with disabilities are
nearly equally likely to visit with friends, relatives, and neighbors, while people
without disabilities are about 10% more likely to visit with friends, relatives, and
neighbors.
Pennsylvanians with disabilities in IM4Q were slightly more than twice as likely to
go to a restaurant weekly as people with disabilities in the Harris Poll, and also
slightly more likely than people without disabilities in the Harris Poll.
Pennsylvanians with disabilities in IM4Q are more likely to go to places of
worship weekly than people with disabilities in the Harris Poll, and slightly more
likely than people without disabilities in the Harris Poll.
Independent Monitoring for Quality Report 2011-2012 Page
Weekly Participation in Community Activities
Harris 2010: Harris 2010: Independent People without People with Monitoring Disabilities Disabilities 2012:
Visit with friends,relatives, and neighbors 65% 54% 56% Go to restaurant 41% 20% 44%
Go to worship 28% 24% 30%
28
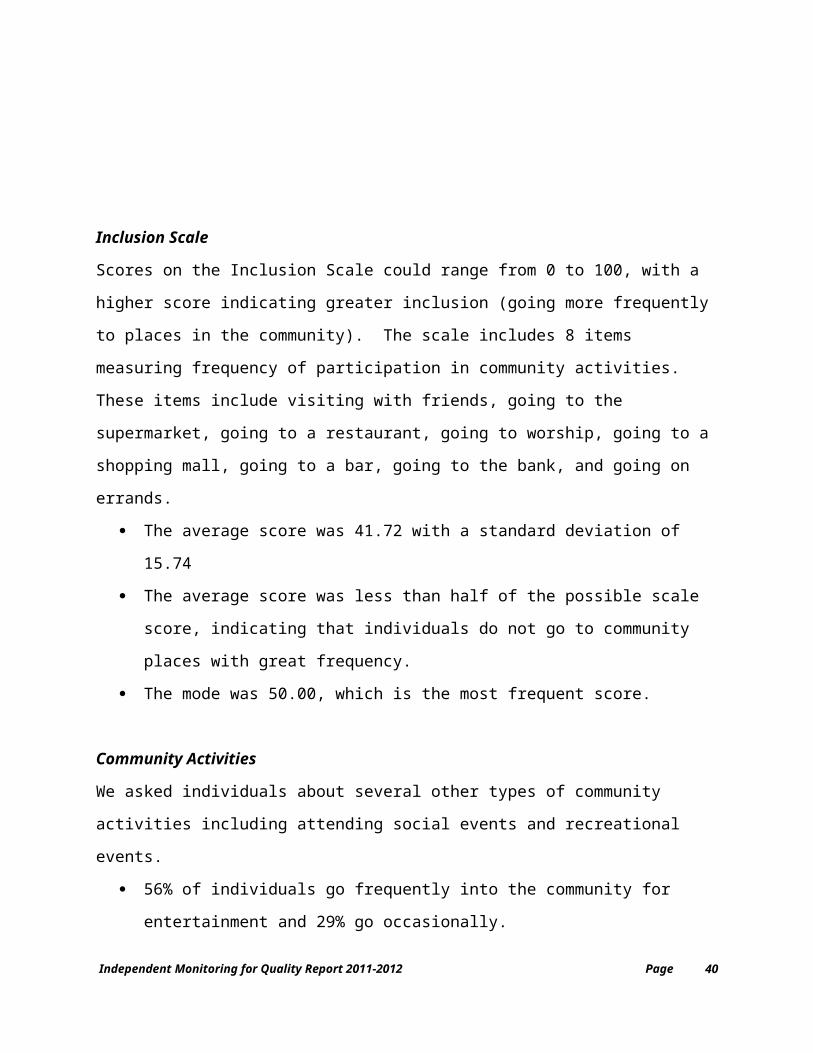
Inclusion ScaleScores on the Inclusion Scale could range from 0 to 100, with a higher score indicating
greater inclusion (going more frequently to places in the community). The scale
includes 8 items measuring frequency of participation in community activities. These
items include visiting with friends, going to the supermarket, going to a restaurant, going
to worship, going to a shopping mall, going to a bar, going to the bank, and going on
errands.
The average score was 41.72 with a standard deviation of 15.74
The average score was less than half of the possible scale score, indicating that
individuals do not go to community places with great frequency.
The mode was 50.00, which is the most frequent score.
Community ActivitiesWe asked individuals about several other types of community activities including
attending social events and recreational events.
56% of individuals go frequently into the community for entertainment and 29%
go occasionally.
32% of individuals reported that they frequently go to social events in the
community that are attended by people with and without disabilities and 45% go
occasionally.
47% of individuals went on a vacation in the past year.
Regarding monthly exercise, 40% of individuals reported never going out for
exercise, 7% exercise less than weekly, 10% exercise once a week and 43%
exercise more than once a week.
Going Out Alone or With Other People 8% of individuals go out alone; 20% go out with friends and family.
51% of individuals go out with staff or staff and other people they live with most
of the time.
Independent Monitoring for Quality Report 2011-2012 Page 29

With staff and other people Iive with
With other people live with
With staff and family
With friends and/or family
With staff
I go by myself
0% 20% 40% 60% 80% 100%
17%
2%
19%
20%
34%
8%
Most of the time, when you go into the community, who do you go with? (n=6383)
% respondents
Transportation
82% of individuals always had a way to get where they wanted to go.
Of those who cannot always get where they want to go, 28% cannot get where
they want to go because there is not enough staff.
Home Adaptive Equipment 89% of individuals reported having all the adaptive equipment they needed
81% of people said that all necessary modifications have been made to their
home to make it accessible
Yes89%
11%
Do you have all the adaptive equipment you need? (n=3565)
Yes, All81%
No19%
Have adaptations/modifications been made to the home to make it accessible? (n=2053)
This year’s responses to the items in the inclusion section of the survey yielded no
significant differences compared with the data from 2010-2011.
Independent Monitoring for Quality Report 2011-2012 Page 30

Competence, Personal Growth and Opportunities to Grow and Learn
Respondents: The Independent Monitoring Team answered the questions on
competence, personal growth, and opportunities to grow and learn after they spent time
with the individual in his/her home or other place of his/her choosing.
Low/Non-Existant13%
In Between28%
High/Very High59%
What are the caregiver's expectations regard-ing learning/growth for this individual?
(n=4636)
According to the IM4Q teams,
Caregiver expectations regarding growth were reported as being high or very
high for 59% of the individuals
When asked whether team members would want to live in the individual’s home
on a scale of 1 (“No way”) to 10 (“I’d move in tomorrow”), the average score was
6.46
Independent Monitoring for Quality Report 2011-2012 Page 31
1 2 3 4 5 6 7 8 9 10
No Way Maybe I'd move in to-
morrow
0%
10%
20%
30%
40%
50%
7%3% 4%
8% 10% 10%15%
19%
13% 11%
Would You (The Monitor) Want to Live in This Home? (n=4902) Mean = 6.46
% Respondents
Compared to the Competence, Personal Growth and Opportunities to Grow and Learn
section of the 2010-2011 report, there were no significant differences.
Independent Monitoring for Quality Report 2011-2012 Page 32

Staff Support for the Person
Respondents: The Independent Monitoring Team answered the questions on staff
support for the person, after having spent time with the person and the staff who
support them.
Number of Staff and Staff SkillAccording to the IM4Q teams,
The majority of individuals had either all staff (86%) or some staff (14%) with the
skill needed to support them.
Staff treated individuals with dignity and respect in 96% of observed situations.
84% of staff observed recognized the individuals in ways that promote independence
Compared to the Staff Support for the Person section of the 2010-2011 report, there
were no significant differences.
Independent Monitoring for Quality Report 2011-2012 Page 33

Physical Setting
Respondents: The IM4Q Team answered the following questions regarding the
physical setting, which referred to the place where the individual lives or where they go
for work/day activity. Most interviews took place in the individual’s home (73%),
although some took place at work/day activity (22%).
Home/Work/Day Activity Repair Monitors observed that individuals lived in homes or went to work/day activities
which were in good repair on the outside (95%) and on the inside (94%).
NeighborhoodAccording to IM4Q teams,
Individuals lived in homes or went to work/day activities which were in a safe
neighborhood (93%)
Individuals lived in homes that “fit in” with the neighborhood in which they were
located (92%)
Personal Belongings and PersonalitiesAccording to IM4Q teams,
Most individuals (98%) lived in homes which had sufficient space for personal
belongings
Individuals (66%) lived in homes which reflected the hobbies, interests and
personalities of the people who live there; for 30% of people only their bedroom
reflected their personalities and interests.
Physical Setting Scale: Based on the three individual items, a Physical Setting Scale
(based on the place where the individual lives) was developed. Scores on the Physical
Setting Scale could range from 0 to 100, with a higher score indicating a nicer setting.
The average (mean) score was 96.56 with a standard deviation of 11.54.
Independent Monitoring for Quality Report 2011-2012 Page 34

The mode (the value that occurs the most frequently) was 100, indicating that
many people (89%) lived in homes which were at the top of the scale on all
measures of the physical setting
Compared to the Physical Setting section of the 2010-2011 report, there was a
significant difference.
There was a 3% increase in the percentage of caregivers whose expectations
regarding client growth was reported as high/very high
There was a 3% increase in the percentage of IM4Q staff reporting that staff had
some of the skills needed to support them
There was a 3% decrease in the percentage of IM4Q staff who observed staff
recognizing individuals in a way that promotes independence
There was a 6% increase in the percentage of individuals who reported living in
homes that reflected their hobbies, interests, and personalities, while there was a
5% decrease in the percentage of individuals who reported that only their
bedrooms reflected their personalities and interests.
Independent Monitoring for Quality Report 2011-2012 Page 35

Family/Friend/Guardian Survey
Respondents: This survey was completed by telephone or face-to-face with a family
member, guardian, or friend who was identified through the Essential Data Elements
Pre-Survey. In the event that a phone or face-to-face survey could not be completed,
surveys were completed by mail. Surveys were completed for 2517 family members,
friends, and guardians.
70% of the surveys were answered by parents
19% were answered by siblings
2% were answered by the guardian
5% were answered by another relative (spouse, aunt, uncle, cousin,
grandparent)
5% were answered by persons with other relationships to the individual receiving
supports.
Less than one percent of surveys were answered by friends.
Satisfaction 95% of the families surveyed were either somewhat satisfied or very satisfied
with where their relative lives.
91% were either somewhat satisfied or very satisfied with what their relative does
during the day.
Very Satisfied Somewhat Satisfied Neutral Somewhat Dissat -isfied
Very Dissatisfied
84%
11%3% 1% 1%
75%
16%
5% 3% 2%
Satisfaction with Relative's Home and Work/Day Activity
Satisfaction with where relative is living (n=2480)Satisfaction with what relative does during the day (n=2271)
Independent Monitoring for Quality Report 2011-2012 Page 36

95% of the families surveyed were either somewhat satisfied or very satisfied
with their relatives’ staff at home
96% of the families surveyed were either somewhat satisfied or very satisfied
with the staff at their relatives’ day activity
Very Satisfied Somewhat Satisfied Neutral Somewhat Dissat -isfied
Very Dissatisfied
80%
15%
3% 2% 1%
84%
11%3% 1% 1%
Satisfaction with Relative's StaffSatisfaction with relatives's staff at home (n=1482)Satisfaction with relatives's staff at day activity (n=1884)
How Often Do You Contact/See Your Relative? 86% of the family/friend/guardians contacted their relative at least monthly; 4%
have not contacted their relative in the past year.
77% of the family/friend/guardians were able to see their relative (family’s home,
individual’s home, or on an outing) at least once a month; 3% did not get to see
their relative in the past year.
Your Relative’s Satisfaction 95% of respondents felt their relative was either very satisfied or satisfied with
his/her living situation; 92% felt their relative was either very satisfied or satisfied
with what they do during the day.
Independent Monitoring for Quality Report 2011-2012 Page 37
Very Satisfied Satisfied Neutral Dissatisfied Very Dissatisfied
76%
19%
3% 2% 0%
69%
23%
6%2% 1%
Relative's Satisfaction at Home and at WorkRelative's Satisfaction with living situation (n=2445) Relative's Satisfaction with day activity (n=2239)
96% of relatives felt their relative was either very satisfied or satisfied with the
staff who support them at home; 1% believed their relative was either dissatisfied
or very dissatisfied.
97% of respondents felt their relative was either very satisfied or satisfied with
the staff who support them at work (or during the day); 1% believed their relative
was either dissatisfied or very dissatisfied.
Your Relative’s Safety Respondents said that their relative felt safe in their
community/home/neighborhood always (86%) or most of the time (12%).
Your Relative’s Opportunities 87% of the respondents said that their relative had enough opportunities to
participate in activities in the community.
89% of the respondents said that their relative seemed to have the opportunity to
learn new things.
Independent Monitoring for Quality Report 2011-2012 Page 38
Your Relative’s Staff If their relative did not communicate verbally, 33% of the respondents said that
there is a formal communication system in place for their relative and they use it
and for 57% the communication system is used across all settings.
If something changed in their relative’s life, 56% reported they would contact a
relative; 51% would contact the supports coordinator; and 41% would contact
agency staff.
91% of the respondents said that their relative’s home appeared to have an
adequate number of paid staff.
95% of the respondents said that staff in their relative’s home always treat people
with dignity and respect.
87% of the respondents said that all staff appear to have the skills they need to
support their relative; 11% felt that way about only some staff.
Relative’s Supports 86% of relatives were satisfied with the supports coordination their relative
receives.
62% of relatives reported that they were told how much money is in their
relative’s annual budget.
77% said that their relative always received the supports they needed.
89% of relatives always felt that the staff who assisted them with planning
respected their choices and opinions.
65% of relatives never felt that frequent changes in support staff were a problem
for their family member.
32% of relatives always got to choose the agency/provider who worked with their
relative; 6% had their relative choose; 19% chose with their relative; 43% never
got to choose.
70% of relatives were familiar with the way complaints and grievances are
handled; 30% were not familiar.
Independent Monitoring for Quality Report 2011-2012 Page 39
Family Satisfaction Scale: Based on the eight individual items, a Family Satisfaction
Scale was developed. Scores on the Family Satisfaction Scale could range from 0 to
100, with a higher score indicating greater family satisfaction.
The average (mean) score was 91.75 with a standard deviation of 12.20.
The mode (the value that occurs the most frequently) was 100, indicating that
many of the families’ (47%) satisfaction levels were at the top of the scale on all
measures of family satisfaction
Compared to the Family/Friend/Guardian section of the 2010-2011 report, there were
several significant differences.
There was a 4% increase in the percentage of individuals who use a formal
communication device in all settings if one is required.
There was a 3% increase in the percentage of relatives who were told how much
is in their annual budget
There was a 4% increase in the percentage of relatives who never felt frequent
changes in support staff were a problem.
There was a 3% decrease in the percentage of relatives who never got to
choose the agency/provider that worked with their family member.
Independent Monitoring for Quality Report 2011-2012 Page 40

Summary
This report presents information collected through face-to-face interviews with 6589
individuals receiving supports through the Office of Developmental Programs.
Overall, individuals report high levels of satisfaction with where they live, where they
work, and with who provides supports to them at home and during the day. The
majority of individuals report having friends and have high levels of privacy.
The majority of individuals report that they get the services and supports they need to
be able to live in their homes. Approximately three fifths of all individuals and families
report that they were told how much money is in their annual budget, a 9% decrease in
the number of individuals who were told how much money is in their annual budget
from last year’s survey. The monitoring teams observed that staff treat individuals with
dignity and respect in nearly all situations.
The data continue to indicate that few individuals make choices without assistance with
regard to where they live and with whom they live. More than two thirds of the
individuals interviewed do not have a key or a way to get into their homes.
For those individuals who do not communicate using words, there continues to be
issues around lack of exploration of alternative strategies. Most individuals (nearly
three quarters) that do not communicate using words do not have a communication
system in place. When it has been explored and people have acquired systems
including devices, individuals have devices that are not in working order and that are not
being used across all settings.
Less than one in ten individuals surveyed are employed. Individuals who are employed
commonly work in food service, cleaning, or stock room positions. Most individuals who
are employed work about 20 hours a week and make slightly more than federal
minimum wage.
Independent Monitoring for Quality Report 2011-2012 Page 41

Less than half of the people interviewed participate in community activities (i.e. going
shopping) on a weekly basis. The percentage of individuals with disabilities
participating in community events continues to be lower than the comparison group of
people without disabilities, with the exception of going to the shopping mall.
The majority of individuals can always get where they want to go; however, some
individuals cannot always get where they want to go due to there not being enough
staff. Of those individuals who do not use public transportation, the main reason is
because it does not exist where they live.
Independent Monitoring for Quality Report 2011-2012 Page 42