Embed Size (px)
Citation preview
1
INTRODUCTION
The key to traffic engineering is having current, reliable data. One of the most useful
data collection techniques is the spot speed and volume study. Speed and volume are important
considerations in traffic engineering because they relay information about safety, comfort, road
usage, efficiency, and economics. Having speed and volume data for a particular roadway allows
traffic engineers to determine existing traffic operations and evaluate traffic control devices such
as speed limits, stop signs, and intersections, establish roadway design elements such as proper
sight distances and geometric properties of the roadway, assess roadway safety concerns, and
measure the effectiveness of the current system.
Spot speed and volume studies can be done in a number of ways, as simple as standing
by the road with a stopwatch, and as complex as satellite imagery. However it is performed, the
purpose of a spot speed and volume study is to count the number of cars and determine each
car’s speed at a particular section of roadway. To ensure a “representative weekday”, AASHTO
(American Association of State Highway and Transportation Officials) recommends that studies
be conducted on Tuesday, Wednesday, and Thursday, on days without extreme temperatures or
precipitation, as these tend to change the way drivers make decisions.
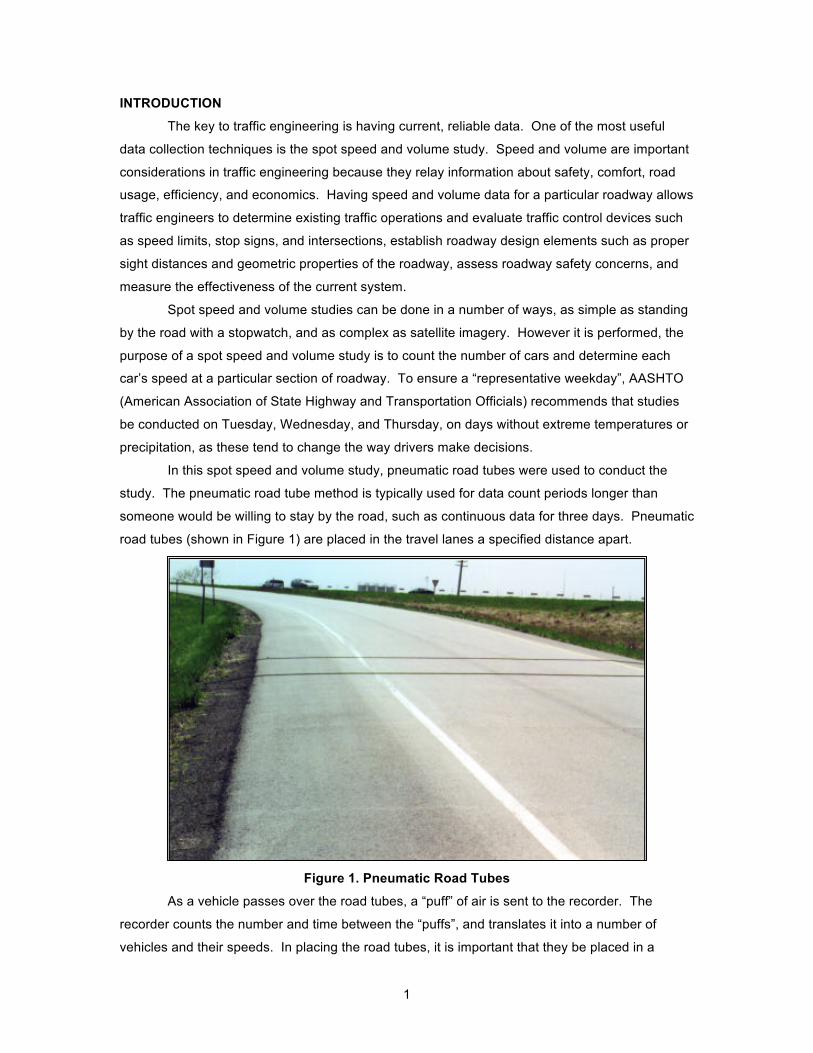
In this spot speed and volume study, pneumatic road tubes were used to conduct the
study. The pneumatic road tube method is typically used for data count periods longer than
someone would be willing to stay by the road, such as continuous data for three days. Pneumatic
road tubes (shown in Figure 1) are placed in the travel lanes a specified distance apart.
Figure 1. Pneumatic Road Tubes
As a vehicle passes over the road tubes, a “puff” of air is sent to the recorder. The
recorder counts the number and time between the “puffs”, and translates it into a number of
vehicles and their speeds. In placing the road tubes, it is important that they be placed in a

2
segment of the roadway that has representative speeds, and no stopping. For example, placing
a road tube where a vehicle could park on it, or next to a stop sign where a vehicle is accelerating
or decelerating will give poor, unreliable data.
The data can then be downloaded from the recorder onto a computer, where a statistical
analysis can be performed on the data. Some useful statistical analyses for both volume and
speed data are measures of central tendency, which include the arithmetic mean, median, and
mode, measures of dispersion, which include variance, standard deviation, and the coefficient of
variation, as well as identifying peak periods and the 50th and 85th percentile speeds.
PRELIMINARY INFORMATION
The street chosen for this spot speed and volume study is Patterson Street, between Central
Avenue and Southern Avenue, on the University of Memphis campus. Patterson Street is shown
highlighted in Figure 2.
Figure 2. Patterson Street

3
The data was continuously collected from 12:00AM on Tuesday, September 13, 2011 to
12:00AM on Friday, September 16, 2011. The weather data for September 13 through
September 15, 2011 are shown in the following table.
Table 1. Weather Data for September 13 – September 15, 2011
Day Mean Temperature (°F)
Min. Temperature (°F)
Max. Temperature (°F)
Precipitation (in.)
9/13/11 81 64 95 0.00
9/14/11 80.4 68 95 0.00
9/15/11 65.5 59 86 0.02
The weather data show that the count period did not include extreme temperatures or significant
precipitation, so it can be concluded that the count can be used as a representative weekday.
VOLUME STUDY
The following figures show the hourly volume counts for each of the three count days.
Figure 3. Tuesday 9/13/11 Hourly Volume
0 100 200 300 400 500 600 700 800
12:0
0 A
M
1:00
AM
2:
00 A
M
3:00
AM
4:
00 A
M
5:00
AM
6:
00 A
M
7:00
AM
8:
00 A
M
9:00
AM
10
:00
AM
11
:00
AM
12
:00
PM
1:
00 P
M
2:00
PM
3:
00 P
M
4:00
PM
5:
00 P
M
6:00
PM
7:
00 P
M
8:00
PM
9:
00 P
M
10:0
0 P
M
11:0
0 P
M
9/13/11 Hourly Volume

4
Figure 4. Wednesday 9/14/11 Hourly Volume
Figure 5. Thursday 9/15/11 Hourly Volume
Since each of the three days have consistent volume data, an hourly average of the three-day
count period was taken to simulate a representative weekday. The representative weekday traffic
count is shown in Table 2 and Figure 6.
0
100
200
300
400
500
600
700
800
12:0
0 A
M
1:00
AM
2:
00 A
M
3:00
AM
4:
00 A
M
5:00
AM
6:
00 A
M
7:00
AM
8:
00 A
M
9:00
AM
10
:00
AM
11
:00
AM
12
:00
PM
1:
00 P
M
2:00
PM
3:
00 P
M
4:00
PM
5:
00 P
M
6:00
PM
7:
00 P
M
8:00
PM
9:
00 P
M
10:0
0 P
M
11:0
0 P
M
9/14/11 Hourly Volume
0
100
200
300
400
500
600
700
800
12:0
0 A
M
1:00
AM
2:
00 A
M
3:00
AM
4:
00 A
M
5:00
AM
6:
00 A
M
7:00
AM
8:
00 A
M
9:00
AM
10
:00
AM
11
:00
AM
12
:00
PM
1:
00 P
M
2:00
PM
3:
00 P
M
4:00
PM
5:
00 P
M
6:00
PM
7:
00 P
M
8:00
PM
9:
00 P
M
10:0
0 P
M
11:0
0 P
M
9/15/11 Hourly Volume

5
Table 2. Representative Weekday Hourly Volume
12:00 AM 109 12:00 PM 623
1:00 AM 49 1:00 PM 546
2:00 AM 55 2:00 PM 690
3:00 AM 27 3:00 PM 589
4:00 AM 23 4:00 PM 667
5:00 AM 45 5:00 PM 626
6:00 AM 127 6:00 PM 506
7:00 AM 470 7:00 PM 467
8:00 AM 461 8:00 PM 436
9:00 AM 566 9:00 PM 321
10:00 AM 429 10:00 PM 284
11:00 AM 562 11:00 PM 185
Figure 6. Representative Weekday Hourly Volume
From this data for a representative weekday, the following data can be determined for the
roadway.
Table 3. Representative Weekday Volume Data
ADT (Average Daily Traffic) Peak Period
369 veh/hr 4:00PM – 6:00 PM
0
100
200
300
400
500
600
700
12:0
0 A
M
1:00
AM
2:
00 A
M
3:00
AM
4:
00 A
M
5:00
AM
6:
00 A
M
7:00
AM
8:
00 A
M
9:00
AM
10
:00
AM
11
:00
AM
12
:00
PM
1:
00 P
M
2:00
PM
3:
00 P
M
4:00
PM
5:
00 P
M
6:00
PM
7:
00 P
M
8:00
PM
9:
00 P
M
10:0
0 P
M
11:0
0 P
M
Representative Weekday Hourly Volume

6
The ADT is simply an average of the hourly traffic volumes. To ensure that this ADT is a
good measure of the daily traffic for the three days, the standard deviation and coefficient of
variance is shown in Table 4.
Table 4. Statistical Treatment of ADT
9/13/11 ADT 374 veh/hr
9/14/11 ADT 372 veh/hr
9/15/11 ADT 363 veh/hr
Mean ADT 369 veh/hr
Standard Deviation 5.86
Coefficient of Variance 1.6%
The low coefficient of variance shows that the data is consistent over the sample space.
However, a sample size of more than three days would give a better representation of the ADT.
Since Patterson is located on a university campus, this ADT is most likely only accurate for the
semester in which it is obtained, and would differ greatly from an ADT obtained during the
summer.
The peak period was calculated by summing two consecutive hourly volumes from the
representative weekday and taking the largest value as the peak period. A graph of the two-hour
period volumes is shown in Figure 8.
Figure 7. Two-Hour Period Volumes
0
200
400
600
800
1000
1200
1400
11:0
0PM
- 1:
00A
M
12:0
0AM
- 2:
00A
M
1:00
AM
- 3:
00A
M
2:00
AM
-4:0
0AM
3:
00A
M-5
:00A
M
4:00
AM
-6:0
0AM
5:
00A
M-7
:00A
M
6:00
AM
-8:0
0AM
7:
00A
M-9
:00A
M
8:00
AM
-10:
00A
M
9:00
AM
-11:
00A
M
10:0
0AM
-12:
00P
M
11:0
0AM
-1:0
0PM
12
:00P
M-2
:00P
M
1:00
PM
-3:0
0PM
2:
00P
M-4
:00P
M
3:00
PM
-5:0
0PM
4:
00P
M-6
:00P
M
5:00
PM
-7:0
0PM
6:
00P
M-8
:00P
M
7:00
PM
-9:0
0PM
8:
00P
M-1
0:00
PM
9:
00P
M-1
1:00
PM
10
:00P
M-1
2:00
PM
Two-Hour Period Volumes

7
The peak period is between 4:00PM and 6:00PM, but the volume is consistent from
2:00PM until 6:00PM, which could be used as the peak period. A graph comparing the
representative data from our street and a typical street are shown in Figure 8.
Figure 8. Hourly Volume Comparison of Patterson and Typical Street
As shown in Figure 9, a typical street has two peak periods, one from 7:00AM-9:00AM,
and another from 4:00PM-6:00PM. These correspond with work schedules. Most workdays start
at 8:00AM or 9:00AM and end at 4:00PM or 5:00PM. Patterson Street however has a gradual
increase in volume in the morning hours, and has fairly consistent volumes throughout the
afternoon. This is because Patterson’s primary usage is by students at the University of
Memphis. Some classes on campus begin as early as 7:00AM, while some students may not
have their first class until 5:30PM. The same goes for leaving times – some students may be
done with classes and leave campus at 10:00AM, while others may stay until midnight or later
studying. Due to the large number of young people on campus, Patterson will also have higher
volumes late at night than a typical street.
SPEED STUDY
Since it was determined that the three data collection days could be averaged to simulate
a representative weekday, the speed study uses data averaged from the three days. Histograms
of the speeds on Patterson are shown in Figures 9 through 12.
0
100
200
300
400
500
600
700
800 12
:00
AM
1:
00 A
M
2:00
AM
3:
00 A
M
4:00
AM
5:
00 A
M
6:00
AM
7:
00 A
M
8:00
AM
9:
00 A
M
10:0
0 A
M
11:0
0 A
M
12:0
0 P
M
1:00
PM
2:
00 P
M
3:00
PM
4:
00 P
M
5:00
PM
6:
00 P
M
7:00
PM
8:
00 P
M
9:00
PM
10
:00
PM
11
:00
PM
Patterson
Typical

8
Figure 9. AM Southbound Speeds
Figure 10. AM Northbound Speeds
0
20
40
60
80
100
120
AM Southbound Speeds
<16
16 - 20
21 - 25
26 - 30
31 - 35
36 - 40
0
20
40
60
80
100
120
AM Northbound Speeds
<16
16 - 20
21 - 25
26 - 30
31 - 35
36 - 40
41 - 45
46 - 50

9
Figure 11. PM Southbound Speeds
Figure 12. PM Northbound Speeds
This data gives us a few interesting conclusions. First, it should be noted that the
northbound drivers drive faster than the southbound drivers. The southbound drivers mainly fall
into the 16-20mph and 21-25 mph ranges, while the northbound drivers mainly fall into the 21-
0
20
40
60
80
100
120
140
160
PM Southbound Speeds
<16
16 - 20
21 - 25
26 - 30
31 - 35
0
20
40
60
80
100
120
140
PM Northbound Speeds
<16
16 - 20
21 - 25
26 - 30
31 - 35
36 - 40
41 - 45
46 - 50
51 - 55

10
25mph and 26-30mph ranges. This is a surprising fact, because the northbound traffic volumes
are higher than the southbound traffic volumes, as shown in Table 5.
Table 5. Northbound and Southbound Representative Daily Traffic Volume
Northbound Southbound
4599 veh 4266 veh
The following figure shows a summary of the spot speed study. The values used are a
summation of the number of vehicles in a certain speed range for the entire representative day.
Figure 13. Summary of Spot Speed Study
From inspection, it appears that the speed data for both Northbound and Southbound
speeds are skewed right. To verify the central tendency of the graph, the mean speed, median
speed, and modal speed are shown in Table 6.
Table 6. Measures of Central Tendency for Speeds
Northbound Southbound
Mean Speed (mph) 25 19
Median Speed (mph) 28 18
Modal Speed (mph) 28 23
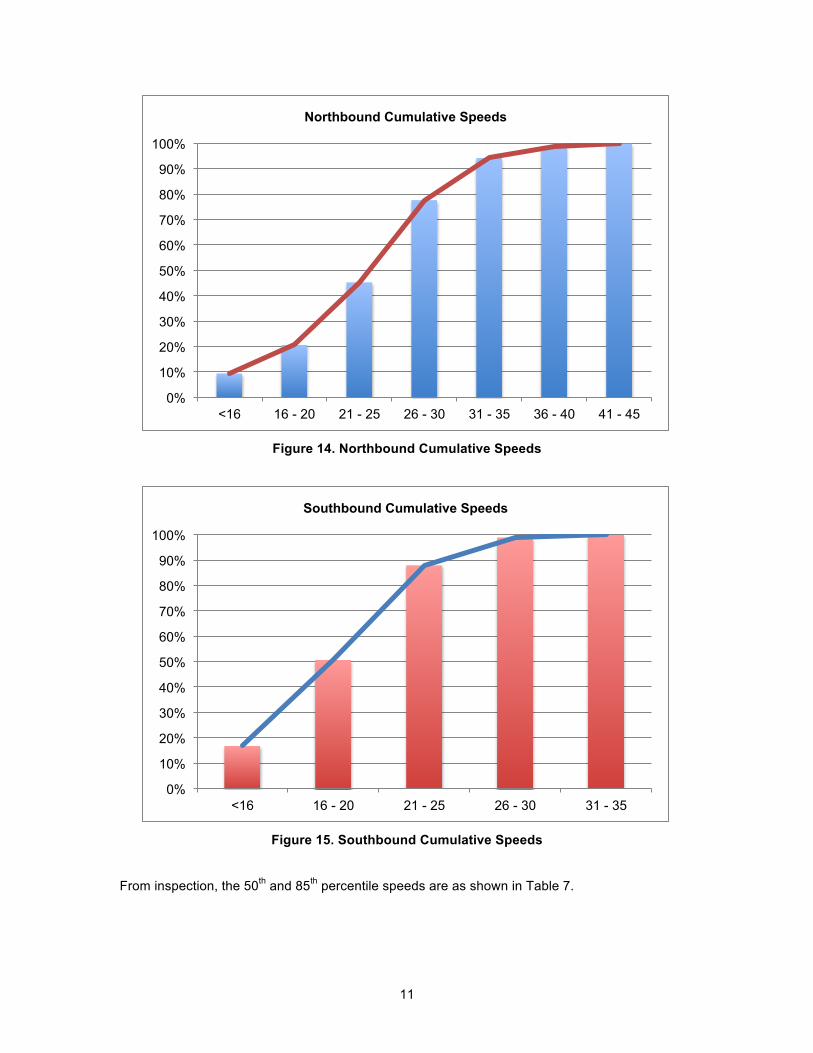
Lastly, the 50th and 85th percentile speeds are calculated for Northbound and Southbound traffic.
0
200
400
600
800
1000
1200
1400
1600
1800
<16 16 - 20
21 - 25
26 - 30
31 - 35
36 - 40
41 - 45
46 - 50
51 - 55
Northbound
Southbound
11
Figure 14. Northbound Cumulative Speeds
Figure 15. Southbound Cumulative Speeds
From inspection, the 50th and 85th percentile speeds are as shown in Table 7.
0%
10%
20%
30%
40%
50%
60%
70%
80%
90%
100%
<16 16 - 20 21 - 25 26 - 30 31 - 35 36 - 40 41 - 45
Northbound Cumulative Speeds
0%
10%
20%
30%
40%
50%
60%
70%
80%
90%
100%
<16 16 - 20 21 - 25 26 - 30 31 - 35
Southbound Cumulative Speeds

12
Table 7. 50th and 85th Percentile Speeds
Northbound Southbound
50th Percentile Speed (mph) 25 18
85th Percentile Speed (mph) 30 23
DISCUSSION AND CONCLUSION
The following observations are a summary of the findings of the statistics.
• Patterson Street has an atypical volume distribution. Instead of peak periods between
7:00AM-9:00AM and 4:00PM-6:00PM, Patterson’s volume gradually increases in the
morning hours, remains fairly constant in the afternoon, and gradually decreases until
1:00AM. This is due to its location on the University of Memphis campus, and it is
dependent on students’ varying class schedules, and the higher number of young people.
• Northbound traffic has higher speeds than southbound traffic, even though there is a
higher northbound volume.
For a street on a college campus, the ideal street would have low speeds and low volumes,
since there are likely to be a lot of pedestrian and bicycle activity. The 85th percentile speed for
Northbound traffic is 30mph, and the 85th percentile speed for Southbound traffic is 23mph. Both
of these values are reasonable for a college campus. However, the traffic volumes are a
potential concern. The representative hourly volume for 2:00PM is 690 veh/hr.
The next step in applying this data to evaluate the efficiency of the current system would be
to compare the values given for other college campuses, and what systems other universities
have used to lower speeds and traffic volumes. If the comparison yields that the data for
Patterson Street are indeed high, then the data can be applied to design solutions.