Embed Size (px)
Citation preview

Introduction Part

Contents
Tourism development in the world
Tourism development in China
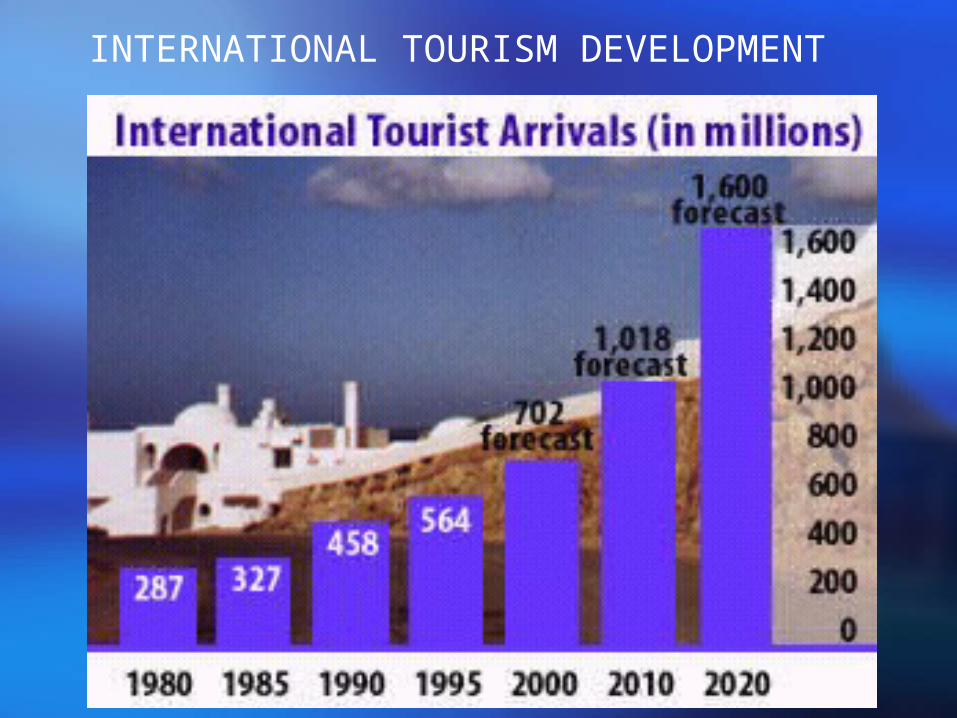
INTERNATIONAL TOURISM DEVELOPMENT
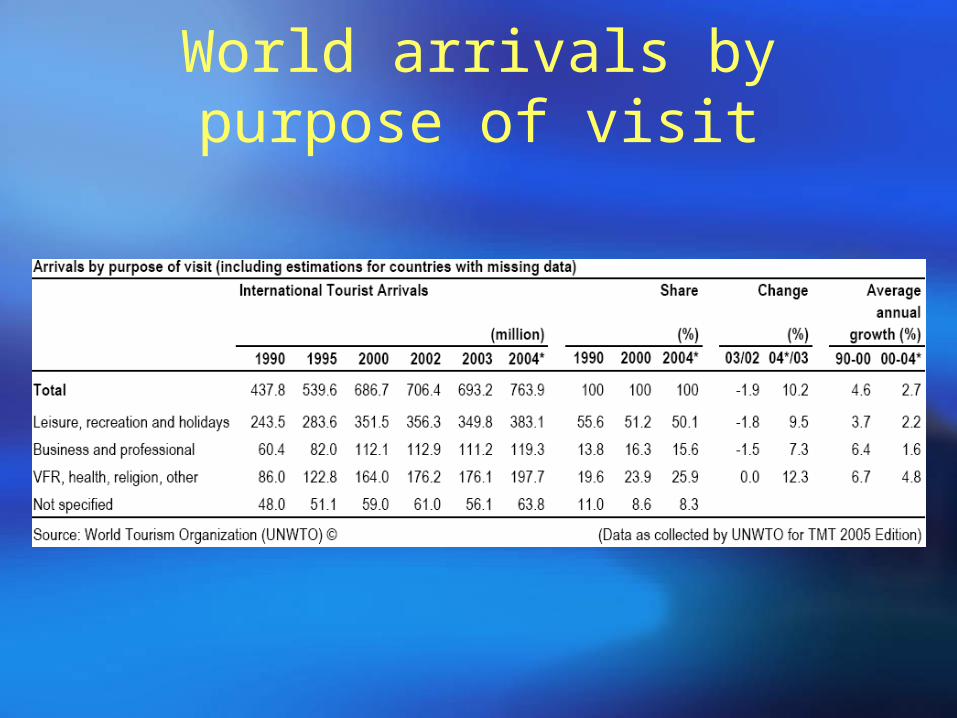
World arrivals by purpose of visit
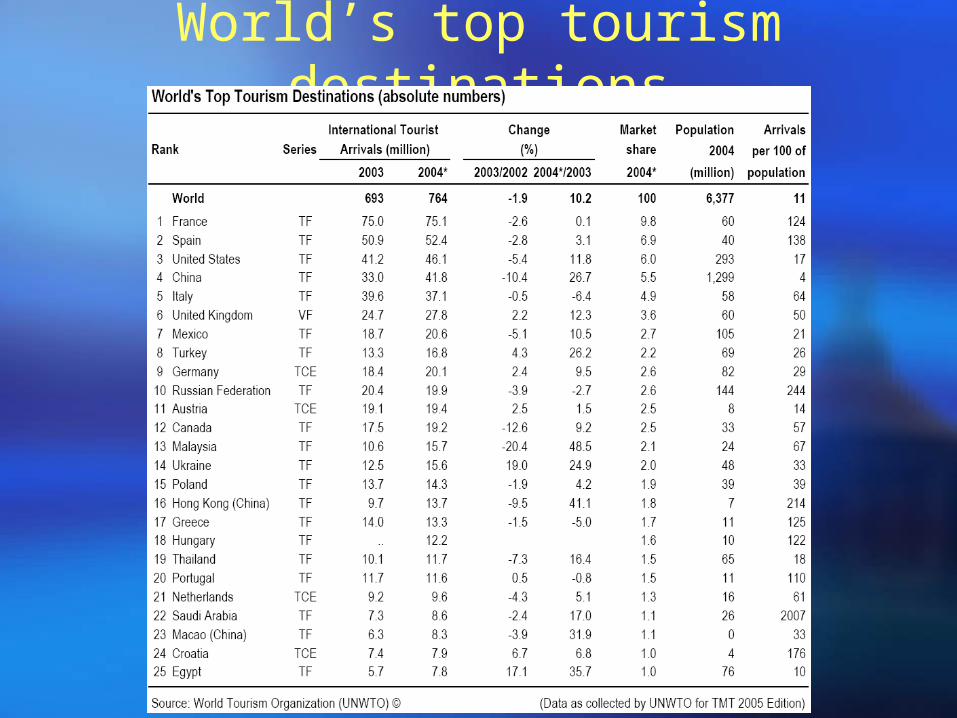
World’s top tourism destinations
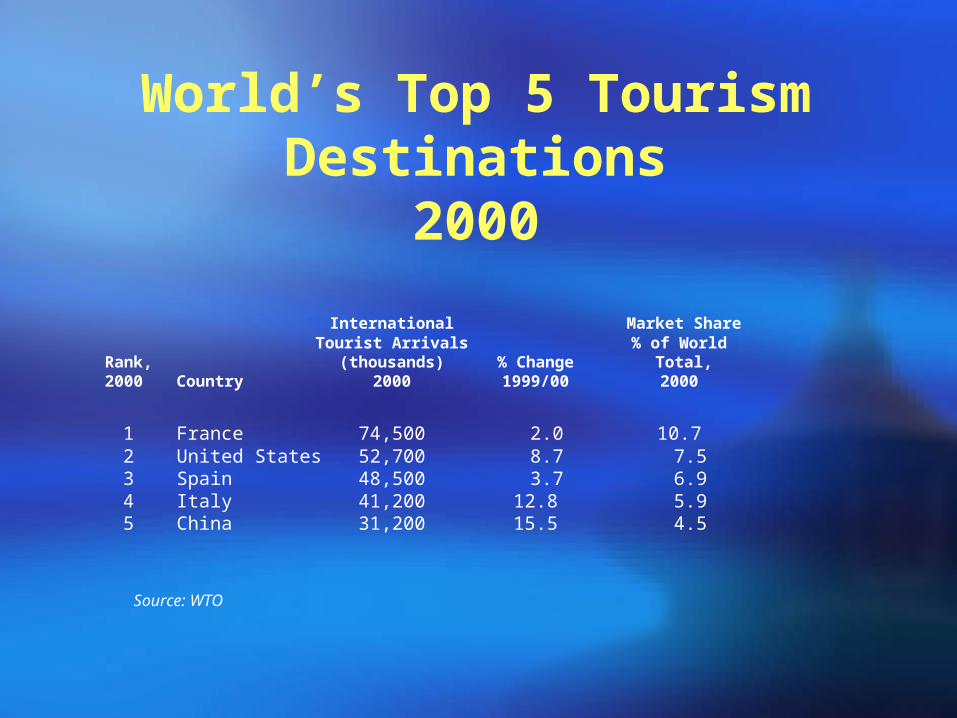
World’s Top 5 Tourism Destinations
2000
International Market ShareTourist Arrivals % of World
Rank, (thousands) % Change Total,2000 Country 2000 1999/00 2000
1 France 74,500 2.0 10.72 United States 52,700 8.7 7.53 Spain 48,500 3.7 6.94 Italy 41,200 12.8 5.95 China 31,200 15.5 4.5
Source: WTO
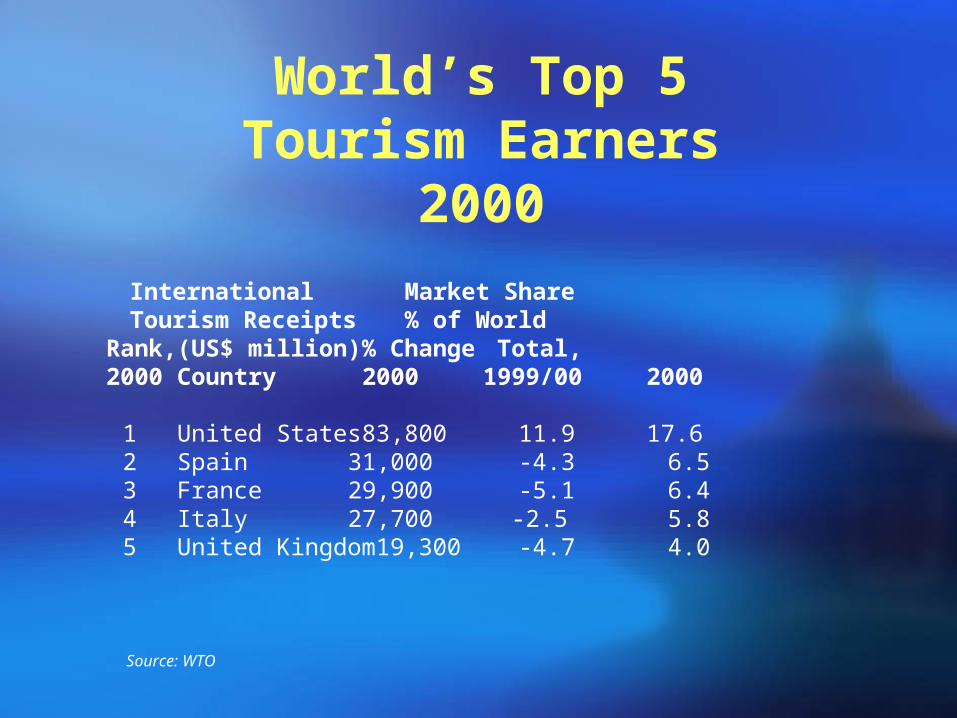
World’s Top 5Tourism Earners
2000
International Market ShareTourism Receipts % of World
Rank, (US$ million) % Change Total,2000 Country 2000 1999/00 2000
1 United States 83,800 11.9 17.62 Spain 31,000 -4.3 6.53 France 29,900 -5.1 6.44 Italy 27,700 -2.5 5.85 United Kingdom 19,300 -4.7 4.0
Source: WTO

Travel and Tourism will continue to expand faster than the economy as a whole and faster than comparable industries.
By 2011 Travel & Tourism is expected to account for:
*Over twice the output at $7.0 trillion *More jobs --- 260 million employees
Growth depends on enlightened government policy
Travel and Tourism CanDouble in Size by 2011
Source: WTTC

CHINA TOURISM DEVELOPMENT
( 1 ) Inbound Tourism The mode of China’s tourism development
is quite different from that in most of the development countries in the world.
For political and economic purposes, China started its tourism activities based on inbound travel only. As a developing country, China gives priority to inbound tourism for its foreign exchange earnings.
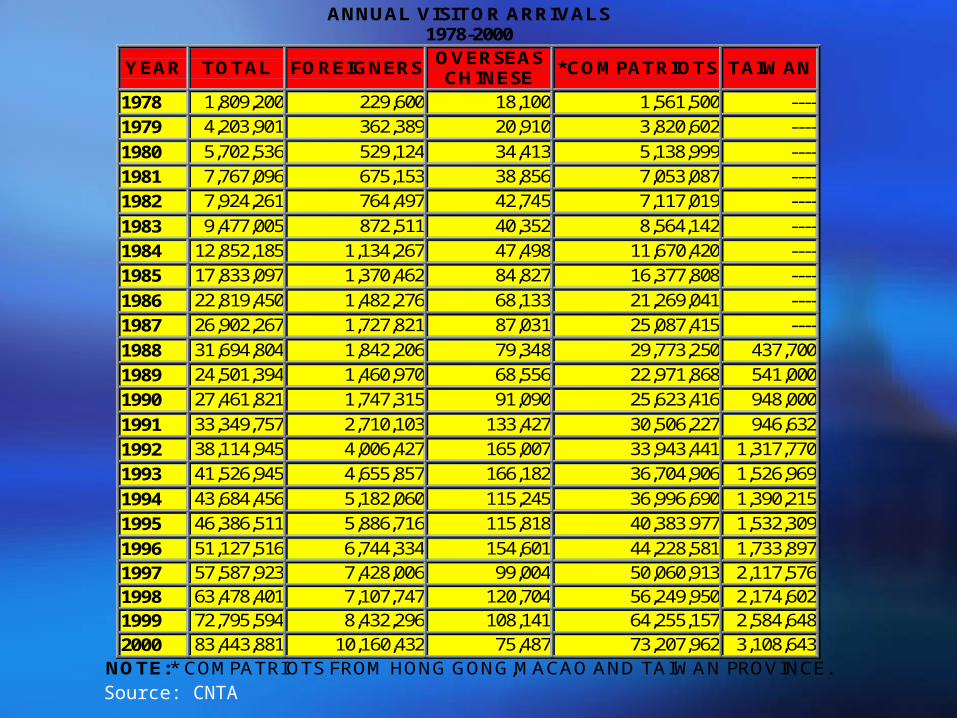
ANNUAL VISITOR ARRIVALS 1978-2000
YEAR TOTAL FOREIGNERS OVERSEAS CHINESE
*COMPATRIOTS TAIWAN
1978 1,809,200 229,600 18,100 1,561,500 ----
1979 4,203,901 362,389 20,910 3,820,602 ----
1980 5,702,536 529,124 34,413 5,138,999 ----
1981 7,767,096 675,153 38,856 7,053,087 ----
1982 7,924,261 764,497 42,745 7,117,019 ----
1983 9,477,005 872,511 40,352 8,564,142 ----
1984 12,852,185 1,134,267 47,498 11,670,420 ----
1985 17,833,097 1,370,462 84,827 16,377,808 ----
1986 22,819,450 1,482,276 68,133 21,269,041 ----
1987 26,902,267 1,727,821 87,031 25,087,415 ----
1988 31,694,804 1,842,206 79,348 29,773,250 437,700
1989 24,501,394 1,460,970 68,556 22,971,868 541,000
1990 27,461,821 1,747,315 91,090 25,623,416 948,000
1991 33,349,757 2,710,103 133,427 30,506,227 946,632
1992 38,114,945 4,006,427 165,007 33,943,441 1,317,770
1993 41,526,945 4,655,857 166,182 36,704,906 1,526,969
1994 43,684,456 5,182,060 115,245 36,996,690 1,390,215
1995 46,386,511 5,886,716 115,818 40,383.977 1,532,309
1996 51,127,516 6,744,334 154,601 44,228,581 1,733,897
1997 57,587,923 7,428,006 99,004 50,060,913 2,117,576 1998 63,478,401 7,107,747 120,704 56,249,950 2,174,602 1999 72,795,594 8,432,296 108,141 64,255,157 2,584,648
2000 83,443,881 10,160,432 75,487 73,207,962 3,108,643 NOTE:* COMPATRIOTS FROM HONG GONG,MACAO AND TAIWAN PROVINCE.
Source: CNTA
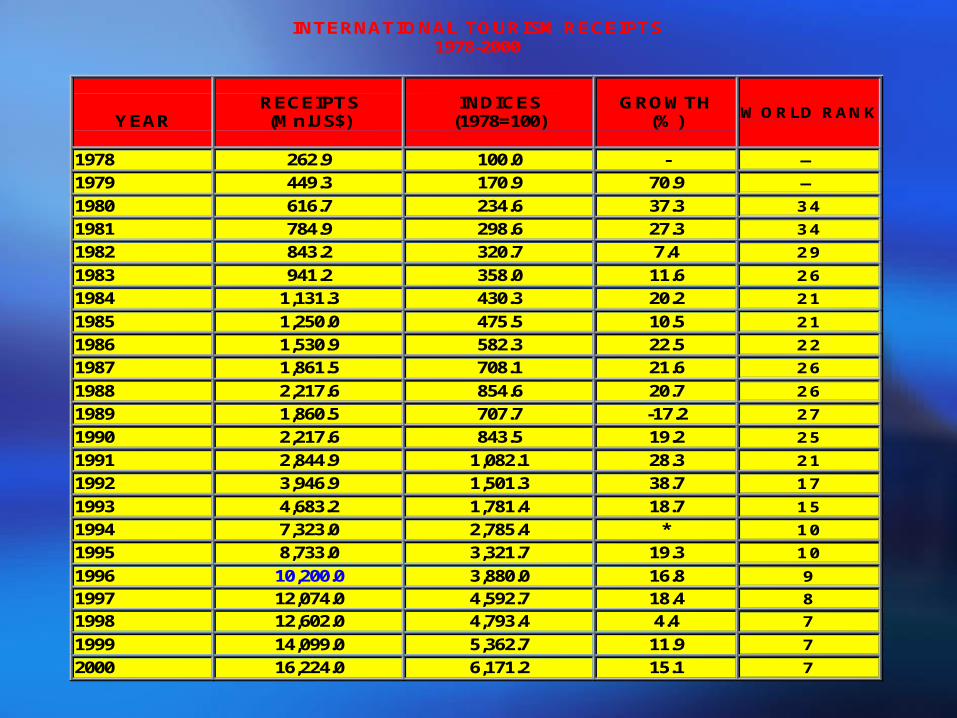
INTERNATIONAL TOURISM RECEIPTS 1978-2000
YEAR
RECEIPTS (Mn.US$)
INDICES (1978=100)
GROWTH (%) WORLD RANK
1978 262.9 100.0 - — 1979 449.3 170.9 70.9 — 1980 616.7 234.6 37.3 34 1981 784.9 298.6 27.3 34 1982 843.2 320.7 7.4 29 1983 941.2 358.0 11.6 26 1984 1,131.3 430.3 20.2 21 1985 1,250.0 475.5 10.5 21 1986 1,530.9 582.3 22.5 22 1987 1,861.5 708.1 21.6 26 1988 2,217.6 854.6 20.7 26 1989 1,860.5 707.7 -17.2 27 1990 2,217.6 843.5 19.2 25 1991 2,844.9 1,082.1 28.3 21 1992 3,946.9 1,501.3 38.7 17 1993 4,683.2 1,781.4 18.7 15 1994 7,323.0 2,785.4 * 10 1995 8,733.0 3,321.7 19.3 10 1996 10,200.0 3,880.0 16.8 9 1997 12,074.0 4,592.7 18.4 8 1998 12,602.0 4,793.4 4.4 7 1999 14,099.0 5,362.7 11.9 7 2000 16,224.0 6,171.2 15.1 7
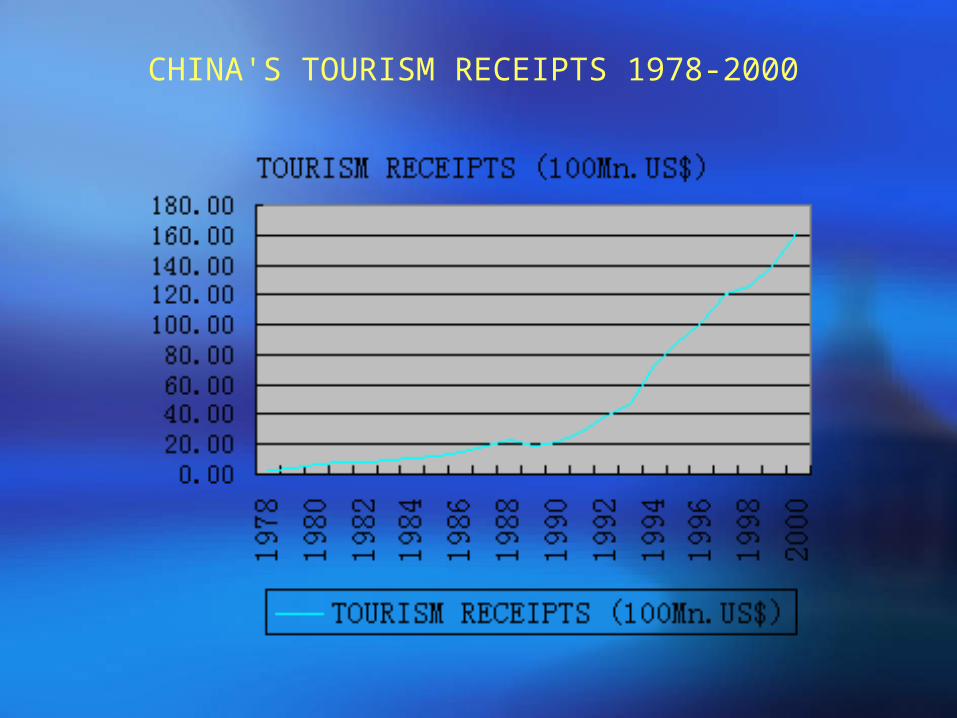
CHINA'S TOURISM RECEIPTS 1978-2000
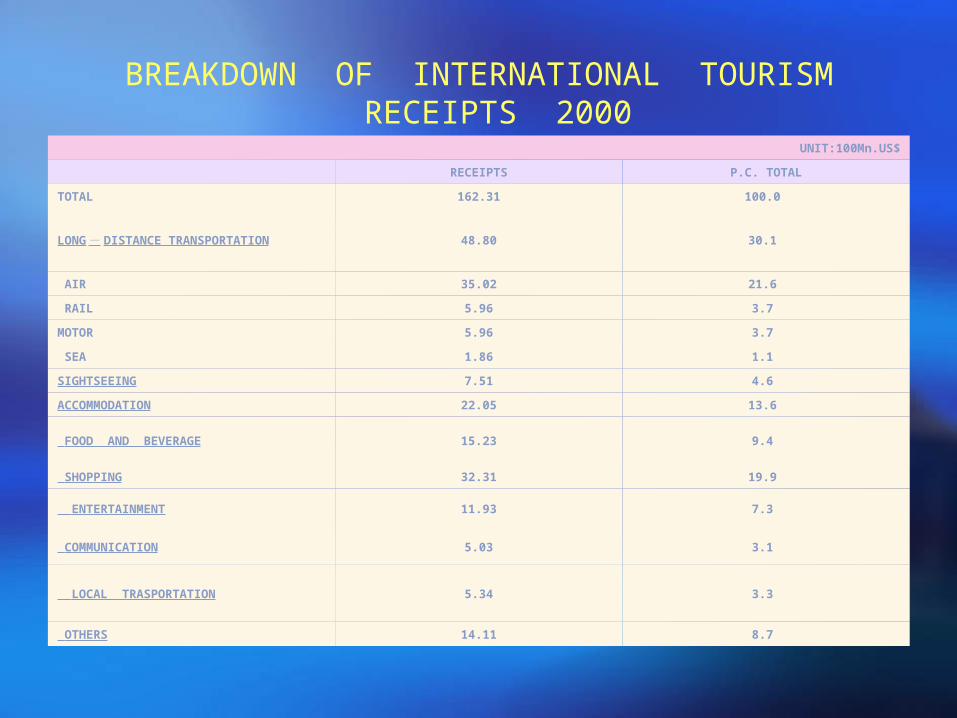
BREAKDOWN OF INTERNATIONAL TOURISM RECEIPTS 2000
UNIT:100Mn.US$
RECEIPTS P.C. TOTAL
TOTAL 162.31 100.0
LONG-DISTANCE TRANSPORTATION 48.80 30.1
AIR 35.02 21.6
RAIL 5.96 3.7
MOTOR 5.96 3.7
SEA 1.86 1.1
SIGHTSEEING 7.51 4.6
ACCOMMODATION 22.05 13.6
FOOD AND BEVERAGE 15.23 9.4
SHOPPING 32.31 19.9
ENTERTAINMENT 11.93 7.3
COMMUNICATION 5.03 3.1
LOCAL TRASPORTATION 5.34 3.3
OTHERS 14.11 8.7
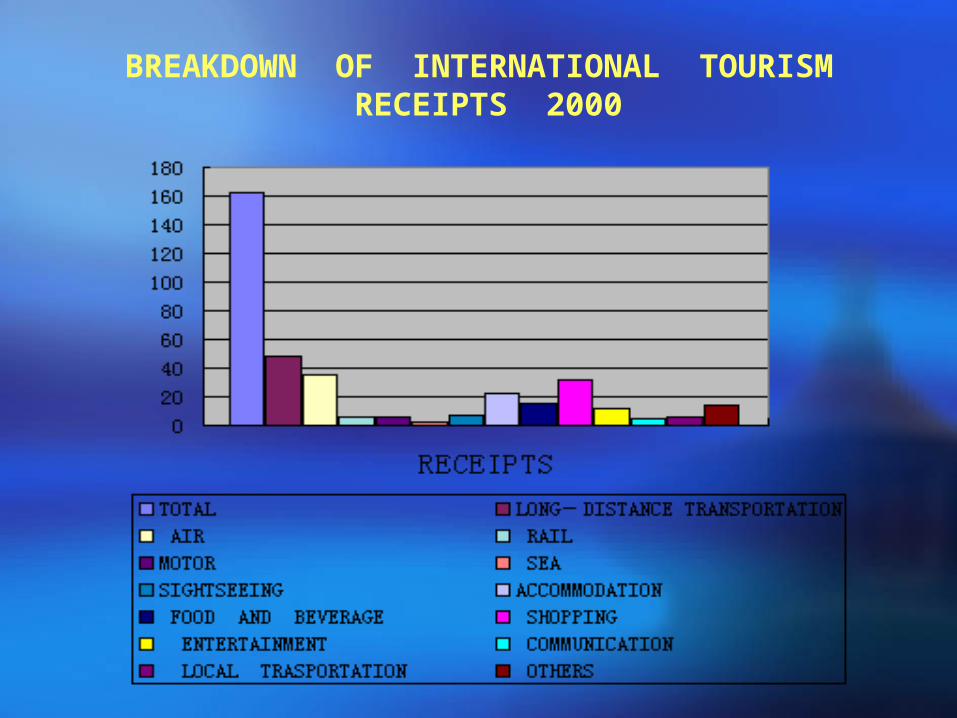
BREAKDOWN OF INTERNATIONAL TOURISM RECEIPTS 2000

( 2 ) Domestic tourism Until the mid-1980s, domestic tourism hardly existed,
China gives priority to inbound tourism for its foreign exchange earnings;
To meet the growing demand for leisure travel among China’s own citizens and to encourage personal consumption for economic growth, the central government has issued a number of policies to promote domestic tourism.
1. In 1992, weeklong holidays were first introduced;2. In 1995, a five-day work week was introduced;3. Starting in 1999, three weeklong holidays were
established around May 1(May Day/Labor Day), October 1 (National Day), and the lunar Spring Festival of Chinese New Year.
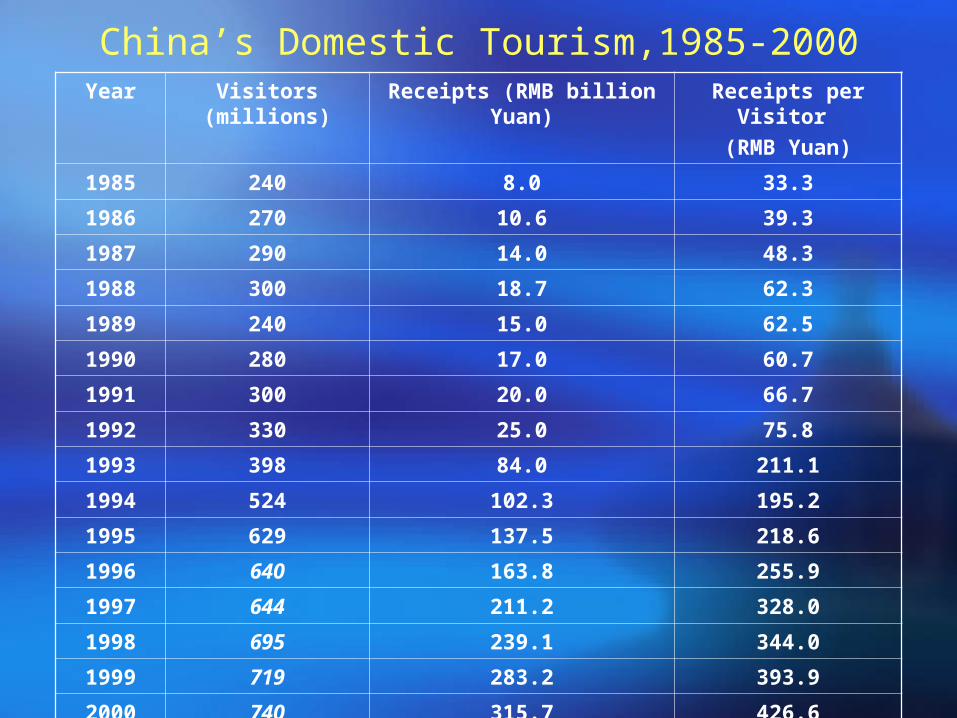
China’s Domestic Tourism,1985-2000Year Visitors (millions) Receipts (RMB billion Yuan) Receipts per Visitor
(RMB Yuan)
1985 240 8.0 33.3
1986 270 10.6 39.3
1987 290 14.0 48.3
1988 300 18.7 62.3
1989 240 15.0 62.5
1990 280 17.0 60.7
1991 300 20.0 66.7
1992 330 25.0 75.8
1993 398 84.0 211.1
1994 524 102.3 195.2
1995 629 137.5 218.6
1996 640 163.8 255.9
1997 644 211.2 328.0
1998 695 239.1 344.0
1999 719 283.2 393.9
2000 740 315.7 426.6

Characteristics of domestic tourism
The average length of stay by domestic travelers was four to six days;
Purpose. The majority of domestic visitors were traveling for leisure, recreation and holidays, or visiting friends and relatives;
More than 90% of domestic visitors chose to arrange their trips by themselves;
Occupation. More than one-third visitors are the executives and professionals.
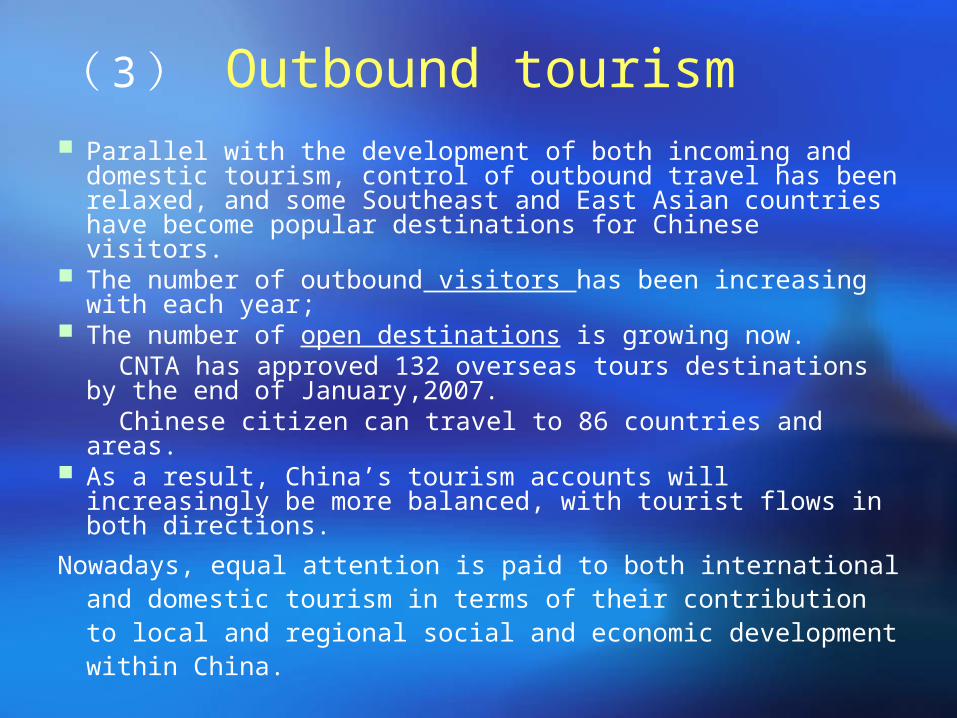
Parallel with the development of both incoming and domestic tourism, control of outbound travel has been relaxed, and some Southeast and East Asian countries have become popular destinations for Chinese visitors.
The number of outbound visitors has been increasing with each year;
The number of open destinations is growing now. CNTA has approved 132 overseas tours destinations by the
end of January,2007. Chinese citizen can travel to 86 countries and areas. As a result, China’s tourism accounts will increasingly be
more balanced, with tourist flows in both directions.
Nowadays, equal attention is paid to both international and domestic tourism in terms of their contribution to local and regional social and economic development within China.
( 3 ) Outbound tourism
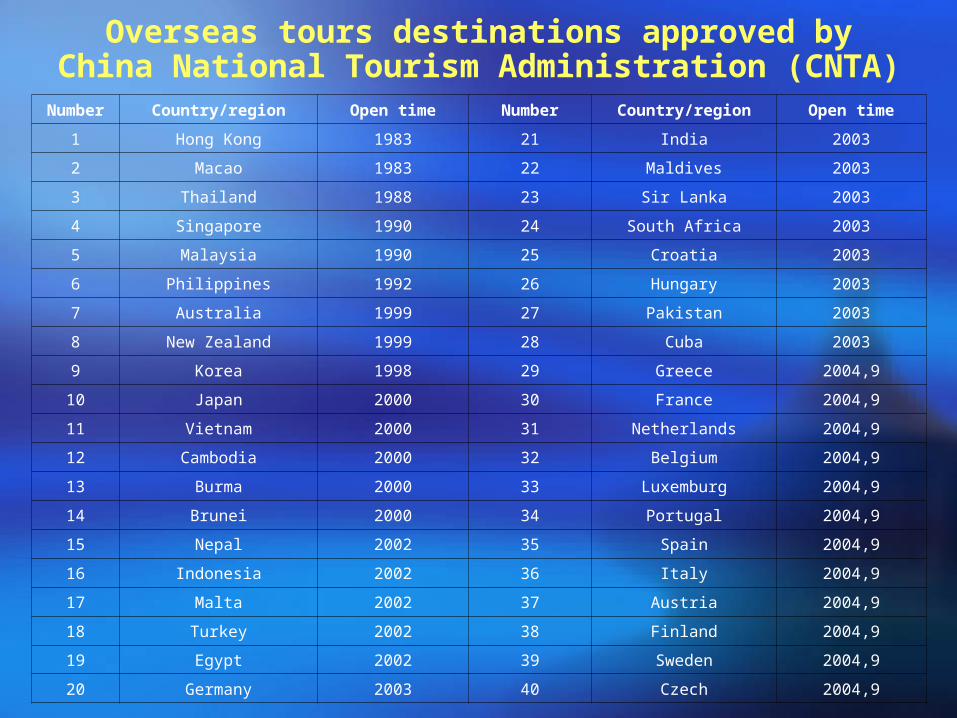
Overseas tours destinations approved byChina National Tourism Administration (CNTA)
Number Country/region Open time Number Country/region Open time
1 Hong Kong 1983 21 India 2003
2 Macao 1983 22 Maldives 2003
3 Thailand 1988 23 Sir Lanka 2003
4 Singapore 1990 24 South Africa 2003
5 Malaysia 1990 25 Croatia 2003
6 Philippines 1992 26 Hungary 2003
7 Australia 1999 27 Pakistan 2003
8 New Zealand 1999 28 Cuba 2003
9 Korea 1998 29 Greece 2004,9
10 Japan 2000 30 France 2004,9
11 Vietnam 2000 31 Netherlands 2004,9
12 Cambodia 2000 32 Belgium 2004,9
13 Burma 2000 33 Luxemburg 2004,9
14 Brunei 2000 34 Portugal 2004,9
15 Nepal 2002 35 Spain 2004,9
16 Indonesia 2002 36 Italy 2004,9
17 Malta 2002 37 Austria 2004,9
18 Turkey 2002 38 Finland 2004,9
19 Egypt 2002 39 Sweden 2004,9
20 Germany 2003 40 Czech 2004,9
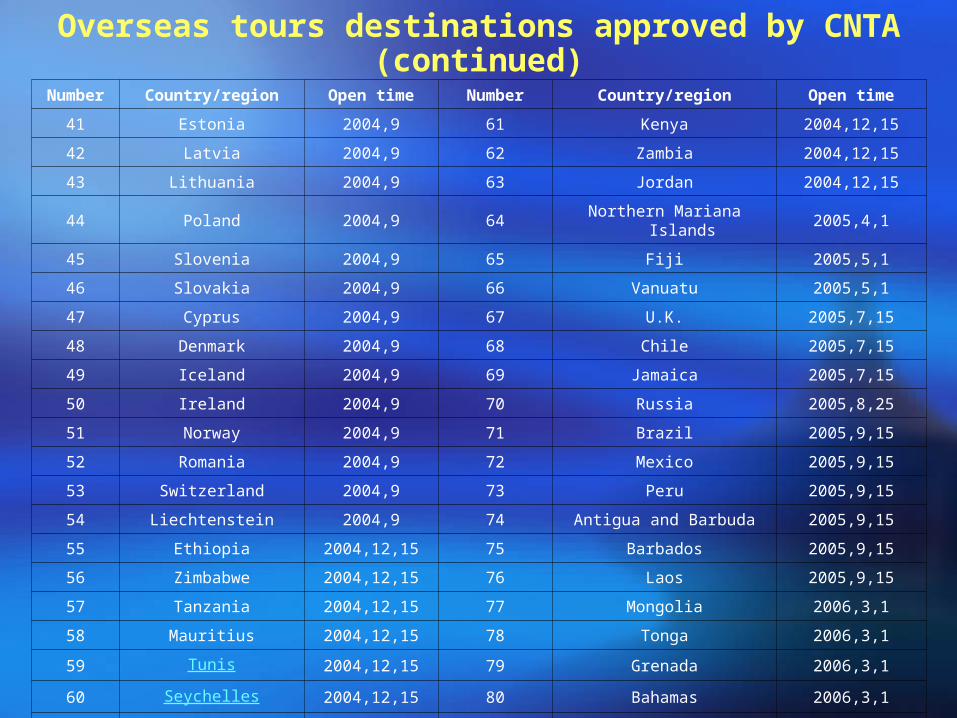
Overseas tours destinations approved by CNTA(continued)
Number Country/region Open time Number Country/region Open time
41 Estonia 2004,9 61 Kenya 2004,12,15
42 Latvia 2004,9 62 Zambia 2004,12,15
43 Lithuania 2004,9 63 Jordan 2004,12,15
44 Poland 2004,9 64 Northern Mariana Islands 2005,4,1
45 Slovenia 2004,9 65 Fiji 2005,5,1
46 Slovakia 2004,9 66 Vanuatu 2005,5,1
47 Cyprus 2004,9 67 U.K. 2005,7,15
48 Denmark 2004,9 68 Chile 2005,7,15
49 Iceland 2004,9 69 Jamaica 2005,7,15
50 Ireland 2004,9 70 Russia 2005,8,25
51 Norway 2004,9 71 Brazil 2005,9,15
52 Romania 2004,9 72 Mexico 2005,9,15
53 Switzerland 2004,9 73 Peru 2005,9,15
54 Liechtenstein 2004,9 74 Antigua and Barbuda 2005,9,15
55 Ethiopia 2004,12,15 75 Barbados 2005,9,15
56 Zimbabwe 2004,12,15 76 Laos 2005,9,15
57 Tanzania 2004,12,15 77 Mongolia 2006,3,1
58 Mauritius 2004,12,15 78 Tonga 2006,3,1
59 Tunis 2004,12,15 79 Grenada 2006,3,1
60 Seychelles 2004,12,15 80 Bahamas 2006,3,1
81 Saint Lucia 2006,3,1

Total Number of China's Outbound Travelers in 2000
In 2000, Chinese outbound travelers totaled
10.4726 million, 13.43% more than 1999.
Among them, business travelers were 4.8418
million, accounting for 46.23%, down 2.51%.
Travelers for private purposes were 5.6309
million accounting for 53.77%, up 31.99%.
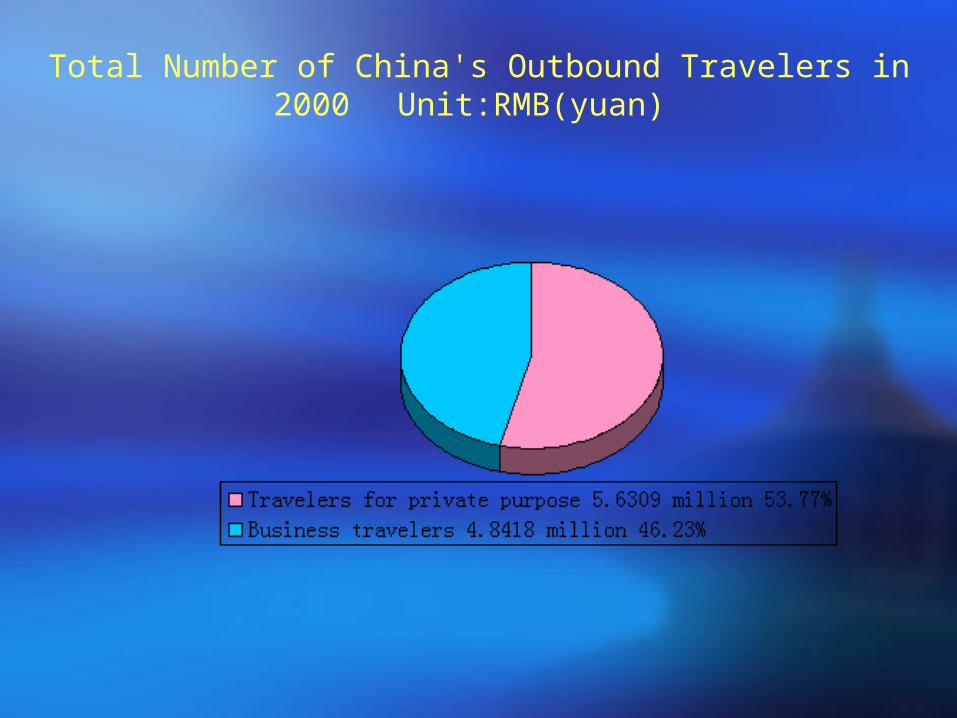
Total Number of China's Outbound Travelers in 2000 Unit:RMB(yuan)
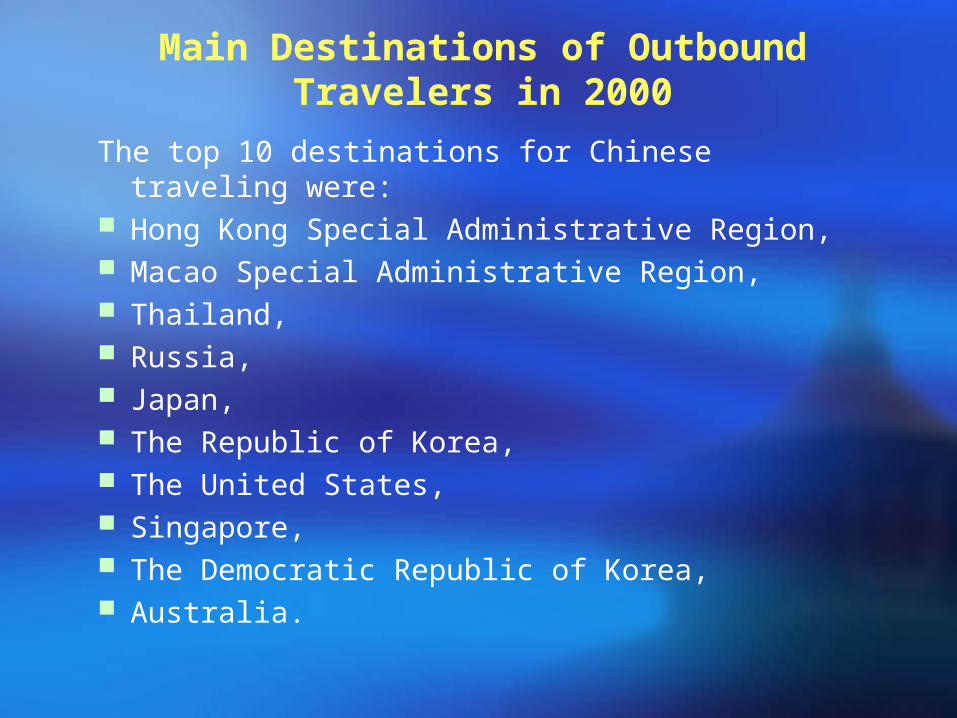
Main Destinations of Outbound Travelers in 2000
The top 10 destinations for Chinese traveling were: Hong Kong Special Administrative Region, Macao Special Administrative Region, Thailand, Russia, Japan, The Republic of Korea, The United States, Singapore, The Democratic Republic of Korea, Australia.
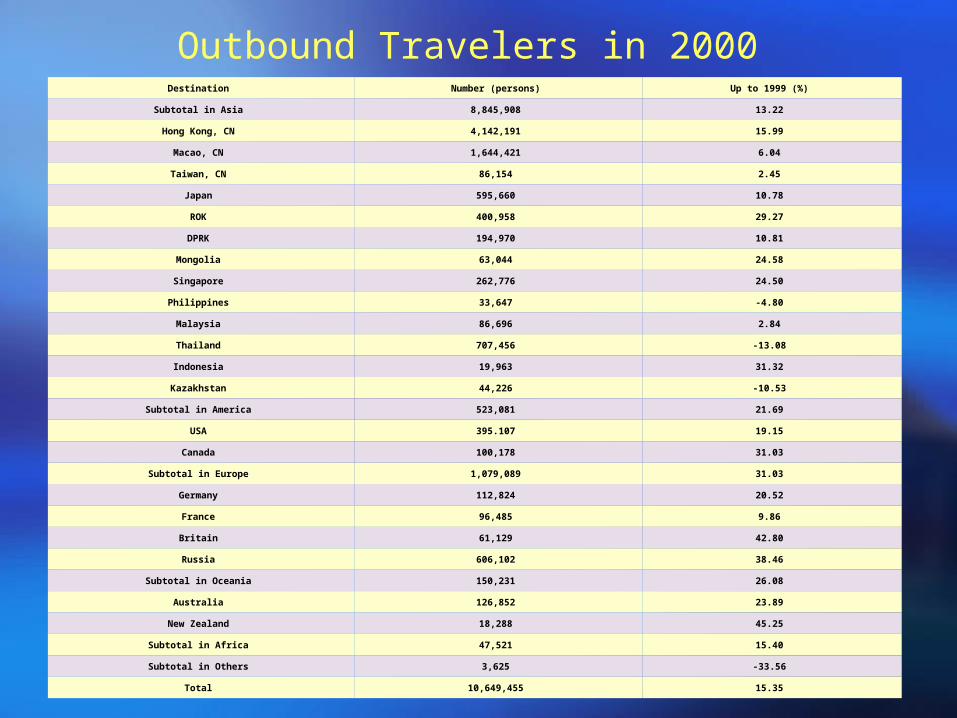
Outbound Travelers in 2000 Destination Number (persons) Up to 1999 (%)
Subtotal in Asia 8,845,908 13.22
Hong Kong, CN 4,142,191 15.99
Macao, CN 1,644,421 6.04
Taiwan, CN 86,154 2.45
Japan 595,660 10.78
ROK 400,958 29.27
DPRK 194,970 10.81
Mongolia 63,044 24.58
Singapore 262,776 24.50
Philippines 33,647 -4.80
Malaysia 86,696 2.84
Thailand 707,456 -13.08
Indonesia 19,963 31.32
Kazakhstan 44,226 -10.53
Subtotal in America 523,081 21.69
USA 395.107 19.15
Canada 100,178 31.03
Subtotal in Europe 1,079,089 31.03
Germany 112,824 20.52
France 96,485 9.86
Britain 61,129 42.80
Russia 606,102 38.46
Subtotal in Oceania 150,231 26.08
Australia 126,852 23.89
New Zealand 18,288 45.25
Subtotal in Africa 47,521 15.40
Subtotal in Others 3,625 -33.56
Total 10,649,455 15.35

The End!
Questions?