Embed Size (px)
Citation preview

2/2/2011
1
2D Trusses:
a Case Study for Understanding the Engineering Design Process
Presented by Paul EganAdvisor: Dr. Jonathan Cagan
Mechanical Engineering, Carnegie Mellon University27 January 2010
Introduction: OverviewPerformed research on a similar design problem to your class
problem: Both problems require optimizing the geometry of a product to find the lowest weight solution satisfying constraints
A Graphical User Interface recorded participants designing trusses
Study supports
2
y ppnotion that good design practices lead to better solutions
Introduction Results ConclusionBackground Methods

2/2/2011
2
Why do Different Engineers Find Different Solutions to a Design Problem?
Every engineer possesses a different set of skills and resources. For a given design problem every engineer approaches and solves g g p y g ppit uniquely, which in turns produces variations in solutions
There is often no “best” solution, but there does exist a set of “better” solutions
Introduction Results Conclusion3 Background Methods
Design is a process: do good strategies and practices of exploration, iteration, and optimization lead to better final products?
Background: Comparison of Trusses Designed by Experts and Simulated Annealing
Engineers and architects solved the same truss design problem while emphasizing different aspects of form, yet both
d d f ti l d i (Sh d C )produced functional designs (Shea and Cagan)
Rules that captured some of the strategies of the human designers were programmed into a simulated annealing algorithm which then output similar designs (Shea and Cagan)
4 Introduction Results ConclusionBackground Methods

2/2/2011
3
Evolutionary Algorithms
Below are some steps in the process of an evolutionary algorithm solving the same truss bridge problem I give to human participants problem
Note that it follows a different set of rules from how a human would solve the problem, it lacks intution and there are tradeoffs associated with both approaches
5 Introduction Results ConclusionBackground Methods
Methods: Hypothesis
Problem solving consists of an understanding g gprocess and search process. Properly applying these processes becomes impeded as problem becomes more complex (Jonassen)
Increasing the range and resolutions of available truss members will improve problem solving
f l h (performance in simple search spaces (tower problem), but impede the design process as searches become more complex (bridge problem)
6 Introduction ResultsProblem ConclusionMotivation Methods

2/2/2011
4
Graphical User Interface (GUI)Programmed in JAVA, Real-
time FEA Calculations
Given a network of nodes and members, solves for displacements, reactions, forces
Stats are written to file every second all design actions second, all design actions recorded for later viewing
Tutorial, practice problem, and minimum weight objective
7 Introduction Results ConclusionBackground Methods
8 Introduction Results ConclusionBackground Methods

2/2/2011
5
Methods: Experimental Design Conditions
Provide participants a sequence of four different problems
Participants build the truss by configuring members geometrically
Di id ti i t i t diff t Divide participants into different design conditions with access to different combinations of truss members for construction
9 Introduction Results ConclusionBackground Methods
Rules of Truss Configuration
Topology: Spatial distribution of nodes relative to each otherShape: How nodes and members are connectedpSize: Variance in cross-sectional area of members
10 Introduction Results ConclusionBackground Methods

2/2/2011
6
Varying Complexity of Design Problems
The different problems simulate different top-down p pconstraints imposed from the implementation levelProblem choice contrasts a complex and simple search spaceTen minutes allotted for Bridge, eight for tower
11 Introduction Results ConclusionBackground Methods
Varying Complexity ofAvailable Truss MembersParticipants were divided into three divided into three different populations
Each population had access to a different range and resolution of wide flange steel of wide flange steel sections
12 Introduction Results ConclusionBackground Methods

2/2/2011
7
Experimental HypothesisPopulations with access to fewer
b ill f b i l members will perform better in larger searches spaces (bridge problem)
Populations with access to more members will perform better in smaller search spaces (tower problem)
13 Introduction Results ConclusionBackground Methods
Results: Piloted Experiment
Seventeen total participants, CMU graduate and undergraduates students all with ME backgroundsg g
Large variance in design performance, both across problems and within populations of participants
Partial designs were not included in statistical results
14 Introduction Results ConclusionBackground Methods

2/2/2011
8
Comparison of Normalized Scores
Seven member population scored best on both problemsFifteen member population scored worse on bridge problem Fifteen member population scored worse on bridge problem relative to other groups, and better on the tower problemTrends in data support hypothesis that humans design “optimally” under certain conditions of complexity
0.8
1.0
core
Tower Problem Average Scores
0.8
1.0
core
Bridge Problem Average Scores
15
0.0
0.2
0.4
0.6
Design Populations with Differing Availability of Truss Member Sizes
Normalized
Sc
3
7
15
0.0
0.2
0.4
0.6
Design Populations with Differing Availability of Truss Member Sizes
Normalized
Sc
3
7
15
Introduction Results ConclusionBackground Methods
Bridge Designs
16 Introduction Results ConclusionBackground Methods

2/2/2011
9
Tower Designs
17 Introduction Results ConclusionBackground Methods
Tracking the Design Process
Design iterations are tracked by following y gthe objective function (weight of design)
Graph represents the design process of the best bridge solution from entire study
18 Introduction Results ConclusionBackground Methods

2/2/2011
10
Initial Design
Tracking the Design Process
Conceptual Design: Utilizing intuition or previous domain experience to propose an initial design
19 Introduction Results ConclusionBackground Methods
Re-sizing members and moving nodes
Tracking the Design Process
and moving nodes
Preliminary Design: Tweaking the conceptual design in order to fulfill design constraints
20 Introduction Results ConclusionBackground Methods

2/2/2011
11
Topology Exploration
Tracking the Design Process
Moves away from objective function, which opens up new design possibilities for sizing optimization
21 Introduction Results ConclusionBackground Methods
Best Bridge Design Process
Topology Optimization
Detail Design: A Strategy to sequentially move each node to optimal location
22 Introduction Results ConclusionBackground Methods
2/2/2011
12
Sizing Optimization
Tracking the Design Process
Detail Design: A Strategy to sequentially set each member to optimal size
23 Introduction Results ConclusionBackground Methods
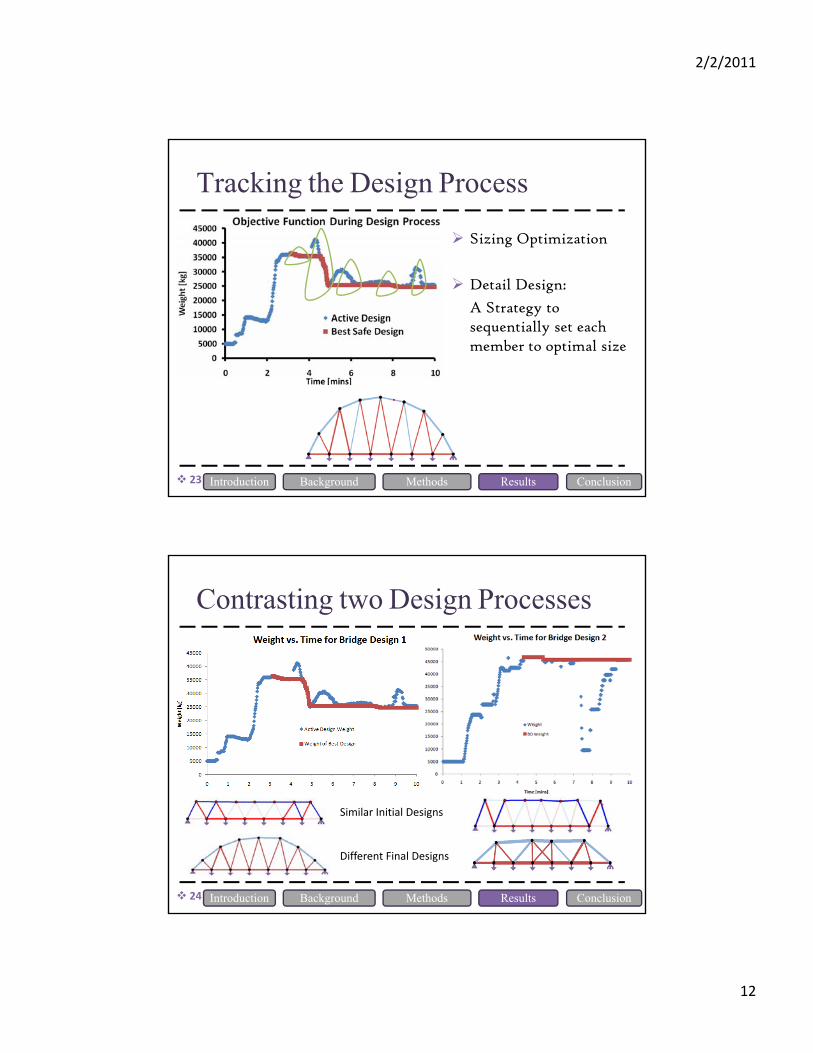
Contrasting two Design Processes
Similar Initial Designs
Different Final Designs
24 Introduction Results ConclusionBackground Methods

2/2/2011
13
Humans compared with Evolutionary Algorithm
One human designer produced, within ten minutes, a solution very close to that found by evolutionary algorithms solution very close to that found by evolutionary algorithms which required 488 minutes of computational time
Total human effort put forth on the study was 170 minutes
Very different design processes and approaches, but both d d l d lproduced similar end results
25 Introduction Results ConclusionBackground Methods
Conclusions
Experiment shows that human designers perform optimallyp g p p ybelow a certain threshold of complexity
The most successful designers used iterations and shuttled between strategies of initiating a design, exploring the design and optimizing the design
Those with general design experience often did better than those with no design experience, even though no one in the study had experience with designing trusses (Supports the idea that Intuition is LEARNED not innate)
26 Introduction Results ConclusionBackground Methods

2/2/2011
14
Lessons relating to your Project
Everyone in class has different resources of knowledge, time, and experience which leads them to different solutions. A good engineer produces His/Herbest solution by utilizing all of their personally available resources y z g p y
Intuition is developed with time and hard work
Try Different strategies! Design is a creative process, there is no single best method to design a product…also, if you’re not having fun, you’re not designing!
It’s counter-intuitive, but sometimes moving away from the solution brings f d t b tt l tiyou forward to an even better solution
Iterate, iterate, iterate….
Keep it Simple!
27 Introduction Results ConclusionBackground Methods
Acknowledgements
Advisor: Dr. Jonathan Cagan
Research Co-advisors:Dr. Christian SchunnDr. Phillip LeDuc
Integrated Design Innovation Group (my labmates)
Discussion of The Method by Billy Vaughn Koenl f d l h d fPopular Science format detailing the engineering design process from an
Engineering and Philosophy perspectiveGet this book! Integrated Design Innovation Group (my labmates)
And, Professor Collins, of course
28