Embed Size (px)
DESCRIPTION
Production Planning note
Citation preview
11 Introduction of Production Design
Introduction of Production Design
1

5 - 2
Outline
1. Product Life Cycle2. Product Development
2

5 - 3
Outline - Continued Generating New Products
New Product Opportunities Importance of New Products
Product Development Product Development System Quality Function Deployment (QFD) Organizing for Product Development Manufacturability and Value Engineering
3

5 - 4
Regal Marine Global market 3-dimensional CAD system
Reduced product development time Reduced problems with tooling Reduced problems in production
Assembly line production JIT
4

5 - 5
Product Decision
The objective of the product decision The objective of the product decision is to develop and implement a is to develop and implement a product strategy that meets the product strategy that meets the
demands of the marketplace with a demands of the marketplace with a competitive advantage.competitive advantage.
5

5 - 6
Product Decision The good or service the organization
provides society Top organizations typically focus on core
products Customers buy satisfaction, not just a
physical good or particular service Fundamental to an organization's strategy
with implications throughout the operations function
6

5 - 7
Product Strategy Options
Differentiation Shouldice Hospital in Canada
specializing in hernia operation
Low cost Taco Bell, Walmart
Rapid response Toyota (product development under
2 years. Industry standard is over 2 years)
7

5 - 8
1. Product Life Cycles
May be any length from a few hoursMay be any length from a few hours ( (a a newspapernewspaper), ), months (months (cell phonescell phones), years ), years ((furnituresfurnitures), ), to decadesto decades ( (Wolgswagen Wolgswagen BeetleBeetle))
A product’s life is divided into four A product’s life is divided into four phases:1. Introduction, 2. Growth, 3. phases:1. Introduction, 2. Growth, 3. Maturity, 4. DeclineMaturity, 4. Decline
The following figure shows how these four The following figure shows how these four stages are linked to product sales, cash stages are linked to product sales, cash flow and cost.flow and cost.
The operations function must be able to introduce new products successfully
8

5 - 9
Product Life Cycles
Negative cash flow
Introduction Growth Maturity Decline
Sal
es,
cost
, an
d c
ash
flo
w Cost of development and production
Cash flow
Net revenue (profit)
Sales revenue
Loss
9

5 - 10
Product Life CycleIntroductory PhaseIntroductory Phase Fine tuning may warrant
unusual expenses for
1. Research
2. Product development
3. Process modification and enhancement
4. Supplier development
10

5 - 11
Product Life CycleGrowth PhaseGrowth Phase
Product design begins to stabilize
Effective forecasting of capacity becomes necessary
Adding or enhancing capacity may be necessary
11

5 - 12
Product Life Cycle
Maturity PhaseMaturity Phase
Competitors now established
High volume, innovative production may be needed
Improved cost control is required, reduction in options.
12

5 - 13
Product Life Cycle
Decline PhaseDecline Phase
Unless product makes a special contribution to the organization, must plan to terminate offering
13

5 - 14
Product Life Cycle Costs
Costs incurred
Costs committed
Ease of change
Concept Detailed Manufacturing Distribution,design design service,
prototype and disposal
Per
cen
t o
f to
tal c
ost
100 –
80 –
60 –
40 –
20 –
0 –
14

5 - 15
Product-by-Value Analysis
Lists products in descending order (from largest to smallest) of their individual dollar contribution to the firm
Lists the total annual dollar contribution of the product
Helps management to evaluate alternative strategies so that limited existing resourses are to be invested in few critical and not in many trivial.
15

5 - 16
Product-by-Value Analysis
Individual Contribution ($)
Total Annual Contribution ($)
Love Seat $102 $36,720
Arm Chair $87 $51,765
Foot Stool $12 $6,240
Recliner $136 $51,000
Sam’s Furniture Factory
16

5 - 17
New Product Opportunities
1. Understanding the customer
2. Economic change
3. Sociological and demographic change
4. Technological change
5. Political/legal change
6. Market practice, professional standards, suppliers, distributors
Brainstorming
is a useful tool
17

5 - 18
2. Product Development
Scope for design and engineering
teams
Evaluation
Introduction
Test Market
Functional Specifications
Design Review
Product Specifications
Customer Requirements
Ability
Ideas
18

5 - 19
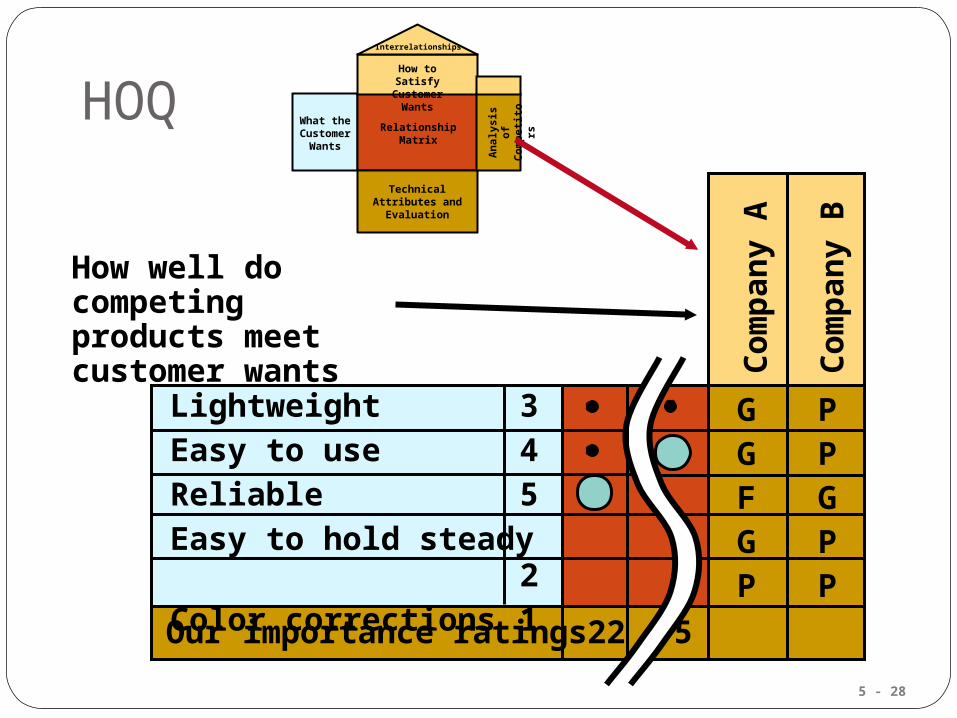
Quality Function Deployment
1. Identify customer wants2. Identify how the good/service will satisfy
customer wants3. Relate customer wants to product hows4. Identify relationships between the firm’s
hows5. Develop importance ratings6. Evaluate competing products7. Compare performance to desirable
technical attributes19

QFD House of Quality
Relationshipmatrix
How to satisfycustomer wants
Interrelationships
Co
mp
etit
ive
asse
ssm
ent
Technicalevaluation
Target values
What the customer
wants
Customer importance
ratings
Weighted rating
20

5 - 2121
A part of the QFD process that utilizes a planning matrix to relate customer “wants” to “how” the company is going to meet those “wants”.
QFD House of Quality

5 - 22
House of Quality (HOQ) Example
Your team has been charged with designing a new camera for Great Cameras, Inc.
The first action is to construct a House of Quality

5 - 23
HOQ
Customerimportance
rating(5 = highest)
Lightweight 3Easy to use 4Reliable 5Easy to hold steady 2Color correction 1
What the customer
wants
What the Customer
Wants
RelationshipMatrix
TechnicalAttributes and
Evaluation
How to SatisfyCustomer Wants
Interrelationships
An
alys
is o
fC
om
pet
ito
rs

5 - 24
HOQWhat the Customer
Wants
RelationshipMatrix
TechnicalAttributes and
Evaluation
How to SatisfyCustomer Wants
Interrelationships
An
alys
is o
fC
om
pet
ito
rs
Lo
w e
lect
rici
ty r
equ
irem
ents
Alu
min
um
co
mp
on
ents
Au
to f
ocu
s
Au
to e
xpo
sure
Pai
nt
pal
let
Erg
on
om
ic d
esig
n
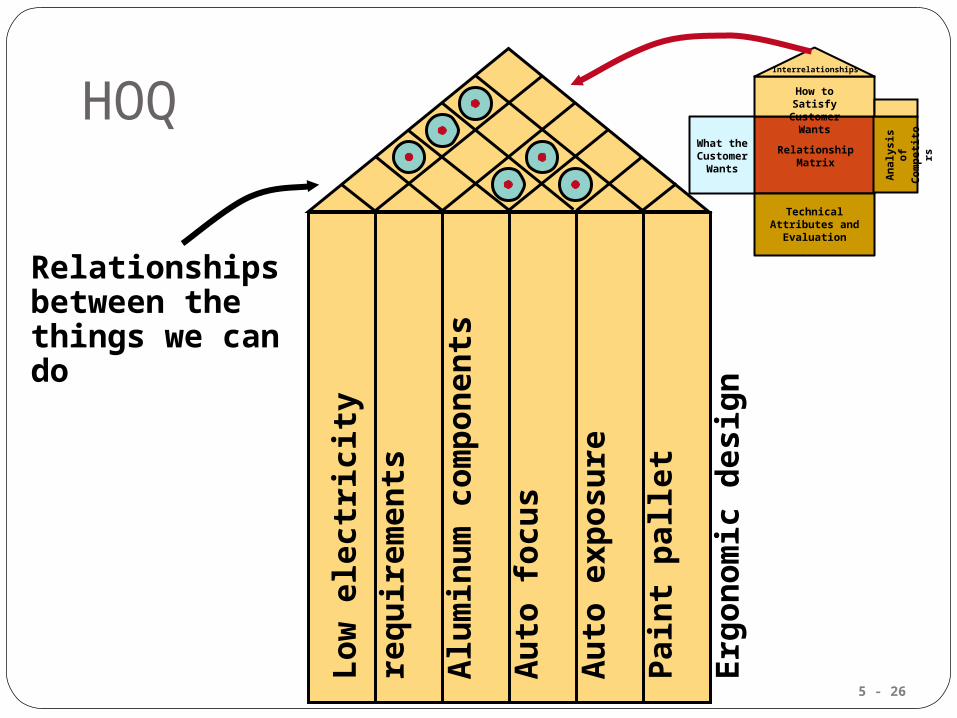
How to SatisfyCustomer Wants

5 - 25
Lightweight 3Easy to use 4Reliable 5Easy to hold steady 2Color corrections 1
HOQWhat the Customer
Wants
RelationshipMatrix
TechnicalAttributes and
Evaluation
How to SatisfyCustomer Wants
Interrelationships
An
alys
is o
fC
om
pet
ito
rs
5 = High relationship
3 = Medium relationship
1 = Low relationship
Relationship matrix
5 - 26
HOQWhat the Customer
Wants
RelationshipMatrix
TechnicalAttributes and
Evaluation
How to SatisfyCustomer Wants
Interrelationships
An
alys
is o
fC
om
pet
ito
rs
Lo
w e
lect
rici
ty r
equ
irem
ents
Alu
min
um
co
mp
on
ents
Au
to f
ocu
s
Au
to e
xpo
sure
Pai
nt
pal
let
Erg
on
om
ic d
esig
n
Relationships between the things we can do
5 - 27
HOQ
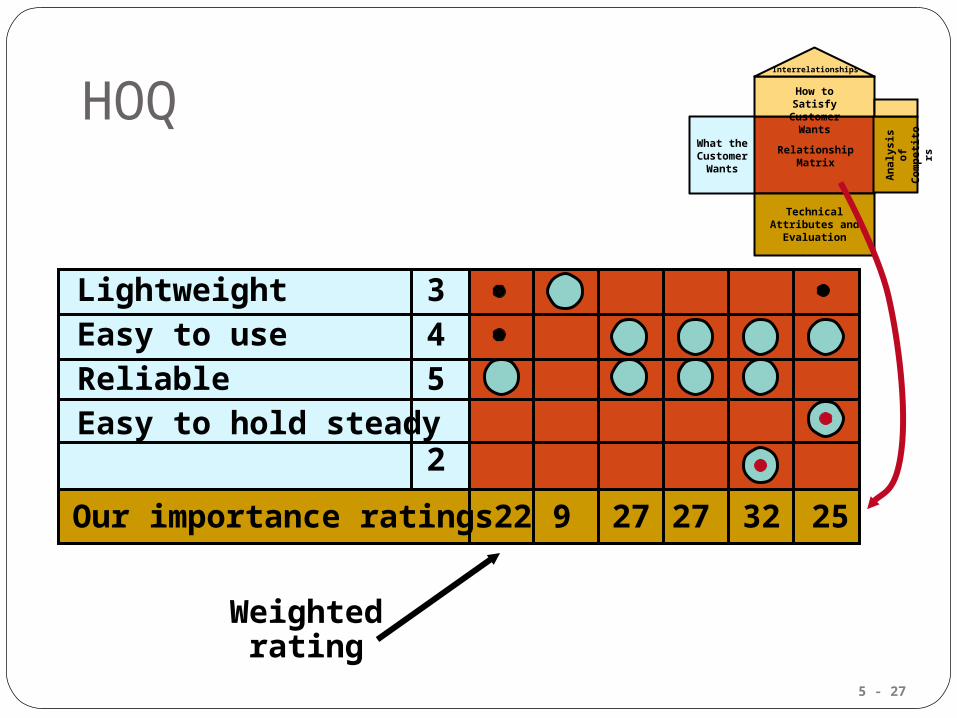
Weighted rating
What the Customer
Wants
RelationshipMatrix
TechnicalAttributes and
Evaluation
How to SatisfyCustomer Wants
Interrelationships
An
alys
is o
fC
om
pet
ito
rs
Lightweight 3Easy to use 4Reliable 5Easy to hold steady 2Color corrections 1
Our importance ratings 22 9 27 27 32 25
5 - 28
HOQ
Co
mp
any
A
Co
mp
any
B
G PG PF GG PP P
Lightweight 3Easy to use 4Reliable 5Easy to hold steady 2Color corrections 1
Our importance ratings 22 5
How well do competing products meet customer wants
What the Customer
Wants
RelationshipMatrix
TechnicalAttributes and
Evaluation
How to SatisfyCustomer Wants
Interrelationships
An
alys
is o
fC
om
pet
ito
rs

5 - 29
HOQ
Target values(Technical attributes)
Technical evaluation
Company A 0.7 60% yes 1 ok G
Company B 0.6 50% yes 2 ok F
Us 0.5 75% yes 2 ok G
0.5
A
75%
2’ t
o ∞
2 ci
rcu
its
Fai
lure
1 p
er 1
0,00
0
Pan
el r
anki
ng
What the Customer
Wants
RelationshipMatrix
TechnicalAttributes and
Evaluation
How to SatisfyCustomer Wants
Interrelationships
An
alys
is o
fC
om
pet
ito
rs

5 - 30
HOQ
Completed House of Quality
Lightweight 3
Easy to use 4
Reliable 5
Easy to hold steady 2
Color correction 1
Our importance ratings
Lo
w e
lect
rici
ty r
equ
irem
ents
Alu
min
um
co
mp
on
ents
Au
to f
ocu
s
Au
to e
xpo
sure
Pai
nt
pal
let
Erg
on
om
ic d
esig
n
Co
mp
any
A
Co
mp
any
B
G P
G P
F G
G P
P P
Target values(Technical attributes)
Technical evaluation
Company A 0.7 60% yes 1 ok G
Company B 0.6 50% yes 2 ok F
Us 0.5 75% yes 2 ok G
0.5
A
75
%
2’
to ∞
2 c
irc
uit
s
Fa
ilu
re 1
pe
r 1
0,0
00
Pa
ne
l ra
nk
ing
22 9 27 27 32 25

5 - 31
HOQ
Deploying resources through the organization in response to customer requirements
Pro
du
ctio
n
pro
cess
Quality plan
House 4
Sp
ecif
ic
com
po
nen
ts
Production process
House 3
Des
ign
ch
arac
teri
stic
s
Specific components
House 2
Cu
sto
mer
re
qu
irem
ents
Design characteristics
House 1
31

5 - 32
Four Approaches to Four Approaches to OrganizingOrganizing for for Product DevelopmentProduct Development1. Historically – distinct departments
R&D Dept, Eng. Dept, Mnfg. Eng. Dept, Prod. Dept. Duties and responsibilities are well defined
(Advantage) Difficult to foster forward thinking (Disadvantage)
2 A ChampionTo assign a product manager to champion the product
through the product development system and related organizations
32
3 Team approach Cross functional – representatives from
all disciplines or functions Product development teams, design for
manufacturability teams, value engineering teams
4 Japanese “whole organization” approach No organizational divisions

5 - 33
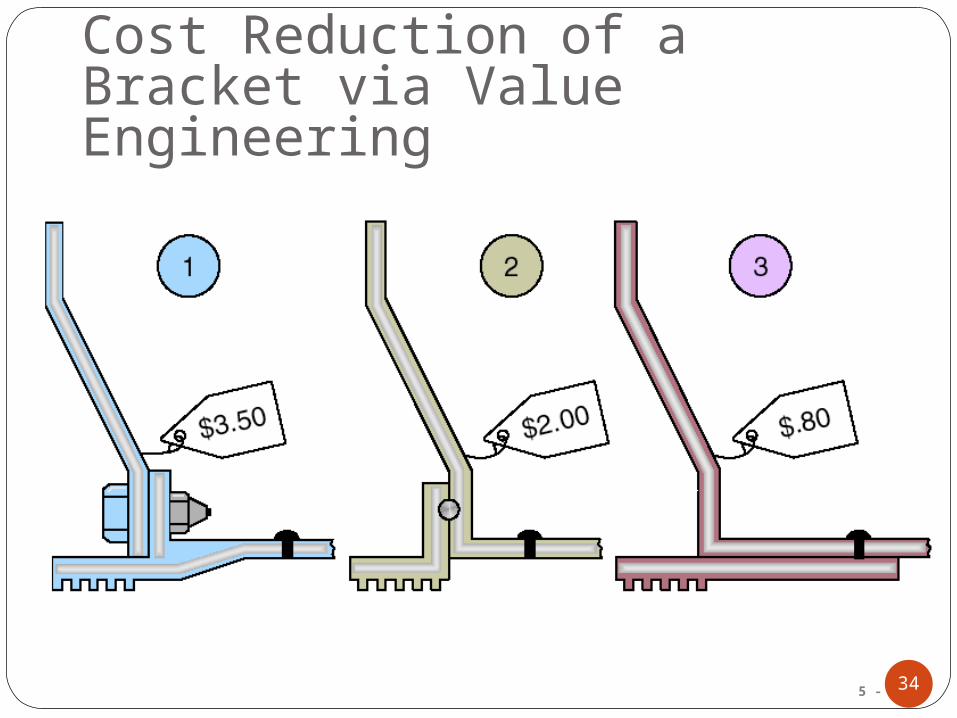
Design for Design for Manufacturability Manufacturability andand Value Engineering Value Engineering
Benefits:1. Reduced complexity of products2. Reduction of environmental impact3. Additional standardization of
products4. Improved functional aspects of
product5. Improved job design and job safety6. Improved maintainability
(serviceability) of the product7. Robust design
33
5 - 34
Cost Reduction of a Bracket via Value Engineering
34

5 - 35
Issues for Product Development
Robust design Modular design Computer-aided design (CAD) Computer-aided manufacturing
(CAM) Virtual reality technology Value analysis Environmentally friendly design
35

5 - 36
1. Robust Design
Product is designed so that small variations in production or assembly do not adversely affect the product
Typically results in lower cost and higher quality
36

5 - 37
2. Modular Design
Products designed in easily segmented components
Adds flexibility to both production and marketing
Improved ability to satisfy customer requirements
37

5 - 38
3. Computer Aided Design (CAD)
Using computers to design products and prepare engineering documentation
Shorter development cycles, improved accuracy, lower cost
Information and designs can be deployed worldwide
Design for Manufacturing and Assembly (DFMA) Solve manufacturing problems
during the design stage
38
5 - 39
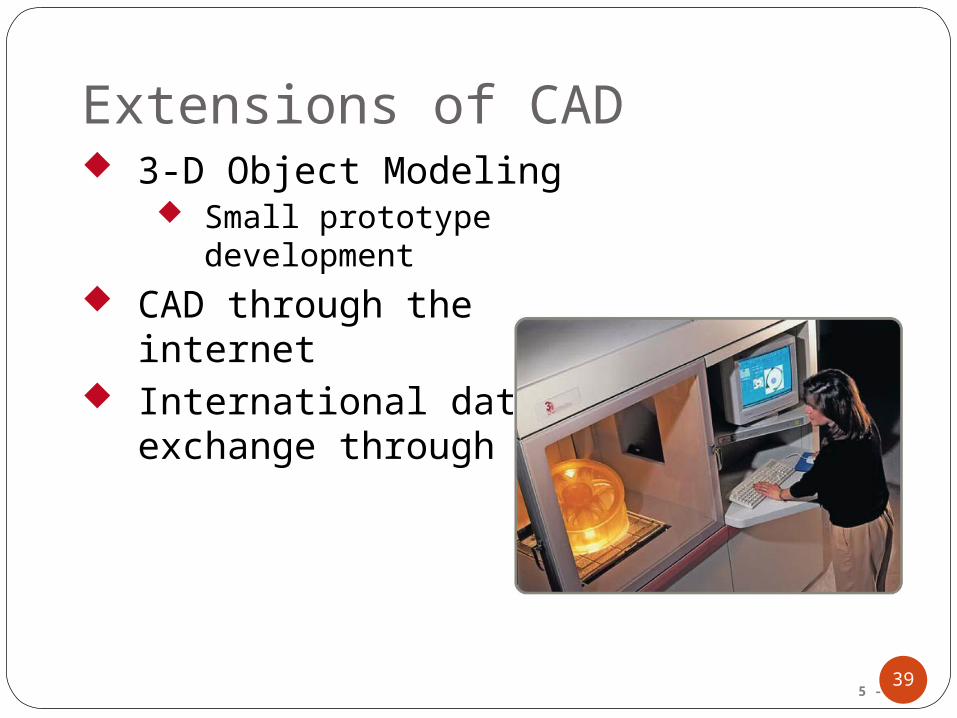
Extensions of CAD 3-D Object Modeling
Small prototype development
CAD through the internet
International data exchange through STEP
39

5 - 40
4. Computer-Aided Manufacturing (CAM)
Utilizing specialized computers and program to control manufacturing equipment
Often driven by the CAD system (CAD/CAM)
CNC Machines
40

5 - 41
Benefits of CAD/CAM
1. Better Product quality2. Shorter design time3. Production cost
reductions4. Database availability
41

5 - 42
5. Virtual Reality Technology
Computer technology used to develop an interactive, 3-D model of a product from the basic CAD data
Allows people to ‘see’ the finished design before a physical model is built
Very effective in large-scale designs such as plant layout
42

5 - 43
6. Value Analysis While Value Engineering focuses on
preproduction design improvement, Value Analysis takes place during the production process.
Seeks improvements leading either to a better product or a product which can be produced more economically with less environmental impact
43

5 - 44
7. Ethics, Environmentally Friendly Designs, and Sustainability
44
5 - 45
The Ethical Approach
View product design from a systems perspective Inputs, processes, outputs
Costs to the firm/costs to society
Consider the entire life cycle of the product
45
5 - 46
The Ethical Approach Goals
1. Developing safe end environmentally sound practices
2. Minimizing waste of resources
3. Reducing environmental liabilities
4. Increasing cost-effectiveness of complying with environmental regulations
5. Begin recognized as a good corporate citizen
46

5 - 47
Guidelines for Environmentally Friendly Designs
1. Make products recyclable2. Use recycled materials3. Use less harmful ingredients4. Use lighter components5. Use less energy6. Use less material
47

5 - 48
Product Documents
Engineering drawing Shows dimensions, tolerances, and
materials Shows codes for Group Technology
Bill of Material Lists components, quantities and where
used Shows product structure
48

5 - 49
Engineering Drawings
49

5 - 50
Bills of MaterialBills of MaterialBOM for Panel Weldment
NUMBER DESCRIPTION QTY
A 60-71 PANEL WELDM’T 1
A 60-7 LOWER ROLLER ASSM. 1R 60-17 ROLLER 1R 60-428 PIN 1P 60-2 LOCKNUT 1
A 60-72 GUIDE ASSM. REAR 1R 60-57-1 SUPPORT ANGLE 1A 60-4 ROLLER ASSM. 102-50-1150 BOLT 1
A 60-73 GUIDE ASSM. FRONT 1A 60-74 SUPPORT WELDM’T 1R 60-99 WEAR PLATE 102-50-1150 BOLT 1
50

5 - 51
Bills of MaterialBills of Material
Hard Rock Cafe’s Hickory BBQ Bacon Cheeseburger
DESCRIPTION QTY
Bun 1Hamburger patty 8 oz.Cheddar cheese 2 slicesBacon 2 stripsBBQ onions 1/2 cupHickory BBQ sauce 1 oz.Burger set Lettuce 1 leaf Tomato 1 slice Red onion 4 rings Pickle 1 sliceFrench fries 5 oz.Seasoned salt 1 tsp.11-inch plate 1HRC flag 1
51

5 - 52
Group Technology Scheme
Parts grouped into families with similar characteristics
Coding system describes processing and physical characteristics
Part families can be produced in dedicated manufacturing cells
52

5 - 53
Group Technology Scheme
(a) Ungrouped Parts(b) Grouped Cylindrical Parts (families of parts)
Grooved Slotted Threaded Drilled Machined
53

5 - 54
Group Technology Benefits1. Improved design2. Reduced raw material and purchases3. Simplified production planning and control4. Improved layout, routing, and machine
loading5. Reduced tooling setup time, work-in-
process, and production time
54

5 - 55
Documents for Production
Assembly drawing Assembly chart Route sheet Work order Engineering change notices (ECNs)
55

5 - 56
Assembly Drawing
Shows exploded view of product
Details relative locations to show how to assemble the product
56

5 - 57
Assembly Chart1
2
3
4
5
6
7
8
9
10
11
R 209 Angle
R 207 Angle
Bolts w/nuts (2)
R 209 Angle
R 207 Angle
Bolt w/nut
R 404 Roller
Lock washer
Part number tag
Box w/packing material
Bolts w/nuts (2)
SA1
SA2
A1
A2
A3
A4
A5
Leftbracket
assembly
Rightbracket
assembly
Poka-yoke inspection
Identifies the point of production where components flow into subassemblies and ultimately into the final product
57

5 - 58
Route Sheet
Lists the operations and times required to produce a component
Setup OperationProcess Machine Operations Time Time/Unit
1 Auto Insert 2 Insert Component 1.5 .4 Set 562 Manual Insert Component .5 2.3
Insert 1 Set 12C3 Wave Solder Solder all 1.5 4.1
components to board
4 Test 4 Circuit integrity .25 .5test 4GY
58

5 - 59
Work Order
Instructions to produce a given quantity of a particular item, usually to a schedule
Work Order
Item Quantity Start Date Due Date
Production DeliveryDept Location
157C 125 5/2/08 5/4/08
F32 Dept K11
59

5 - 60
Engineering Change Notice (ECN) A correction or modification to a
product’s definition or documentation Engineering drawings
Bill of material
Quite common with long product life cycles, long manufacturing lead times, or
rapidly changing technologies
60

5 - 61
Product Life-Cycle Management (PLM)
Integrated software that brings together most, if not all, elements of product design and manufacture Product design
CAD/CAM, DFMA
Product routing
Materials
Assembly
Environmental
61

5 - 62
Transition to Production
Know when to move to production Product development can be viewed as
evolutionary and never complete Product must move from design to
production in a timely manner Most products have a trial production
period to insure producibility Develop tooling, quality control, training Ensures successful production
62

5 - 63
Transition to Production
Responsibility must also transition as the product moves through its life cycle Line management takes over from design
Three common approaches to managing transition Project managers Product development teams Integrate product development and
manufacturing organizations
63

5 - 64
End of Chap. 1
64