Embed Size (px)
Citation preview

Millets in PDS Study LANSA MSSRF
Introduction of Millets in PDS
Lessons from Karnataka
A REPORT
by
S.C. Rajshekar
S Raju
June, 2017
M S Swaminathan Research Foundation Third Cross Street, Taramani Institutional Area,
Chennai www.mssrf.org

Millets in PDS Study LANSA MSSRF
MSSRF / RR / 17 / 41
Acknowledgement
This MSSRF led study under the LANSA Research Programme Consortium
was prepared by Mr. S C Rajshekar, Proprietor, Symbiotec Research
Associates, Bengaluru and Mr S Raju, Senior Research Fellow, MSSRF,
Chennai.
About LANSA
Leveraging Agriculture for Nutrition in South Asia (LANSA) is an international
research partnership. LANSA is finding out how agriculture and agri-food
systems can be better designed to advance nutrition. LANSA is focused on
policies, interventions and strategies that can improve the nutritional status of
women and children in South Asia. LANSA is funded by UK aid from the UK
government. The views expressed do not necessarily reflect the UK
Government's official policies. For more information see
www.lansasouthasia.org

Millets in PDS Study LANSA MSSRF
List of Abbreviations
AAY Antyodaya
APDAI Andhra Pradesh Drought Adaptation Initiatives
APDS Alternate Public Distribution System
APMC Agriculture Produce Marketing Committee
BPL Below Poverty Line
CAGR Compounded Annual Growth Rate
CWC Central Warehousing Corporation
DDS Deccan Development Society
FCI Food Corporation of India
FPS Fair Price Shop
GoK Government of Karnataka
Ha. Hectare
KAPRICOM Karnataka Agricultural Price Commission
KFCSC Karnataka Food and Civil Supplies Corporation
KSCMF Karnataka State Cooperative Marketing Federation
LANSA Leverage Agriculture for Nutrition in South Asia
MSP Minimum Support Price
MSSRF M.S. Swaminathan Research Foundation
MT Metric Ton
NFSA National Food Security Act
PDS Public Distribution System
qtl Quintal
RTC Right to cultivation
Rs. Rupees
SHG Self-help Group
SWC State Warehousing Corporation
WASSAN Watershed Support Services and Activities Network
Millets in PDS Study LANSA MSSRF
Table of Contents
Contents 1 Background ........................................................................................................ 1
2 Millets in PDS: Karnataka’s Approach ................................................................ 2
3 Objective ............................................................................................................ 5
4 Approach and Methodology................................................................................ 5
4.1 Detailed Methodology ................................................................................. 6
4.1.1 Desk review of available data and literature ......................................... 6
4.1.2 Interviews with key stakeholders .......................................................... 6
4.1.3 Field survey.......................................................................................... 6
4.1.4 Selection of Districts and Sample Households ..................................... 6
4.1.5 Desk review of DDS and WASSAN ...................................................... 7
4.2 Use of Remote Sensing (RS) to establish area and production of selected crops ..... 8
5 Key Findings from the Sample Surveys .............................................................. 9
5.1 Farmer Survey ............................................................................................ 9
5.1.1 Relative Importance of Millets for Farmers ........................................... 9
5.1.2 Yield and cost of cultivation ................................................................ 10
5.1.3 Experience of farmers in selling under MSP procurement .................. 12
5.2 Consumer survey ...................................................................................... 15
5.2.1 Composition of Cereals & Millets in Food Basket of a Household ...... 15
5.2.2 Sources of Foodgrains ....................................................................... 16
5.2.3 Monthly Expenditure on Market Purchase of Grains........................... 18
5.2.4 Grain of first choice ............................................................................ 19
5.2.5 Quality of Ragi/Jowar in PDS ............................................................. 21
5.2.6 Responses to increasing millets and reducing rice in PDS ................. 21
6 Observations & Discussion............................................................................... 22
6.1 Summary of key findings from Farmer Survey ........................................... 22

Millets in PDS Study LANSA MSSRF
6.2 Summary of Findings from Consumer Survey ........................................... 22
6.3 Procuring Ragi/Jowar for PDS – Key Issues ............................................. 23
6.3.1 Production – Is there sufficient millet being produced? ....................... 24
6.3.2 Farmers as Consumers – Compounding the Problem ........................ 27
6.3.3 Price & Procurement Window – Getting it Right ................................. 27
6.3.4 Physical Procurement – That in itself is a challenge ........................... 28
6.3.5 Getting the Right Procurement Agency .............................................. 30
6.3.6 Local production, procurement and local distribution – Is this better? . 30
6.4 Impact of Millets in PDS – On Farmers ..................................................... 31
6.5 Impact of Millets in PDS – On Consumers ................................................ 32
6.6 Conclusions .............................................................................................. 33
7 Issues to be considered in Introducing Millets in PDS ...................................... 33
Annexure 1: Questionnaires used in the study ........................................................ 35
1. Farmers’ Survey ........................................................................................... 35
2. Consumer Survey ......................................................................................... 40
Annexure 2: Sample Characteristics: Farmers’ Survey ............................................ 45
Annexure 3: Sample Characteristics: Consumer Survey ......................................... 48
Annexure 4: Cost of cultivation and cost of production of millets ............................. 51

Millets in PDS Study LANSA MSSRF
List of Tables Table 5.1: Percent respondents vs. percent area under millet ................................... 9
Table 5.2: Yield and cost of cultivation of millets (primary survey 2016-17) ............. 10
Table 5.3: Cost of cultivation and production (In-depth interviews 2016-17) ............ 11
Table 5.4: Cost of cultivation of millets - Various sources ........................................ 12
Table 5.5: Farmers' experience: Price, payment time & market distance ................. 12
Table 5.6: Satisfaction rating for checking quality .................................................... 13
Table 5.7:Satisfaction rating for quantity measurement ........................................... 13
Table 5.8: Production versus market arrivals in APMCs .......................................... 14
Table 5.9: Satisfaction rating for physical transaction process ................................. 15
Table 6-1: Compounded Annual Growth Rate (1998-2012) of Area under various crops 24
Table 6.2: Comparison of Area Under Millets: Govt. Data vs. Satellite Data ............ 25
Table 6.3: Area under millets- GIS 2005-2015......................................................... 26
Table 6.4: Production of millets vs. PDS requirement .............................................. 26
Table 7.1: Production vs. requirement of millets for PDS ......................................... 34
List of Figures Figure 2.1: Millets in PDS: GoK Approach ................................................................. 3
Figure 5.1: Average grains consumed/month/household ......................................... 16
Figure 5-2: Source-wise grains consumed-Rural ..................................................... 17
Figure 5.3: Source-wise grains consumed (Urban) .................................................. 18
Figure 5.4: Monthly expenditure on grain purchased from market ........................... 19
Figure 5.5: Choice of Grains - Dharwad & Gadag ................................................... 20
Figure 5.6: Choice of Grains - Mandya & Tumkur .................................................... 20
Figure 5.7: Rating of millet quality in PDS ............................................................... 21

Millets in PDS Study LANSA MSSRF

Millets in PDS Study LANSA MSSRF
1
Introduction of Millets in PDS Lessons from Karnataka
1 Background
“How can South Asian agriculture and related food policies and interventions be
designed and implemented to increase their impacts on nutrition, especially the
nutritional status of children and adolescent girls?” is the core question addressed by
the research programme on Leveraging Agriculture for Nutrition in South Asia
(LANSA). A research theme under this is: How do policies and strategies influence
poverty and the nutrition impact of agriculture?
South Asia including India houses a large population of malnourished people. Apart
from hunger, micronutrient malnutrition, especially among pregnant and lactating
women, children and adolescent girls is widespread in India, as reiterated by the
latest report of the National Family Health Survey. The National Food Security Act,
2013 (NFSA)1 seeks to: “provide for food and nutritional security in human life cycle
approach, by ensuring access to adequate quantity of quality food at affordable
prices....”p1. The Act sought to bring nearly 75 per cent of rural and 50 per cent of
urban population under the public distribution system (PDS)2. Public distribution of
foodgrains began in India in 1942 and was institutionalized in the 1960’s with the
establishment of the Food Corporation of India in 1965. Currently, India runs the
world’s largest public food distribution system that delivers largely rice and wheat
through designated Fair Price Shops (FPS) throughout the country. However, it is
well established that rice3 and wheat alone are not adequate to meet the nutritional
requirements of these segments. The NFSA provided for the distribution of millets,
referred to as ‘coarse grains’ in the PDS.
Given that millet is a naturally nutrient dense agricultural produce, making it available
through the PDS will enable poor and vulnerable populations access the cereal and
could help address the problem of hidden hunger. Effective implementation and
1 http://indiacode.nic.in/acts-in-pdf/202013.pdf
2 Ibid page 3 Section 3(2)
3 Longvah, T., Ananthan,R., Bhaskarachary,K and Venkiah,K. 2017. Indian Food Composition Tables. National Insititute of Nutrition, Indian Council of Medical Research, Department of Health Research, Ministry of Health and Family Welfare, Government of India

Millets in PDS Study LANSA MSSRF
2
delivery of millets under the PDS can have far reaching implications for addressing
the problem of malnutrition. Even though the NFSA provided for distributing millets
through the PDS, only the state of Karnataka4 seems to have introduced this.
Chhattisgarh has pioneered a model of local procurement and local distribution of
pulses, also a nutritionally dense food, through the PDS while Tamil Nadu has been
distributing pulses through the PDS for the last decade; but Karnataka is the first in
millets.
This study examines all aspects of introduction of millets in the PDS in Karnataka,
from production, procurement, storage, pricing, supply-demand gap and consumer
preference.
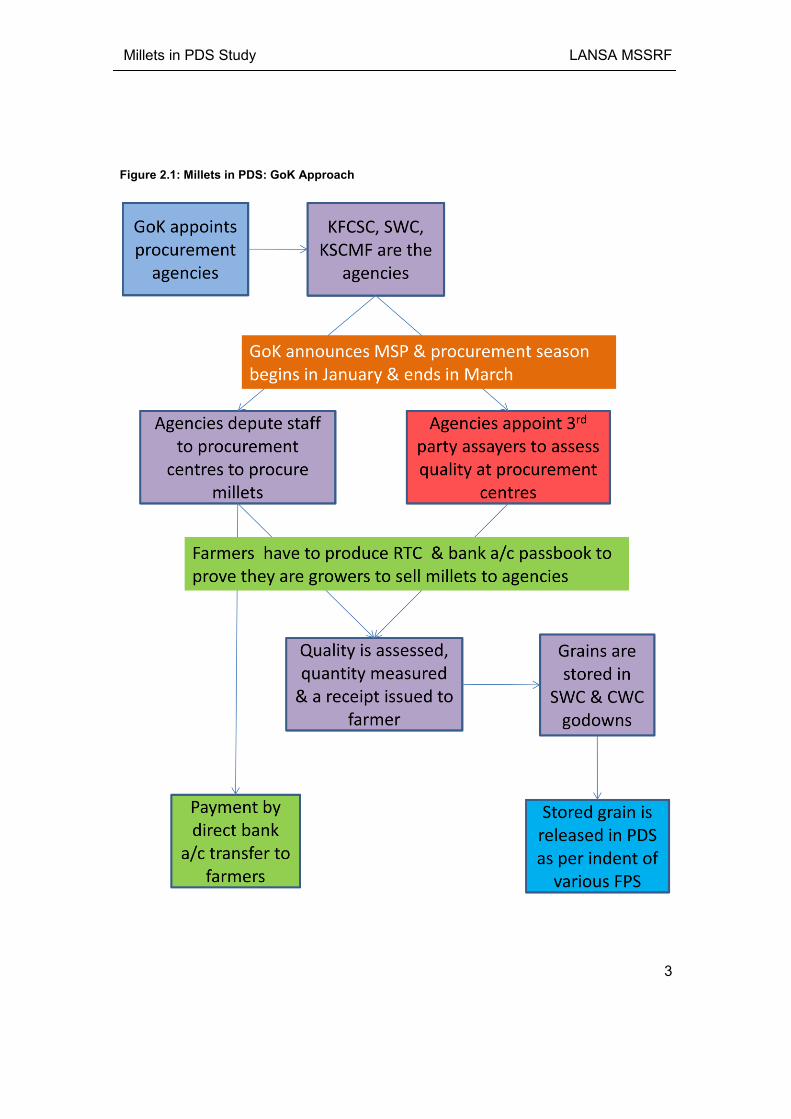
2 Millets in PDS: Karnataka’s Approach
The Government of Karnataka (GoK) initiated procurement of millets from farmers
and distribution (finger millet / ragi in south Karnataka and sorghum / jowar in north
Karnataka) through PDS in 2013-14. The scheme was christened “Anna
bhagyadinda Krishi bhagya” (Farmer welfare through food welfare) with the intention
that by procuring these millets from farmers, substantial cash would flow to rural
households while, PDS cardholders would get access to nutritious foodgrains at low
prices. Figure 2.1 explains the process adopted by GoK to procure millets from
farmers.
4 Karnataka has been distributing finger millet (ragi) in south Karnataka and sorghum (jowar)
in north Karnataka through PDS since 2013-14.
Millets in PDS Study LANSA MSSRF
3
Figure 2.1: Millets in PDS: GoK Approach

Millets in PDS Study LANSA MSSRF
4
Procurement commenced in the year 2013-14 but there was limited success. During
2014-15, the GoK tasked the Karnataka Agricultural Price Commission (KAPRICOM)
to study the issue and suggest remedial measures to increase procurement of
millets. KAPRICOM found that over the last two decades, area under these crops
were steadily declining and profitability vis-à-vis other competing crops had fallen
sharply, leading to grower apathy towards these crops. To remedy the situation, the
key recommended actions were:
Increase minimum support price (MSP) to ragi and jowar to provide at least
20%-30% mark-up5 over cost of cultivation as estimated by KAPRICOM
Reduce incentives being given to maize and cotton, which were the chief
competitors to ragi and jowar
Aggressively promote millets as an appropriate crop to adapt to changing
climatic situation in the state
Invest in carrying out research to produce new varieties that will provide high
yields, thus making it attractive to farmers to grow the crops.
Accordingly, the GoK increased the MSP from Rs.1500/quintal for ragi and
Rs.1800/quintal for jowar (maldandi6 variety) in 2013-14 to Rs.2000/qtl and
Rs.2300/qtl for ragi and jowar respectively in 2014-15. Procurement of ragi increased
to 1.36 lakh MT (metric tons) and 6839 MT for jowar in 2014-15. Encouraged by this,
the MSP for ragi was further enhanced in 2015-16 to Rs.2250/qtl and procurement
increased to 1.5 lakh MT. However, following the failure of jowar crop, there was no
procurement of jowar in 2015-16. The objectives of this study were framed against
this background.
5 Prof. M.S. Swaminathan had recommended that farmers should be assured at least 50%
margin over cost of cultivation to make a crop attractive for the farmer to continue cultivating it 6 Only maldandi, a traditional variety of jowar (called bili jola or white jowar) that is grown in
north Karnataka during rabi is preferred as a foodgrain. The hybrid variety grown during kharif is not eaten in the area. Therefore, the GoK procures only this variety and announces a separate MSP for it.
Millets in PDS Study LANSA MSSRF
5
3 Objective
Examine all aspects of introduction of millets in the PDS in Karnataka, covering
issues related to production, procurement, storage, pricing, and consumer
preference.
More specifically, the study addresses issues such as:
Is there sufficient production of the millet being introduced to meet the
requirements of PDS as per NFSA?
What is the procurement mechanism in terms of timing of procurement
and payment to supplying farmers? Does the agency have the
required expertise?
What is the role of the Food Corporation of India in procurement of
millets?
Is local production, procurement and supply through PDS a viable
solution for supplying millets?
What is an appropriate price to encourage farmers to grow and supply
the millet?
What are the key issues in storing the procured millet? Is it different
from storing rice and wheat, in which the agency is usually
experienced?
Does the consumer and more specifically, the meal-maker (usually
woman of the house) prefer millet over rice and wheat? If so, what is
the preferred quantity per month for a household of five persons?
4 Approach and Methodology
The study was carried out in select districts of Karnataka where ragi and jowar are
grown and are being distributed under PDS. Broadly, the study used the techniques
of interviews/focus group discussions with key stakeholders, household interviews
based on questionnaires covering consumers and producers in rural areas and
consumers in urban areas (in both cases PDS beneficiaries only), field observation of
procurement and storage of millets, etc.

Millets in PDS Study LANSA MSSRF
6
4.1 Detailed Methodology
4.1.1 Desk review of available data and literature
A desk review of available information on the introduction of millets in PDS in
Karnataka, alternative-PDS systems in Telangana and Andhra Pradesh was carried
out.
4.1.2 Interviews with key stakeholders
Interviews were carried out with policy makers, implementers (government, NGOs),
consumers, etc., to gain a good understanding of the issues relevant to the
objectives of the study. Karnataka Food and Civil Supplies Corporation, Department
of Food, Civil Supplies and Consumer Affairs, Government of Karnataka, Karnataka
Agriculture Price Commission, Central Warehousing Corporation, Karnataka State
Agricultural Marketing Cooperative Federation, third party assayers hired by grain
procurement agencies and Food Corporation of India were the main agencies
approached in this connection. Initiatives by two NGOs, Deccan Development
Society (DDS) and WASSAN, who piloted efforts to promote millets under PDS in
Telangana and Andhra Pradesh were also studied.
4.1.3 Field survey
A questionnaire based field survey was carried out in 2 districts each in south
Karnataka (ragi area) and north Karnataka (jowar area). The survey schedules are in
annexure 1. A sample of 400 rural and urban PDS consumers put together was
covered in the survey such that 100 sample households were covered per district. In
each district 50 urban samples from the district head quarters and 50 rural samples
from a maximum of 5 Gram Panchayats from any one taluka was drawn. The field
survey focused on consumer preferences for millets vis-à-vis rice and wheat and
quantity of millets desired per month per family.
In addition, 200 farmers (50 farmers per district) were interviewed to gather
information on issues related to production, pricing and procurement.
4.1.4 Selection of Districts and Sample Households
The Karnataka Government started procuring millets (ragi & jowar) and supplying
through PDS from 2013-14. Data from the Karnataka Food and Civil supply

Millets in PDS Study LANSA MSSRF
7
Corporation (KFSCS) dashboard was analyzed to understand the procurement and
distribution of millets.
Districts that had the highest procurement7 of ragi/jowar and distribution8 of these
grains through the PDS were selected for carrying out the study. Mandya and
Tumkur were selected for ragi and Dharwad and Gadag for jowar. In each of these
districts, the taluka with the highest procurement was selected and within the taluka,
35 farmers randomly chosen from a list of farmers who had supplied ragi / jowar
under Minimum Support Price (MSP) based procurement were interviewed. In
addition, 15 farmers who had not supplied under the MSP procurement were also
interviewed.
The same 50 farming households (that were covered under the farmer survey) were
also covered under the rural consumer survey after ensuring that they were either
BPL (Below Poverty Line) / AAY (Antyodaya) PDS cardholders and thus eligible to
receive grains under PDS. In the same district, 50 urban households were selected in
the district headquarters to carry out the urban consumer survey. In order to choose
either BPL or AAY consumers, the survey was conducted in urban slums.
4.1.5 Desk review of DDS and WASSAN
A report prepared by Glocal Research and Consultancy Services, Hyderabad gave
information on the alternate PDS initiative of DDS in Telangana9.
WASSAN (Watershed Support Services and Activities Network) had piloted a SHG
managed PDS that distributed ragi in a few villages in Anantapur district in Andhra
Pradesh during 2009, under the World Bank supported Andhra Pradesh Drought
Adaptive Initiatives (APDAI) project. This pilot has since been discontinued.
Published reports were reviewed10.
7 http://www.kfcsc.kar.nic.in/kfcscdd/pc_rep_dist.aspx?id=BAXI%2fIL7WX4%3d (provides
data on procurement of ragi and jowar during 2015-16) 8 http://kfcsc.kar.nic.in/kfcscdd/dist_ret_pt_lift_stat_t.aspx (provides data on distribution of
ragi/jowar) 9http://www.vikalpsangam.org/static/media/uploads/Resources/alternative_pds_at_dds_sriniv
as_thapa_2004.pdf 10
http://www.dhan.org/smallmillets/docs/report/Introducing_millets_into_Public_Distribution_System.pdf

Millets in PDS Study LANSA MSSRF
8
4.2 Use of Remote Sensing (RS) to establish area and production of
selected crops
One of the key issues in introducing millets into the PDS is often lack sufficient
quantity of produce in the area. In Karnataka, as per a study carried out by the
Karnataka Agriculture Prices Commission11, area under ragi and jowar has been
decreasing rapidly in the last two decades, ceding areas to maize and cotton. The
study recommended urgent measures to increase area and productivity of ragi and
jowar to ensure that it is available in sufficient quantities for procurement and
distribution through the PDS.
As per the NSSO 68th round survey (2011-12) on household consumer expenditure12,
40% of the population in Karnataka consumed jowar while nearly 45% consumed
ragi. However, only 15% of jowar and 19% of all ragi consuming households
produced these millets themselves; meaning the rest purchased it. Further, only 24%
jowar and 34% ragi consuming rural households produced the millets themselves.
Thus, even in rural areas as per the NSSO 68th round, nearly 60-70% households
consuming the millets did not produce it themselves.
As per crop area statistics of the Government of Karnataka13, area and production of
these two millets has been falling since early 2000s. If that is the case then, where is
the 60-70% of the households buying these millets from for consumption?
In order to better understand the issue and address the first research question raised
in Section 2 independently, the remote sensing and GIS lab in MSSRF carried out a
study to provide the following details:
o For selected districts in Karnataka, trace the area under Ragi and
Jowar over the period 2005, 2009 and 2015
o For the same geography and period, trace if area under ragi and
jowar is being taken over by other crops such as cotton, maize, etc.
11 http://kapricom.org/downloads/reports/KAPC_Report1_Oct2014.pdf (report is in Kannada
only) 12
https://www.google.co.in/search?q=NSSO+68th+round+consumer+expenditure&oq=NSSO+68th+round+consumer+expenditure&aqs=chrome..69i57j0.7887j0j4&sourceid=chrome&ie=UTF-8 13
http://kapricom.org/crop_production_statistics.html

Millets in PDS Study LANSA MSSRF
9
5 Key Findings from the Sample Surveys
5.1 Farmer Survey
Tables in Annexure 2 shows the distribution of the sample of farmers surveyed based
on socio economic characteristics by districts and sector.
The focus of the farmer survey was to:
assess importance of the millet crop in the portfolio of the farmer
estimate cost/qtl of grain produced
assess experience and level of satisfaction of the farmer with selling under
MSP procurement vis-a-vis selling to the market
Majority of the farmers in Dharwad and Gadag district have medium and large
operational land, while in Mandya and Tumkur districts, majority of farmers are small
and semi-medium operational land holders (Table 10). Jowar is chiefly cultivated in
rabi while ragi is cultivated in kharif under rain fed conditions in Tumkur and under
irrigated conditions in Mandya.
5.1.1 Relative Importance of Millets for Farmers
Table 5.1: Percent respondents vs. percent area under millet
District Crop
Percentage of
cultivated land under
the crop <25%
25% to
<50%
50% to
<75% > 75 % Total
Dharwad Jowar
% of Respondents
26% 40% 21% 13% 100%
Gadag Jowar 31% 55% 14% 0% 100%
Mandya Ragi 9% 33% 33% 26% 100%
Tumkur Ragi 0% 2% 4% 94% 100%
Source: Primary survey 2016-17
Table 5.1 shows that a substantial proportion of the land cultivated in rabi (jowar) and
kharif (ragi) is devoted to these millets in the study districts. In Tumkur, 98% of the
respondents reported that 50% or more of their land was under ragi during kharif
indicating the lack of alternatives in the area. In contrast, only 60% of farmers in
Mandya reported 50% or more area under ragi.
In Dharwad and Gadag, 34% and 14% of the respondents respectively reported 50%
or more under jowar during rabi indicating the choices available to them. However, a
whopping majority of the respondents reported that they devoted 25% or more area

Millets in PDS Study LANSA MSSRF
10
to the crop, indicating its importance in their crop choices. Ragi and jowar are the key
foodgrains consumed by the respondents and these crops also provide fodder for
their cattle, which is why a substantial proportion of area is devoted to these crops in
the study area.
5.1.2 Yield and cost of cultivation
Table 5.2 shows the reported yield and costs of cultivation for jowar and ragi in the
study areas based on the primary survey of farmers. These figures represent an
unaided response from the farmers to the question of yield and costs.
Table 5.2: Yield and cost of cultivation of millets (primary survey 2016-17)
District Crop
Mean yield
qtls/acre
Mean cost of
cultivation Rs./acre
Mean production cost of
grain Rs./qtl
Dharwad Jowar 7.6 3028 400
Gadag Jowar 4.2 4916 1184
Mandya Ragi 16.8 11600 689
Tumkur Ragi 5.3 7560 1426
After the questionnaire based farmer survey was completed, a series of in-depth
interviews were conducted with several farmers who had responded during the
primary survey. In-depth interviews focused on making a detailed assessment of
cost of cultivation, issues in selling under MSP based procurement, etc. Table 5.3
presents the results of responses to questions on cost of cultivation and yield from
farmers that are based on in-depth interviews. (See Annexure 4 for the detailed
table)

Millets in PDS Study LANSA MSSRF
11
Table 5.3: Cost of cultivation and production (In-depth interviews 2016-17)
Cost of Cultivation Rs./acre Cost of Production Rs./qtl
District Crop
Yield
qtls/acre
A1 14
Costs
A1 + FL
Costs
C3
Costs
A1
Costs
A1 + FL
Costs
C3
Costs
Dharwad Jowar 8 10124 11804 19267 1265 1869 2408
Gadag Jowar 5 6195 7575 11529 1239 1738 2306
Mandya Ragi 18 23773 25154 37495 1321 1606 2083
Tumkur Ragi 12 16356 18936 27470 1636 1615 2747
Source: In-depth farmer interviews 2016-17
As in most cost of cultivation assessments, the key reasons for differences between
figures reported when asked without going into details (primary survey, which is
mostly top of mind recall) and when asked for step-by-step with details (in-depth
interviews, which is a more considered view of the respondent) are:
Not accounting for own labour
Considering only out of pocket cash expenses
Not accounting for use of owned equipment, animal power and farm yard
manure, own seeds, etc.
Not accounting for labour for threshing, winnowing, drying, bagging, baling
straw, transportation from farm to home and from home to market
Not accounting for rental value of land and managerial time spent by the
farmer in managing the farm enterprise.
Table 5.4 shows the cost/qtl of millets as estimated by various agencies15, which
correlate well with the findings from the in-depth interviews. KAPRICOM estimates
are higher since they are based on C3 costs and correlate well with figures in table
5.3. Therefore, for further analysis in this study, figures from the in-depth interviews
are used.
14 A1 costs = All cash costs incurred by farmer; FL = Family labour at opportunity cost; C3 =
Total cost including A1 + FL + Imputed cost of land rental and managerial costs of the farmer 15
Taken from http://kapricom.org/downloads/reports/KAPC_Report1_Oct2014.pdf page no.18 and KAPC report December 2015

Millets in PDS Study LANSA MSSRF
12
Table 5.4: Cost of cultivation of millets - Various sources
Source Crop
Cost of cultivation
Rs./qtl
Department of Economics and Statistics,
GoK
Jowar 1992
Ragi 1556
Commissionerate of Agriculture, GoK
Jowar 1711
Ragi 1228
UAS, Bengaluru
Jowar 1834
Ragi 2306
KAPRICOM (C3 costs) Jowar (Vijayapura) 2931
Ragi (Tumkur) 2861
5.1.3 Experience of farmers in selling under MSP procurement
Farmers were asked to compare the experience of selling in the open market versus
selling to the government under MSP procurement.
5.1.3.1 Price, payment duration and market distance
Table 5.5 shows a comparison of farmers’ responses on the parameters of price,
time taken to receive payment and distance to market/place of procurement.
Table 5.5: Farmers' experience: Price, payment time & market distance
Districts Dharwad Gadag Mandya Tumkur
Crop Jowar Ragi
Price Rs.
(per/qtl)
Open 2007 1900 1707 1785
Govt. 2239 2258 2130 2052
Payment
duration (days)
Open 1.33 1.11 1.46 1.21
Govt. 64 22.33 47.36 39.65
Market
distance (km)
Open 16.44 21.8 NA 13.21
Govt 14.81 18.83 11.02 16.48
Source: Primary survey 2016-17
Price is consistently higher under MSP procurement, but number of days taken by
the farmer to receive payment is very high under government procurement as
compared to selling in the market. In fact, this was the main complaint that farmers
had about selling to the government - interminable delays in receiving payments.
Discussions with KFCSC revealed that while some time was required to process the
payment and effect direct account transfer, quite often, KFCSC itself had no working

Millets in PDS Study LANSA MSSRF
13
capital to pay for the goods procured since it was dependent on the GoK releasing
the funds for procurement16.
5.1.3.2 Satisfaction rating: Quality, quantity and transaction process
Tables 5.6 (quality assessment process), 5.7 (quantity measurement) and 5.8
(overall transaction process) presents the satisfaction levels of farmers as reported in
the farmers’ survey.
Table 5.6: Satisfaction rating for checking quality
District Crop Very
satisfied Satisfied
Moderately
satisfied
Moderately
unsatisfied
Very
unsatisfied
No
Answer
Open Market
Dharwad Jowar
0.0 36.0 64.0 0.0 0.0 0.0
Gadag 28.6 42.9 20.4 0.0 8.2 0.0
Mandya Ragi
40.8 46.9 6.1 0.0 0.0 6.1
Tumkur 4.0 22.0 2.0 0.0 0.0 72.0
Government procurement
Dharwad Jowar
58.0 22.0 2.0 0.0 0.0 18.0
Gadag 18.4 51.0 6.1 2.0 0.0 22.4
Mandya Ragi
40.8 18.4 16.3 6.1 4.1 14.3
Tumkur 20.0 48.0 2.0 0.0 0.0 30.0
Source: Primary survey 2016-17
Table 5.7:Satisfaction rating for quantity measurement
District Crop Very
satisfied Satisfied
Moderately
satisfied
Moderately
unsatisfied
Very
unsatisfied
No
Answer
Open Market
Dharwad Jowar
0.0 32.0 66.0 2.0 0.0 0.0
Gadag 18.4 55.1 18.4 8.2 0.0 0.0
Mandya Ragi
40.8 49.0 6.1 0.0 0.0 4.1
Tumkur 4.0 12.0 10.0 2.0 0.0 72.0
Government procurement
Dharwad Jowar
58.0 18.0 2.0 0.0 0.0 22.0
Gadag 16.3 53.1 4.1 0.0 2.0 24.5
Mandya Ragi
51.0 20.4 6.1 4.1 4.1 14.3
Tumkur 18.0 30.0 20.0 0.0 0.0 32.0
Source: Primary survey 2016-17
16 Procurement ends in March, which is the time governments try to restrict cash expenditure.

Millets in PDS Study LANSA MSSRF
14
Overall, more farmers reported being “very satisfied” with the government’s system
of checking quality and measuring quantity during procurement as compared to their
experience whilst selling in the open market. During our in-depth interviews with
farmers and traders, it became clear that most of the farmers hardly take their
produce to Agriculture Produce Market Committee (APMC) yards to sell. Most sell to
the nearest kirana shop that also doubles up as a collection point for larger traders.
An analysis of the total production of ragi and jowar in Karnataka and its arrivals in
APMC markets in the state shows (See table 5.8) that less than 5% of the total
production comes to formal markets.
Table 5.8: Production versus market arrivals in APMCs
Year
Ragi
production
(lakh MT)
Ragi
market
arrivals
qtls
% of
production
arriving in
APMC
Jowar
production
(lakh MT)
Jowar
market
arrivals
qtls
% of
production
arriving in
APMC
2005 16.14 360616 2.23% 13.59 479229 3.53%
2006 16.56 408013 2.46% 14.79 516161 3.49%
2007 6.65 305219 4.59% 11.3 428611 3.79%
2008 13.68 326687 2.39% 16.7 529952 3.17%
2009 12.33 450146 3.65% 14.84 683256 4.60%
2010 11.96 624080 5.22% 12.96 553180 4.27%
2011 15.88 888332 5.59% 14.67 410068 2.80%
2012 12.72 609029 4.79% 11.66 669121 5.74%
2013 9.74 472630 4.85% 13.15 742192 5.64%
2014 12.57 558158 4.44% 13.17 563597 4.28%
2015 12.98 462718 3.56% 11.74 518413 4.42%
Source: GOI Website- dacnet & FRE/Final Estimates of DE&S Bangalore &
http://krishimaratavahini.kar.nic.in/reports/Main_Rep.aspx
Table 5.9 shows that farmers are moderately unsatisfied with government
procurement processes in Dharwad and Tumkur,, while in Gadag and Mandya, they
are satisfied. On the other hand selling to open market has been rated
overwhelmingly satisfied or very satisfied.

Millets in PDS Study LANSA MSSRF
15
Table 5.9: Satisfaction rating for physical transaction process
District Crop Very
satisfied Satisfied
Moderately
satisfied
Moderately
unsatisfied
Very
unsatisfied
No
Answer
Open Market
Dharwad Jowar
86.0 12.0 2.0 0.0 0.0 0.0
Gadag 28.6 63.3 2.0 4.1 2.0 0.0
Mandya Ragi
85.7 2.0 0.0 0.0 0.0 12.2
Tumkur 18.0 2.0 4.0 8.0 0.0 68.0
Government procurement
Dharwad Jowar
0.0 0.0 14.0 64.0 2.0 20.0
Gadag 14.3 51.0 8.2 4.1 0.0 22.4
Mandya Ragi
36.7 32.7 10.2 2.0 8.2 10.2
Tumkur 0.0 0.0 4.0 46.0 20.0 30.0
Source: Primary survey 2016-17
During in-depth interviews several farmers mentioned that whilst selling to the
government they had to endure long queues, lot of repeated paper work such as,
RTC (right to cultivation certificate) had to be signed by Village Accountant, Revenue
Inspector and Tahsildar, bank passbook copy had to be certified by bank manager
and sometimes RTC holder had to appear in person.
5.2 Consumer survey
Tables in Annexure 3 shows the distribution of the sample of consumers surveyed
based on socio economic characteristics by districts and rural and urban sectors.
The consumer survey focused on the following parameters:
Composition of cereals (rice and wheat) and millets (jowar and ragi) in the
food basket in a household
Average monthly consumption of these grains in a household
Sources of these grains (home grown, markets and PDS)
Price and average expenditure when it is purchased from the market
5.2.1 Composition of Cereals & Millets in Food Basket of a Household
Rice, jowar and wheat in Dharwad and Gadag and rice, ragi and wheat in Mandya
and Tumkur are the major cereals and millets that comprise the food basket of a

Millets in PDS Study LANSA MSSRF
16
household in both rural and urban areas. Based on the respondents reported
frequency and quantity of each grain consumed, the average quantity consumed per
month per household has been calculated and is presented in Figure 5.1.
Figure 5.1: Average grains consumed/month/household
It is seen that except in rural Dharwad and Gadag, rice is by far the single largest
grain consumed by households in all the districts across rural and urban areas.
Wheat and ragi/jowar are consumed in equal proportion in urban areas while in rural
areas, millet consumption is usually more than wheat. These estimates will be used
in the study to assess requirement of total millets under PDS.
5.2.2 Sources of Foodgrains
Figures 5.2 and 5.3 show the sources of cereals and millets consumed by rural and
urban households respectively in the study area. PDS, home grown and purchase
from market are the main sources of grain for a household.
Rice Wheat Jowar Rice Wheat Jowar Rice Wheat Ragi Rice Wheat Ragi
Dharwad Gadag Mandya Tumkur
Rural 15.15 22.71 16.74 30.00 10.03 40.00 35.01 10.65 36.53 36.53 31.48 24.98
Urban 29.61 26.34 27.48 29.97 21.08 28.38 46.98 34.16 28.12 34.88 26.33 22.67
0.00
5.00
10.00
15.00
20.00
25.00
30.00
35.00
40.00
45.00
50.00
kg
/mo
nth
/ho
use
ho
ld
Grains Consumed
Average Grains Consumed/Household/Month
Rural
Urban

Millets in PDS Study LANSA MSSRF
17
Figure 5-2: Source-wise grains consumed-Rural
Despite, PDS supply of rice, all areas reported that a significant proportion of their
rice consumption is purchased from markets, clearly indicating the strong preference
for rice in the food basket. Even in rice growing areas such as Mandya and parts of
Tumkur, purchase of rice is significant indicating that even the landless17 were
spending on eating rice. Similarly, a significant proportion of ragi/jowar is also
sourced from the market. In Dharwad, several respondents mentioned that during
rabi, farm workers were always paid wages in the form of maldandi jowar. In fact, the
wage for a season is increased or decreased depending on the yield that is recorded,
which in turn is largely dependent on how bountiful the monsoon was!
17 42% of the total rural households sampled were landless
0% 20% 40% 60% 80% 100% 120%
Rice
Wheat
Jowar
Rice
Wheat
Jowar
Rice
Wheat
Ragi
Rice
Wheat
Ragi
Dh
arw
ad
Ga
da
gM
an
dya
Tu
mk
ur
Sources of grains consumed in %
Source-wise grains consumed - Rural
Rural PDS Rural Home grown Rural Market

Millets in PDS Study LANSA MSSRF
18
Figure 5.3: Source-wise grains consumed (Urban)
Being urban consumers, grains are mainly sourced from the market. Except for
wheat, which is largely PDS sourced, rest are overwhelmingly purchased from the
market.
Overall, PDS as a source accounts for less than 25% of the ragi/jowar consumed by
both rural and urban customers.
5.2.3 Monthly Expenditure on Market Purchase of Grains
Figure 5.4 shows on an average how much each household spends on buying
cereals and millets from the market.
0% 20% 40% 60% 80% 100% 120%
Rice
Wheat
Jowar
Rice
Wheat
Jowar
Rice
Wheat
Ragi
Rice
Wheat
Ragi
Dh
arw
ad
Ga
da
gM
an
dya
Tu
mk
ur
Sources of grains consumed in %
Source-wise grains consumed - Urban
Urban PDS Urban Home grown Urban Market
Millets in PDS Study LANSA MSSRF
19
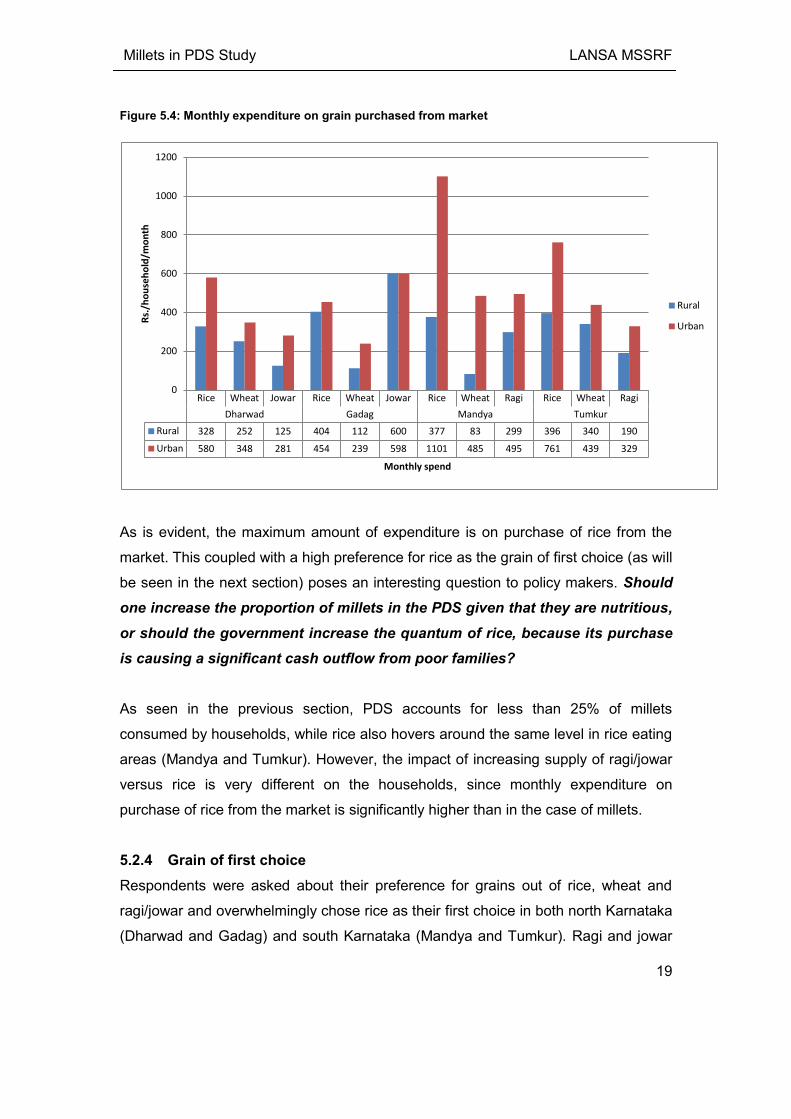
Figure 5.4: Monthly expenditure on grain purchased from market
As is evident, the maximum amount of expenditure is on purchase of rice from the
market. This coupled with a high preference for rice as the grain of first choice (as will
be seen in the next section) poses an interesting question to policy makers. Should
one increase the proportion of millets in the PDS given that they are nutritious,
or should the government increase the quantum of rice, because its purchase
is causing a significant cash outflow from poor families?
As seen in the previous section, PDS accounts for less than 25% of millets
consumed by households, while rice also hovers around the same level in rice eating
areas (Mandya and Tumkur). However, the impact of increasing supply of ragi/jowar
versus rice is very different on the households, since monthly expenditure on
purchase of rice from the market is significantly higher than in the case of millets.
5.2.4 Grain of first choice
Respondents were asked about their preference for grains out of rice, wheat and
ragi/jowar and overwhelmingly chose rice as their first choice in both north Karnataka
(Dharwad and Gadag) and south Karnataka (Mandya and Tumkur). Ragi and jowar
Rice Wheat Jowar Rice Wheat Jowar Rice Wheat Ragi Rice Wheat Ragi
Dharwad Gadag Mandya Tumkur
Rural 328 252 125 404 112 600 377 83 299 396 340 190
Urban 580 348 281 454 239 598 1101 485 495 761 439 329
0
200
400
600
800
1000
1200
Rs.
/ho
use
ho
ld/m
on
th
Monthly spend
Rural
Urban

Millets in PDS Study LANSA MSSRF
20
were the second most preferred with wheat coming a distant and distinct third. See
figures 5.5 and 5.6
Figure 5.5: Choice of Grains - Dharwad & Gadag
Figure 5.6: Choice of Grains - Mandya & Tumkur
0 20 40 60 80
Rank 1
Rank 2
Rank 3
Rank 4
% of respondents
Ra
nk
Choice of Grains - Dharwad & Gadag
Jowar
Wheat
Rice
0 20 40 60 80 100
1
2
3
4
% of respondents
Ra
nk
Choice of Grains- Mandya & Tumkur
Ragi
Wheat
Rice
Millets in PDS Study LANSA MSSRF
21
Some of the reasons given for the strong preference for rice were:
“Children like it”
“It is tasty”
“It is easy to prepare”
On the other hand, ragi and jowar were preferred for their nutritive value and the
need for strength by those doing hard physical labour. Interestingly, taste and
“children” liking it were not mentioned in favour of millets!
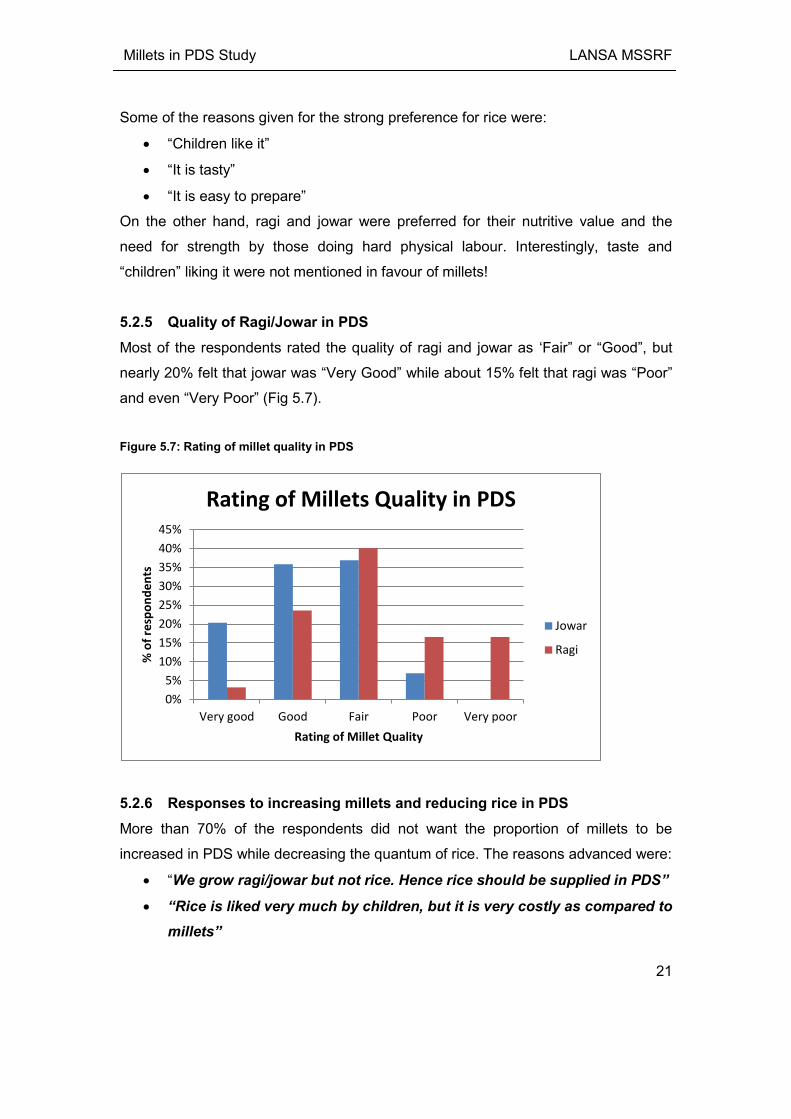
5.2.5 Quality of Ragi/Jowar in PDS
Most of the respondents rated the quality of ragi and jowar as ‘Fair” or “Good”, but
nearly 20% felt that jowar was “Very Good” while about 15% felt that ragi was “Poor”
and even “Very Poor” (Fig 5.7).
Figure 5.7: Rating of millet quality in PDS
5.2.6 Responses to increasing millets and reducing rice in PDS
More than 70% of the respondents did not want the proportion of millets to be
increased in PDS while decreasing the quantum of rice. The reasons advanced were:
“We grow ragi/jowar but not rice. Hence rice should be supplied in PDS”
“Rice is liked very much by children, but it is very costly as compared to
millets”
0%
5%
10%
15%
20%
25%
30%
35%
40%
45%
Very good Good Fair Poor Very poor
% o
f re
spo
nd
en
ts
Rating of Millet Quality
Rating of Millets Quality in PDS
Jowar
Ragi

Millets in PDS Study LANSA MSSRF
22
“Rice being given in PDS is not sufficient. We still have to spend a lot of
money to buy the rest from the market”
“We can buy ragi/jowar from farmers at less rate, but rice is not
available in our area with farmers”
6 Observations & Discussion
6.1 Summary of key findings from Farmer Survey
In the preceding sections, we found from the farmers’ survey that:
70% of farmers reported that 25% or more of their land was sown with
jowar/ragi. Most of the area was rainfed with only Mandya reporting some
irrigation for ragi cultivation.
Yields were very low for jowar at 0.4 MT/acre in Gadag and 0.8 MT/acre in
Dharwad. Ragi yields were better in Mandya at 1.5 MT/acre while in Tumkur
they were just 1.0 MT/acre.
MSP and wholesale market prices at APMC yards were frequently lower than
actual cost of cultivation (including family labour and own inputs).
However, less than 5% of total production came to these formal markets,
implying that most farmers may not have even received this rate. During
discussions with farmers, market rate that farmers actually got were
substantially lower. Ragi languished at just Rs.800-1200/qtl while jowar was
about Rs.1700-1800/qtl.
In fact, many farmers mentioned that after the new MSP of Rs.2250/qtl of ragi
was announced by the GoK, wholesale prices in informal markets also went
up to Rs.1800/qtl.
Overall, farmers were satisfied with the government procurement of millets,
although they felt that long delay in payments was an area of concern and
impediment to selling to the government. Many also felt that the paperwork
involved in the process was tedious.
6.2 Summary of Findings from Consumer Survey
The following are the key findings from the consumer survey:
Rice is by far the single largest item in a household’s food basket, except for
rural Dharwad and Gadag where jowar is. Ragi and jowar form about 25-45%
Millets in PDS Study LANSA MSSRF
23
of the food basket of a household in the study area, with urban areas scoring
lower than rural area.
A typical rural household in Dharwad and Gadag consumes as much as
30kg/month of jowar while in Mandya and Tumkur about 25-30kg/month of
ragi is consumed.
At a standard scale of issue of 10kg/month/household under PDS, jowar and
ragi thus would form about 30% of a family’s monthly consumption. However,
since millets are supplied only once in two months, the actual figure would be
half, i.e., 10-15%. Currently, most families are receiving far lesser than this.
Of the remaining quantity, nearly, 30-40% in rural areas and about 60-70% in
urban areas is purchased from the market at prevailing retail price. On an
average, a rural household in Mandya and Tumkur spends about Rs.200-
300/month on purchase of ragi from the market. Urban areas spend about
Rs.300-500/month.
About Rs.150-600/- per month is the reported expenditure on jowar in rural
Dharwad and Gadag. It is Rs.300-600/- per month in urban areas.
Rice by far was chosen as the most preferred grain with ragi and jowar
coming second. Wheat was the least preferred grain, making it a choice to be
replaced with millets.
Consumers found the quality of jowar supplied in PDS “good to very good”
while ragi was rated “fair”.
Overwhelmingly, respondents wanted quantum of rice under PDS increased
rather than millets!
Overall, the consumer survey shows that ragi/jowar form a major part of the food
basket of consumers in Karnataka. Thus, there are no issues related to consumer
demand, but the overwhelming demand for rice portends a clear preference for rice
over millets.
6.3 Procuring Ragi/Jowar for PDS – Key Issues
Despite a quantum jump in MSP for ragi and jowar making it attractive for farmers to
supply to the government, procurement targets were not fully achieved in 2015-16;
1.5 lakh MT of ragi was procured while hardly any quantity of jowar was procured.

Millets in PDS Study LANSA MSSRF
24
This section analyses the underlying issues related to production,
procurement/marketing, farmer behavior, etc.
6.3.1 Production – Is there sufficient millet being produced?
Secondary data shows that cropping pattern in the state has been undergoing great
changes. Table 6.1 shows the compounded annual growth rate (CAGR) of area
under various crops in the study area over 1998-2012.
Table 6-1: Compounded Annual Growth Rate (1998-2012) of Area under various crops
Dharwad Gadag Mandya Tumkur
Crops CAGR Crops CAGR Crops CAGR Crops CAGR
Cotton -6% Cotton -5% Coconut 3% Arecanut 11%
Dry chillies -11% Dry chillies -11%
Horse-
gram -1% Arhar -2%
Gram 10% Gram 11% Ragi -5% Coconut 5%
Groundnut -7% Groundnut -9% Rice -4% Groundnut -7%
Jowar -1% Jowar 0% Sugarcane -1%
Horse-
gram -2%
Maize 4% Maize 7% Maize 12%
Moong 3% Moong 6% Ragi -3%
Onion -19% Onion -2% Rice -9%
Rice -3% Sunflower 4% Sunflower -13%
Soyabean 12% Wheat -1%
Safflower 3%
Sunflower 9%
Wheat 0%
Source: https://data.gov.in/catalog/district-wise-season-wise-crop-production-
statistics
Both jowar and ragi have recorded a negative CAGR over the period of analysis
while soyabean in Dharwad and gram in both Dharwad and Gadag have recorded a
CAGR of 11%. In Mandya, area under coconut has grown by 3%, but in Tumkur,
arecanut (11%) and maize (12%) have recorded a strong CAGR. However, the
extent of decline in area in 2012 over 1998 is not very significant; just 1% for jowar
while for ragi it is 5% (Mandya) and 3% (Tumkur). Therefore, clearly, area under ragi
is declining at a faster rate than that for jowar.

Millets in PDS Study LANSA MSSRF
25
Low productivity and low prices, dissuade farmers from allotting more land to millets.
As can be seen from the table above, commercial crops or even crops that can fetch
a good return (maize) are preferred over millets. However, farmers still plant millets
since it provides them food and fodder security.
However, in order to verify, if indeed, the area was falling and if the area reported
was accurate, the in-house GIS team of MSSRF, carried out an analysis of satellite
imagery of these districts for the years 2005, 2009 and 2015 (LISS III satellite
imagery. The key findings18 are captured in table 6.2 which shows that area in
Dharwad and Mandya are under reported in government statistics while they are over
reported for Gadag and Tumkur. However, both government and GIS data shows
that area under millets is falling in the study area.
Table 6.2: Comparison of Area Under Millets: Govt. Data vs. Satellite Data
District Dharwad Gadag Mandya Tumkur
Crop Jowar Jowar Ragi Ragi
2005
Govt.Data 44313 63572 71422 192991
GIS Data 56152 51602 79344 148729
Difference (Govt-GIS) -11839 11970 -7922 44262
2009
Govt.Data 37019 59056 59498 177795
GIS Data 40797 47605 82300 123078
Difference (Govt-GIS) -3778 11451 -22802 54717
All fig in Ha. Remarks
Area
under
reported
Area over
reported
Area
under
reported
Area over
reported
Table 6.3 presents the area under millets estimated using satellite imagery over three
periods, 2005, 2009 and 2015 and shows that area under millets is consistently
falling in all districts over the period.
18 Although GIS data is available for 2015, comparison with govt. data is being done for only
2005 and 2009 since govt. data for 2015 is not available district-wise yet.

Millets in PDS Study LANSA MSSRF
26
Table 6.3: Area under millets- GIS 2005-2015
Figs in
Ha. Jowar Ragi
Year Dharwad Gadag Mandya Tumkur
2005 56152 51602 79344 148729
2009 40797 47605 82300 123078
2015 40727 49199 75507 125669
Using the area under millets in each district for 2015 from table 6.3 and the
productivity reported in the farmers’ survey, production in the study area has been
estimated. The quantity of millets needed at the scale of issue of 10kg every month
under PDS for all eligible PDS cardholders19 in the study area was estimated.
Results are presented in table 6.4:
Table 6.4: Production of millets vs. PDS requirement
Production
MT (GIS data
for 2015)
No. of PDS
Cardholders
Millet requirement
under PDS (MT)
Requirement as a %
of production
Dharwad
81,454 315768 37892 47%
Gadag
49,199 213836 25660 52%
Mandya
283,151 457249 54870 19%
Tumkur
314,173 596932 71632 23%
Source: PDS Cardholders from Economic Survey of Karnataka 2014-15
As is evident from table 6.4, a huge proportion of the current production in the
districts is needed merely to meet the PDS requirements covering BPL and AAY
families. Given that less than 5 per cent of the produce comes to the formal market,
the extent of challenge in procuring becomes enormous. Even taking the government
data of area under these crops (latest available is for 2012), the quantum of grains
needed to meet the PDS requirement alone is in the range of 20%-40% of millets
produced in the district.
19 All BPL and AAY cardholders in the district are eligible for receiving millets through PDS
Millets in PDS Study LANSA MSSRF
27
6.3.2 Farmers as Consumers – Compounding the Problem
Compounding the procurement challenge is the behavior of farmers as consumers.
Millets are grown as seen in the farmer survey mainly for food and fodder. Therefore,
farming households tend to stock-up on these grains to meet their requirements
throughout the year. This is one of the reasons for very low market arrivals. Needless
to say, low productivity and thereby low production, means many farming households
may not have enough grain for themselves. Further, given that these are rainfed
crops and entirely at the mercy of monsoons, households tend to stock the grain as
long as possible. Ragi, can be stored for more than 2 years while, jowar lasts about
8-9 months. Therefore, in years of bumper yields also, farmers tend not to sell away
the produce in bulk. This is reflected in the low arrivals of millets in the formal
markets.
Ragi and jowar are also sold from time to time to meet the cash requirements of the
family to buy inputs for other crops or even day to day needs. When they run out of
the millet, they buy it in exchange for cash or more likely other produce such as
pulses, etc. Thus, millets are used as a storehouse of value that can be readily
exchanged for other goods and sometimes services. This explains, why many
farming households have reported that they purchase millets from the market.
Thus, given the long storability of the crops, low prices and relative importance of the
crop as staple food, farming households tend not to sell away their produce. On the
other hand cotton, maize and sunflower are sold off since they are not needed /
consumed as food in the area. Pulses are also sold off since they are highly
susceptible to storage pests.
Given this behavior of farming households, it is evident that procurement is a
challenge not only on account of low production, but also farmer behavior as a
consumer.
6.3.3 Price & Procurement Window – Getting it Right
Low prices and good storability make millets the right product to stock up rather than
sell immediately after harvest. An attractive purchase price (in this case MSP) can

Millets in PDS Study LANSA MSSRF
28
disrupt this practice and induce farmers to sell upon harvest. However, some
necessary conditions have to be met for this to happen:
Purchase price should be announced well before sowing so that the farmer
allocates adequate land to the crop.
Farmer should feel assured (through repeated experience) that indeed, the
MSP will be offered and honored at the time of harvest.
Procurement window is currently between January and March. While ragi
would have been harvested, jowar would be just about to be harvested.
Therefore, even though the price is attractive, jowar would just not be ready
for sale.
Further, as seen in the preceding section, farmers like to exchange millets for
other products over the course of the year. Therefore, procurement could be
extended for a period of at least another quarter or so; at least till the onset of
the next monsoon, when farmer will be in a better position to assess whether
to store or sell.
Payment terms must be attractive too. Delays in payment can turn off sellers,
especially if it is as long as 60 days. In such situations, even an attractive
price may not be attractive enough.
Finally, as PDS consumers, farmers should be reasonably certain that they
will get millets as per scale of issue every month. This will go a long way in
reducing the inhibition to sell off the precious foodgrain that represents food
security at the household level.
6.3.4 Physical Procurement – That in itself is a challenge
While production, price and procurement window are challenges that can be largely
handled through appropriately designed policies, the physical act of procuring millets
is a huge challenge. The key reasons are:
Relatively short procurement window poses a huge pressure on the
procurement mechanism. Almost the entire quantity of millets required under
PDS (about 6 lakh MTs/year) is sought to be procured in just 3 months.
Several procurement centres reported that they had a riot like situation on
hand and the police had to be called to control the irate farmers.
Millets in PDS Study LANSA MSSRF
29
Staff deputed from the procurement agencies are not specialists in grain
procurement. They have very little knowledge of assessing the quality of the
millet being procured. This makes them diffident about being strict about
procuring only quality grains.
Staff is supported by third party assayers, who are expected to assess the
quality of the produce and certify the same; more or less on the spot. In
several centres, faced with an unruly mob of farmers, quality checking had to
be given the go by. In fact, assayers that we met during the survey
complained that they even feared for their lives and limbs.
Staff also reported that they were subject to pressure from elected
representatives to procure lower quality grains.
In addition to quality, procurement centres also had to check if the seller was
a genuine farmer with a valid bank account. To do this, they asked for
certified copies of RTCs and bank pass books. However, they had no access
to online records of these documents to verify their authenticity. Many
procurement centre officers lamented that they were not able to make
payments since names of declared bank account holders did not match the
names of the selling farmers.
During our survey, we found that many of those listed as farmers20 who had
sold to the government, were actually traders who had got the RTC from
farmers against a small sum and actually off loaded their old stock at a
whopping margin, since the MSP was dramatically higher than the existing
market price.
Lack of storage place is one of the major problems reported by procurement
officers. Adequate planning in terms of prior identification of storage godowns
and having rental agreements with them in advance would help in averting a
crisis-like situation after the millet has been procured.
20 It is commendable that KFCSC has put in place an extensive ICT-enabled MIS to capture
details of farmers who supplied under MSP procurement. Indeed, it was of great help in carrying out this study, especially in identifying farmers who had sold under MSP procurement.

Millets in PDS Study LANSA MSSRF
30
6.3.5 Getting the Right Procurement Agency
As can be seen in the preceding sections, the role of the procurement agency in
organizing itself and the act of procuring is crucial to ensuring successful
procurement of millets. KFCSC, the main procurement agency in Karnataka, has
acquitted itself well in this. It has put in place a strong MIS architecture to ensure that
millets are procured from genuine farmers. For example, it has stipulated the need
for RTC (as proof of being a farmer and having a certain area under millets), fixed a
quantity of grain that it will procure per acre from a farmer, made arrangements for
direct cash transfer to the accounts of the seller, etc. In addition, appointing a third
party assayer brings strength to the KFCSC team that lacks in ability to assess
quality of the millet being procured. Further, having its own staff in virtually all districts
makes it easy for the agency to manage procurement centres throughout the state, a
strength that even the Food Corporation of India (FCI)21 does not have. It is our view
that with experience, KFCSC will improve on its ability to run the procurement
process efficiently and smoothly. Key enablers for this to happen are extending the
procurement window and ensuring cash flow to KFCSC and thence to farmers!
6.3.6 Local production, procurement and local distribution – Is this better?
Oftentimes, it is suggested that local production, procurement and local distribution of
foodgrains instead of a centralized procurement would be a better and more efficient
way of delivering grains to the poor.
As part of an experiment in decentralized PDS, in 2009, WASSAN, organized
procurement and distribution of millets through Self Help Groups (SHGs) in a few
villages of Anantapur district. SHGs procured millets from farmers and sold it a
subsidized rate the rural poor. The difference in the procurement and selling rate was
met through a subsidy provided by the project. The price of ragi was set higher than
that of rice and did not attract many buyers until the price gap between rice and ragi
was lowered. The experiment was discontinued once the project and the subsidy
ended.
21 Interestingly, during our field visit, we met with officials from FCI who were deputed from
Bellary district to Gadag to procure pulses! They did not have staff in Gadag to do so.

Millets in PDS Study LANSA MSSRF
31
On the other hand, the approach of Deccan Development Society was more radical.
They set up an alternate-PDS that did not work with the government machinery at all.
It only used funds from the Ministry of Rural Development to subsidize the price gap
between procurement and selling price. Apart from being decentralized and
completely owned by the local community, it was exclusively focused on empowering
Dalits and other marginalized communities by enabling them to produce the millet
and vesting them with the authority and responsibility to run the alternate-PDS. Dalit
women were built into teams called Sanghams. Women from these Sanghams were
given an initial loan (project funds) to take fallow land on lease and cultivate millets.
Pay back of the loan was tied to returning in kind (millets) estimated at prevailing
market rates. The grain was pooled and sold to the poor at subsidized rates (project
funds). In addition, to delivering nutritious millets at low prices to the poor and also
empowering Dalit women, bringing additional land under millets helped in increasing
agricultural production in the village. The fodder produced from the jowar crop,
helped feed the cattle in the village, which in turn produced manure that went to
enrich the soils and thus, over a period of time the fallow land would turn fertile.
Both these, experiences are based on extensive mobilization of the community and a
close association with the change makers, in this case WASSAN and DDS. Despite
the success of these models, especially that of DDS (it was working in more than 32
villages in Zaheerabad Mandal of Medak district in Telangana), they were not scaled
up for want of funding support.
Therefore, there is a need for pilots at, say at district level to establish proof of
concept at a larger scale.
6.4 Impact of Millets in PDS – On Farmers
Without doubt, increase in MSP (including the bonus announced by the state
government over and above the central govt. MSP) will give a boost to farmers’
income from growing millets. This should incentivize them to bring more area under
the crop. If better varieties are made available and the level of input use is increased,
higher production should ensue. Being a hardy crop, this should also enable farmers
to better cope with both climate variability and change. Overall, procuring millets at
an attractive MSP will indeed result in “Krishi Bhagya” to the farmers.

Millets in PDS Study LANSA MSSRF
32
6.5 Impact of Millets in PDS – On Consumers
As seen in the preceding sections, PDS seeks to deliver about 20-30 per cent of the
total millets consumed by a PDS cardholding household. To do this, the government
is procuring millets at a price that is substantially higher than the currently prevailing
wholesale price. To meet the entire PDS requirement, it needs to procure nearly 20-
40 per cent of the total production of millets. Coupled with this scale and an
increased MSP, the move is bound to have an upward impact on the retail price of
the millet in the open market. This was already evident during the survey for ragi;
wholesale price which was languishing at Rs.800-1200/qtl had risen sharply to
Rs.1800/qtl in villages in response to an MSP of Rs.2250/qtl.
A moot question is, given that the household after receiving grains from PDS still has
to source nearly 60-80 per cent of the millet to meet the current level of consumption
of the grain, will not an increase in open market price take away the benefit of
receiving subsidized grain from PDS. In the case of rice, the MSP is received by
farmers in Punjab and Haryana, thus, the impact of MSP price and procurement
would not impact local prices as much as when ragi is procured from say Tiptur22 at
higher than market MSP and distributed back in Tiptur at lower prices.
Another issue that needs more study is, assuming that a household saves money on
buying millets by receiving it through PDS at substantially lower rates; will it spend
the money so saved on:
Buying more millets or
Buying more rice (rice being the grain of choice in most households)
And/or, if the household decides to buy more rice, then will it also reduce the quantity
of millets purchased from the market? This move, needless to say will defeat the
whole purpose of introducing millets into PDS in the first place. Indeed, there is a
need to carefully, study the impact of introducing millets in PDS in Karnataka. The
duration of the experience so far is neither stable enough nor long enough to answer
these questions appropriately.
22 Taluka place in Tumkur district

Millets in PDS Study LANSA MSSRF
33
6.6 Conclusions
Consumer demand for millets is strong in Karnataka. However, the lure of
taste and ease of cooking rice is stronger.
By jacking up the MSP (topping up central MSP with a state bonus), a strong
price signal has been sent to farmers. If the approach is continued, production
of the millets should increase, making procurement less uncertain.
Coupled with pricing, if the procurement window is extended by 3-4 months,
then pressure on the procurement team will ease and more procurement is
possible.
With experience, existing procurement agencies can deliver better, but cash
flow and storage issues have to be addressed
Local procurement and distribution needs more piloting, especially at scale to
be considered seriously as a new and viable approach to PDS.
7 Issues to be considered in Introducing Millets in PDS
Based on the observations, findings and discussions in the preceding sections, the
following are the key issues to be considered while introducing millets into PDS:
Check whether there is consumer acceptance of the millet being introduced.
In Karnataka, ragi in south Karnataka and jowar in north Karnataka form an
important part of the household’s food basket. Therefore, acceptance of the
millet in PDS is not an issue. However, in other areas, where only tribal
communities or a section of the population consumes millets, introduction of
millets in PDS may not see enough offtake.
Check whether there is enough production. In many states, millets are grown
in small pockets, on degraded lands, with hardly any inputs. In Karnataka, as
the study showed, a substantial area is under jowar and ragi, but the same
cannot be said of other minor millets such as foxtail, barnyard, etc.

Millets in PDS Study LANSA MSSRF
34
Table 7.1: Production vs. requirement of millets for PDS
State Grain
Households
eligible
under NFSA
(lakhs)23
Annual
requirement
in lakh MT
Production in
the state
2014-15 (lakh
MT)
% of production to be
procured to meet PDS
requirement
Karnataka
Ragi 49 2.97 12.98 23%
Jowar 49 2.97 5.87
24 51%
Rajasthan Bajra 89 5.32 44.65 12%
Maharashtra Jowar 148 8.90 12.05 74%
Table 7.1 shows the requirement of millets to be distributed through PDS
under NFSA at the rate of 5kg grain/household/month in each state versus
the actual production. It shows that Maharashtra (74%) and Karnataka (51%)
will have to procure a substantial portion of the state’s production of jowar to
meet the requirement.
Oftentimes, price can be a strong signal to bring more area under the crop as
well as incentivize farmers to apply more inputs to the crop to gain a higher
yield and thus return. The approach of the GoK in giving a bonus over and
above the central MSP is worth following. The incremental cost to the state is
only the bonus being paid.
Procurement window and the process have to be streamlined before
introducing millets into PDS. In this regard, there is a lot to learn from the GoK
experience.
Finally, strong political leadership is needed to push millets through the PDS.
23 Data on no. of eligible households and production of millet in the state has been taken from
the Economic Survey (2014-15) of the respective states 24
50% of jowar produced is taken as maldandi variety. This is the variety that is preferred by customers and is therefore, distributed through PDS as well.

Millets in PDS Study LANSA MSSRF
35
Annexure 1: Questionnaires used in the study
1. Farmers’ Survey
Dist ……………………….. Taluk ........................... GP ………………..……. Village.........................
Basic details
1. Do you cultivate ragi/jowar (yes=1; no=2)
2. Do you plan to cultivate ragi/jowar this year (yes=1; no=2)
7. Community
1. SC 2. ST 3. OBC 4. Others___________________
3. Name of the farmer: …………………………........... Age:
..........
Gender: (male=1; female=2)
8. Family Size (in number) ________________
Adults:_______________ Children: _______________
4. Literacy Status
1. Illiterate 2. Read & Write 3. 1-4 std.
4. 5-8 std. 5. 9-12 std. 6. College
9. Types of family
1. Nuclear 2. Extended Nuclear 3. Joint
5. Occupation of the Respondent (Primary & Secondary)
i) Primary ii)Secondary
1. Cultivation; 2. Self-employed in non-Agri.; 3. Agri. Labour;
4. Regular wage/salary; 5. Casual labour 6. Others
________________
10. House Type
1. Kuccha 2. Semi-Pucca 3. Pucca

Millets in PDS Study LANSA MSSRF
36
6. Religion
1. Hindu 2. Muslim 3. Christian 4. Others ______
11. Land details
Land
Total Own
land
Irrigated Unirrigated/ Rainfed
Own land Leased in
Leased
out
Fallow
land
Own
land
Leased
in Leased out
Fallow
land
Area in
Acres
12. Total Operational Land …………………….. (Acres) (Note: Operational land includes own land as well as leased in – irrigated and
rainfed)
13. Cropping Details (For the last 12 months)
S.No Crop Name Variety
Name
Area (Acres) Total
Expenses
(Rs./acre)
Total
Output
(Qtl)
Qty – Self
Cons.
(Qtl)
Qty – Seed
(Units)
kg.
Qty – Sold
(Qtl)
Govt
Qty – Sold
(Qtl)
Open mkt
By product
Irrigated Rainfed Total Own use
Yes=1;No=2
If Sold
Value (Rs.)
(1) (2) (3) (4) (5) (6) 7 8 9 10 11 12 13 14
Kharif
1

Millets in PDS Study LANSA MSSRF
37
2
3
4
5
Rabi
1
2
3
14. Comparison of sale through open market & government procurement- what is your preference?
S. No Crop
Name
Variety
Name
Government
Procuremen
t
(yes=1;no=2
)
Preferenc
e of Sale
(open=1;
govt.=2)
Price (2015)
(Rs./Qtl.)
Payment Duration
(Days)
Market Distance
(Km.) Why do you
prefer sale
open/govt. Open
Mkt. Govt.
Open
Mkt. Govt. Open Mkt. Govt.
1
2
3
4

Millets in PDS Study LANSA MSSRF
38
15. Comparison of sale through open market and government procurement- what is your satisfaction rating?
S. No Crop
Name
Fairness of quality
checking process
Fairness of quantity
measurement
Speed of physical transaction
(from the time of bringing the goods - to acceptance of
goods by buyer)
Open
Mkt. Govt.
Open
Mkt. Govt. Open Mkt. Govt.
1
2
3
4
Rating: 1 to 5; 1 = Very satisfied; 2 = satisfied; 3 = moderately satisfied; 4 =moderately unsatisfied; 5 = very unsatisfied
16. In the last 5 years where have you been selling ragi/jowar?
Ragi/Jowar 2015-16 2014-15 2013-14 2012-13
Open mkt Govt Open mkt Govt Open mkt Govt Open mkt Govt
Yes =1 ; No = 2
Price in Rs./Qtl

Millets in PDS Study LANSA MSSRF
39
17. If sold ragi/jowar to govt. ( go to 17a or else 17 b)
17a) How did you come to know that govt. is buying ragi/jowar?
___________________________________________________________________
17b) Why did you not sell ragi/jowar to govt.?
__________________________________________________________________________________
18. Household yearly Income a) Farm income Rs._________ b) Animal Husbandry Rs.__________ c) Non-Farm Rs. ___________d)
Wage/salary Rs.______
19. Since how many years are you cultivating ragi/jowar: _________________
20. Will you cultivate millets this year (yes=1; no=2) _____________ If no, why
____________________________________________________
21. If first time cultivation of ragi/jowar, what is the motivation:
_____________________________________________________________________
Respondent street/land mark Details: __________________________________ Mobile No: __________________
Investigator Name: __________________________________________ Supervisor Name ________________________________

Millets in PDS Study LANSA MSSRF
40
2. Consumer Survey
Dist ……………………….. Taluk ........................... GP/Town ………………..……. Village/Ward......................... Type of Ration Card 1= AAY 2 = BPL
1. Name of the Woman Respondent: …………………………...........
Age: ..........
10. Types of family
1. Nuclear 2. Extended Nuclear 3. Joint
2. Name of the Husband: ................................... Age:
..........
11. House Type
1. Kuccha 2. Semi-Pucca 3. Pucca
3. Literacy Status of the Respondent
3. Illiterate 2. Read & Write 3. 1-4 std.
4. 5-8 std. 5. 9-12 std. 6. College
12. Do you have Electricity Connection
1. Yes 2. No
4. Literacy Status of the Husband
1. Illiterate 2. Read & Write 3. 1-4 std.
1. 4. 5-8 std. 5. 9-12 std. 6. College
13. Types of Cooking fuel
1. Fire Wood 2. Kerosene 3. Bio-gars 4. LPG
5. Others ________________________
5. Occupation of the Respondent i) Primary ii)Secondary
1. Cultivation; 2. Self-employed in non-Agri.; 3. Agri. Labour;
4. Regular wage/salary; 5. Casual labour 6. Others
______________
14. Ration Card No: ________________________
15. Distance of Ration Shop: ___________km
16. Is Ragi / Jowar Sold in PDS?
1. Ragi 2. Jowar
6. Occupation of the Husband i) Primary ii)Secondary
1. Cultivation; 2. Self-employed in non-Agri.; 3. Agri. Labour;

Millets in PDS Study LANSA MSSRF
41
4. Regular wage/salary; 5. Casual labour 6.
Others________________
17. Do you have own agriculture land (yes=1; no=2)
If yes total area: _____________ (Acres)
7. Religion
1. Hindu 2. Muslim 3. Christian 4. Others ______
8. Community
1. SC 2. ST 3. OBC 4. Others______________
9. Total Family Size (in number) ___________
Adults: _____________ Children : ____________
18. Household Income Yearly (Including Farm, Non-farm, wage & salary)
Rs.___________________

Millets in PDS Study LANSA MSSRF
42
19. Food consumption frequency, total raw amount cooked per day and source of cereals and millets
S. No Food Items
Frequency
of
consumptio
n
(code)
Total amount
cooked per
day
(all meals)
(grams)
Source (kg/month) For purchase from market
PDS Home
grown Market
Whole
grains=1
Flour=2
Price
(Rs.)
per/kg
Frequenc
y of
purchase
(code)
1 Rice raw
2 Wheat
3 Ragi
4 Jowar
Code For: Consumption of frequency / Ref. Period: Daily=1; Twice /thrice a week=2; Once a week=3; Once in fifteen days=4; Once in a month=5; occasionally=6
20. When you say you are buying ragi/jowar from the market, who are you buying from mainly?
1 = Other farmers in the village 2= Shops in the village 3= Traders/shops outside the village

Millets in PDS Study LANSA MSSRF
43
21. Preference of Cereals and Millets (Give ranking according to your preference)
S. No Food item Rankin
g Reason for ranking
1 Jowar
2 Wheat
3 Rice
4 Ragi
22. If not consuming Ragi/Jowar Reasons
S. No Food Items Reasons
1 Ragi
2 Jowar

Millets in PDS Study LANSA MSSRF
44
23. Quantity and quality of foodgrains given in Ration/ Fare Price Shops (FPS)
S. No Food Items Quantity
(kg/month)
Number of
days sold in a
month
Quality
(code)
Available
Throughout
year (code)
Remarks
1 Ragi
2 Jowar
3 Rice Raw
4 Wheat
Quality: Very Good=1; Good=2; Fair=3; Poor=4; Very Poor=5
Available Throughout year: Whole Year=1; Nine Months only=2; Six Months only=3; Three months only=4; Alternative months=5; others=6 _______
24. Would you prefer if the quantity of ragi/jowar is increased and rice decreased in PDS? Yes =1; No= 2
25. What is the reason for your response?
____________________________________________________________________________________________________________
26. Name of Ration Shop _____________________ Ration Shop Owner’s Name & Mobile No.: ______________________________
Respondent street/land mark Details: __________________________________ Mobile No: __________________
Investigator Name: __________________________________________ Supervisor Name:________________________________

Millets in PDS Study LANSA MSSRF
45
Annexure 2: Sample Characteristics: Farmers
(Sample Size: 200)
Table 1: Farmer Survey Sample Details
District Sale to Govt.
Sale to Pvt
Agency Total
Dharwad 35 15 50
Gadag 35 15 50
Mandya 35 15 50
Tumkur 35 15 50
Total 140 60 200
Table 2: Number of Farmers by gender
District Male Female Total
Dharwad 49 1 50
Gadag 49 1 50
Mandya 46 4 50
Tumkur 43 7 50
Total 187 13 200
Table 3: Literacy status
Education Dharwad Gadag Mandya Tumkur Total
Illiterate 9 11 8 13 41
Read & write 5 1 1 0 7
1-4 std. 8 3 5 6 22
5-8 std. 10 7 8 4 29
9-12 std. 11 21 24 23 79
college 7 7 4 4 22
Total 50 50 50 50 200

Millets in PDS Study LANSA MSSRF
46
Table 4: Occupation
Occupation Dharwad Gadag Mandya Tumkur Total
Cultivation 49 47 49 36 181
Self-employed in non-Agri. 0 1 1 2 4
Agri. Labour 0 1 0 10 11
Regular wage/salary 1 1 0 1 3
NA 0 0 0 1 1
Total 50 50 50 50 200
Table 5: Religion
Religion Dharwad Gadag Mandya Tumkur Total
Hindu 43 48 50 50 191
Muslim 0 2 0 0 2
Christian 3 0 0 0 3
Others 4 0 0 0 4
Total 50 50 50 50 200
Table 6: Community
Community Dharwad Gadag Mandya Tumkur Total
SC 0 1 1 3 5
ST 0 1 4 2 7
OBC 45 13 10 6 74
Others 5 35 35 39 114
Total 50 50 50 50 200
Others (GM, 3A, Lingayat..)
Table 7: Household Family Size
Family size Dharwad Gadag Mandya Tumkur Total
1 to 2 2 1 1 1 5
3 to 5 19 19 34 28 100
6 & above 29 30 15 21 95
Total 50 50 50 50 200

Millets in PDS Study LANSA MSSRF
47
Table 8: Type of Family
District Dharwad Gadag Mandya Tumkur Total
Nuclear 29 10 29 9 77
Extended Nuclear 12 24 14 16 66
Joint 9 16 7 25 57
Total 50 50 50 50 200
Table 9: Type of House
District Dharwad Gadag Mandya Tumkur Total
Kuccha 0 0 0 1 1
Semi-picca 44 46 37 45 172
Pucca 6 4 13 4 27
Total 50 50 50 50 200
Table 10: Farmers classified by operational land
Farmer Class Dharwad Gadag Mandya Tumkur Total
Marginal (< 1 ha) 1 0 10 7 18
Small (1 - < 2 ha) 5 5 21 18 49
Semi-medium (2 - < 4 ha) 10 7 14 17 48
Medium (4 - < 10 ha) 16 27 5 8 56
Large (10 ha & above) 18 11 0 0 29
Total 50 50 50 50 200

Millets in PDS Study LANSA MSSRF
48
Annexure 3: Sample Characteristics: Consumer Survey
(Sample Size: 400)
Table 1: Consumer Survey sample details by sector
District Rural Urban Total
Dharwad 50 50 100
Gadag 50 50 100
Mandya 50 50 100
Tumkur 50 50 100
Total 200 200 400
Table 2: Types of Ration card by sector
District Rural Urban
AAY BPL AAY BPL
Dharwad 3 47 0 50
Gadag 8 42 6 44
Mandya 3 47 9 41
Tumkur 0 50 1 49
Total 14 186 16 184
Table 3: Literacy status of the Respondent by sector
Literacy Status Dharwad Gadag Mandya Tumkur
Rural Urban Rural Urban Rural Urban Rural Urban
Illiterate 30 16 32 23 18 34 14 18
Read & write 2 3 4 4 0 0 0 0
1-4 std 2 4 5 6 2 3 12 3
5-8th std 10 12 7 6 16 7 7 8
9-12 std 6 12 2 10 11 5 16 17
College 0 3 0 1 3 1 1 4
Total 50 50 50 50 50 50 50 50

Millets in PDS Study LANSA MSSRF
49
Table 4: Literacy status of Respondent’s Husband by sector
Literacy
Status
Dharwad Gadag Mandya Tumkur
Rural Urban Rural Urban Rural Urban Rural Urban
Illiterate 12 15 27 20 17 31 8 10
Read & write 4 4 3 1 2 0 3 1
1-4 std 3 5 9 7 2 3 8 4
5-8th std 12 9 5 5 8 5 9 6
9-12 std 8 11 5 9 17 8 13 16
College 1 3 1 1 4 0 1 7
NA 10 3 0 7 0 3 8 6
Total 50 50 50 50 50 50 50 50
Table 5: Occupation of the Respondent by sector
Occupation Dharwad Gadag Mandya Tumkur
Rural Urban Rural Urban Rural Urban Rural Urban
Cultivation 4 0 3 0 40 0 8 13
Self-employed in non-
agriculture 0 1 1 9 3 5 7 21
Agri. Labour 22 1 35 0 5 2 22 1
Regular wage/salary 0 0 0 1 0 1 1 1
Casual labour 7 4 4 8 1 24 12 9
Others 17 32 6 31 1 18 0 5
NA 0 12 1 1 0 0 0 0
Total 50 50 50 50 50 50 50 50
Table 6: Occupation of the Respondent’s Husband by sector
Occupation Dharwad Gadag Mandya Tumkur
Rural Urban Rural Urban Rural Urban Rural Urban
Cultivation 11 0 3 1 43 0 3 1
Self-employed in non-
agriculture 0 2 3 10 0 8 3 7
Agri. Labour 18 1 19 1 3 2 23 0
Regular wage/salary 2 1 1 1 0 3 0 1
Casual labour 8 19 16 20 2 25 11 28
Others 0 15 3 6 0 0 0 0
NA 11 12 5 11 2 12 10 13
Total 50 50 50 50 50 50 50 50

Millets in PDS Study LANSA MSSRF
50
Table 7: Religion by sector
Religion Dharwad Gadag Mandya Tumkur
Rural Urban Rural Urban Rural Urban Rural Urban
Hindu 42 31 45 35 50 40 40 42
Muslim 5 18 5 15 0 9 10 7
Christian 2 1 0 0 0 1 0 0
Others 1 0 0 0 0 0 0 1
Total 50 50 50 50 50 50 50 50
Table 8: Community by sector
Community Dharwad Gadag Mandya Tumkur
Rural Urban Rural Urban Rural Urban Rural Urban
SC 0 4 18 18 0 12 1 27
ST 4 8 7 1 2 21 0 12
OBC 44 27 15 12 14 13 18 6
Others 2 11 10 19 34 4 31 5
Total 50 50 50 50 50 50 50 50
Others (GM, 3A, Lingayat...)
Table 9: Family size by sector
District 1 to 2 3 to 5 6 above
Rural Urban Rural Urban Rural Urban
Dharwad 10 10 30 32 10 8
Gadag 0 5 36 35 14 10
Mandya 2 12 41 31 7 7
Tumkur 9 7 35 38 6 5
Total 21 34 142 136 37 30
Table 10: Types of family by sector
District Nuclear Extended Nuclear Joint
Rural Urban Rural Urban Rural Urban
Dharwad 40 42 7 7 3 1
Gadag 34 40 8 7 8 3
Mandya 33 41 15 6 2 3
Tumkur 39 36 0 2 11 12
Total 146 159 30 22 24 19

51
Annexure 4: Cost of cultivation and cost of production of millets
Sl. No. Details Tumkur Mandya Gadag Dharwad
Unit Cost/Return (Rs.) % Unit Cost/Return (Rs.) % Unit Cost/Return (Rs.) % Unit Cost/Return (Rs.) %
A Variable Cost 18056 66% 24274 65% 6945 60% 11174 58%
I Human Labour 32 8000 29% 38 8800 23% 9 2300 20% 15 3700 19%
Family Male (No.) 6 1800 7% 2 600 2% 2 600 5% 3 900 5%
Female (No.) 2 400 1% 2 400 1% 2 400 3% 2 400 2%
Hired Male (No.) 10 3000 11% 10 3000 8% 3 900 8% 4 1200 6%
Female (No.) 14 2800 10% 24 4800 13% 2 400 3% 6 1200 6%
II Machine and Bullock Labour 4650 17% 6600 18% 1350 12% 2850 15%
Tractor (hrs) 6 3600 13% 11 6600 18% 1.5 900 8% 4 2400 12%
Bullock (Days) 3.5 1050 4% 0 0 0% 1.5 450 4% 1.5 450 2%
III Inputs 4300 16% 7250 19% 2880 25% 3935 20%
FYM (Tractor load) 1.5 3000 11% 2 4000 11% 1 2000 17% 1 2000 10%
Seeds (kg) 10 360 1% 8 640 2% 4 200 2% 3 240 1%
Pesticides (ml) 0 0 0% 0 0 0% 0 0 0% 250 825 4%
Fertilizers (kg) 110 940 3% 130 2610 7% 85 680 6% 100 870 5%
IV Interest on working capital (15%) 1106 4% 1624 4% 415 4% 689 4%
B Fixed Cost 9413 34% 13221 35% 4584 40% 8094 42%
I Depreciation on farm machinery
and farm buildings
500 2% 500 1% 250 2% 250 1%
II Rental/lease value of land 5000 18% 7500 20% 2500 22% 5000 26%

52
III Managerial cost (15% of all costs) 3533 13% 4841 13% 1454 13% 2464 13%
C Cost Cost A1 16356 23774 6195 10124
Cost A1 + FL 18936 69% 25154 67% 7575 66% 11804 61%
Total Cost (C3) 27470 100% 37495 100% 11529 100% 19267 100%
D Output Grain (qtl) 10 14000 18 25200 5 10000 8 16000
Price/qtl 1400 1400 2000 2000
Hay (bundles) 100 5000 150 7500 80 3200 120 6000
Price/bundle 50 50 40 50
E Returns Gross 19000 32700 13200 22000
Over A1 2643.75 8926.25 7005.25 11876.13
Over cost A1+FL 64 7546 5625 10196
Over total cost (C3) -8470 -4795 1671 2733
F Cost of
production
Rs./qtl
Cost A1 1636 1321 1239 1265
Cost A1+FL 1894 1397 1515 1475
Total Cost (C3) 2747 2083 2306 2408