Embed Size (px)
Citation preview

1
1 Overview of revenue collections
Introduction In 2007/08, the consolidated South African tax revenue of all three spheres of government was an estimated 29.1 percent of GDP or R599.3 billion.
Nationally collected taxes dominate the South African taxation system, accounting for 95.6 percent of total South African tax revenue (or 27.8 percent of GDP) in 2007/08. Provinces account for just under 1 percent of total South African tax revenue (0.2 percent of GDP) and local government around 3.6 percent of total South African tax revenue (1 percent of GDP).
This chapter gives an overview of:
• South African tax revenue • National taxes • Registered taxpayers • Budget revenue and revenue performance • Main sources of tax revenue • Tax revenue by main category • Tax relief • Tax rates • Roles of National Treasury and SARS.
South African tax revenue Table 1.1 shows total South African tax revenue from the three spheres of government - national, provincial and local - with the corresponding percentages of GDP. Total South African tax revenue increased from R302 billion in 2002/03 to R599.3 billion in 2007/08. The total South African tax revenue as a percentage of GDP increased from 25.2 percent in 2002/03 to 29.1 percent in 2007/08.
National tax revenues are derived from three major taxes: personal income tax (PIT), corporate income tax (CIT) and value-added tax (VAT). Combined, these account for around 80 percent of total (national) budget revenue, with the fuel levy, excise and customs duties accounting for around 12 to 14 percent of total national budget revenue.
Provincial tax revenues account for less than 1 percent of total South African tax revenue and around 0.2 percent of GDP. The bulk of provincial tax revenue is derived from motor vehicle licences, with some revenue being derived from casino (gambling) taxes and liquor licences. Provincial tax revenue has increased from R2.8 billion in 2002/03 to R4.9 billion in 2007/08.

2008 TAX STATISTICS
2
Table 1.1: South African total tax revenue, 2002/03 – 2007/08 Tax revenue
R millionTotal South
AfricaNational Provinces2 Local
government3
2002/03 1 198 457.0 302 045.9 282 209.7 2 773.4 17 062.8
2003/04 1 288 979.0 324 777.7 302 507.5 3 306.6 18 963.5
2004/05 1 427 445.0 381 910.5 354 980.3 3 525.5 23 404.7
2005/06 1 584 743.0 446 650.1 417 334.0 4 311.2 25 004.9
2006/07 1 808 271.1 519 237.6 495 515.1 4 815.3 18 907.1
2007/08 2 061 942.0 599 347.8 572 870.6 4 895.9 21 581.3
Percentage of Total South African tax revenue2002/03 100.0% 93.4% 0.9% 5.6%
2003/04 100.0% 93.1% 1.0% 5.8%
2004/05 100.0% 92.9% 0.9% 6.1%
2005/06 100.0% 93.4% 1.0% 5.6%
2006/07 100.0% 95.4% 0.9% 3.6%
2007/08 100.0% 95.6% 0.8% 3.6%
Percentage of GDP2002/03 25.2% 23.5% 0.2% 1.4%
2003/04 25.2% 23.5% 0.3% 1.5%
2004/05 26.8% 24.9% 0.2% 1.6%
2005/06 28.2% 26.3% 0.3% 1.6%
2006/07 28.7% 27.4% 0.3% 1.0%
2007/08 29.1% 27.8% 0.2% 1.0%
1. Source: South African Reserve Bank and Statistics South Africa.2. Provincial numbers taken from the Provincial Budgets and Expenditure Review. All numbers relatin
to 2007/08 are budget numbers.3. Local government numbers taken from the Local Government Budgets and Expenditure Review.
The financial year of the municipalities starts on 1 July to 30 June of the following year. Regional service levies were abolished in 2006/07. Numbers up to 2005/06 have been audited, are pre-audited for 2006/07 and budgeted for 2007/08.
Nominal GDP1
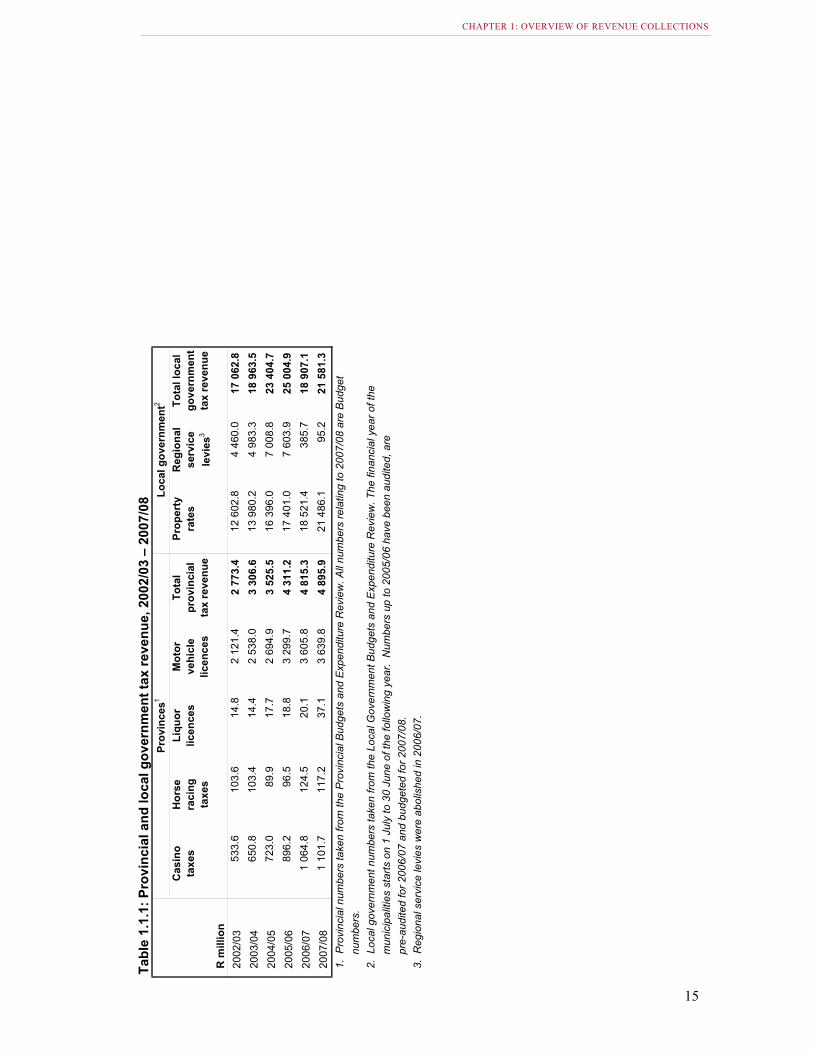
Local government (municipal) own tax revenue has decreased from 5.6 percent in 2002/03 to around 3.6 percent of total South African tax revenue in 2007/08. The decrease is mainly due to the termination of the regional services council (RSC) levies in 2006/07. Local government tax revenue accounts for around 1 percent of GDP. All local government tax revenue is derived from property rates and RSC levies prior to 2005/06. Table 1.1.11 provides a breakdown of provincial and local government tax revenues.
The rest of this publication focuses on national taxes only, as provincial and local government taxes are reported in other publications like the Local Government Budgets and Expenditure Review released earlier in 2008 and the Provincial Budgets and Expenditure Review published released in 2007. Both are available on National Treasury’s website.
National taxes Section 213 of the Constitution requires that all money received by the national government be paid into the National Revenue Fund, except for money reasonably excluded by an act of Parliament. South Africa also collects customs and excise revenue on behalf of the Southern African Customs Union (SACU).
1 Tables numbered in italics are included at the end of the chapter.

CHAPTER 1: OVERVIEW OF REVENUE COLLECTIONS
3
One of the first tax reforms instituted by the government after 1994 was the creation of the South African Revenue Service (SARS), which is a dedicated agency established to administer and collect taxes. The national tax base has grown substantially since 1994, with more people being tax compliant. National Treasury is responsible for the tax policy framework and it works closely with SARS to ensure that tax policy and tax administration are well aligned. Section 12(1) of the Public Finance Management Act (1999) (PFMA) requires that: “The South African Revenue Service must promptly deposit into a Revenue Fund all taxes, levies, duties, fees and other moneys collected by it for that Revenue Fund, in accordance with a framework determined by the National Treasury”.
The South African income taxation system is a residence based system, which means residents are taxed on their worldwide income, irrespective of where their income was earned. Non-residents are, however, taxed on their income from a South African source. Foreign taxes on foreign income are credited against the South African tax payable on foreign income.
Registered taxpayers The number of taxpayers registered as individuals, companies and trusts for income tax and employers for pay-as-you-earn (PAYE) and vendors for VAT are shown in table 1.2. It must be noted that the figures for registered taxpayers for income tax purposes exclude an estimated 4 million formal employees (standard income tax on employees (SITE)-only taxpayers) earning an annual taxable income below R60 000 from employment only, who are not required to register with SARS.
Table 1.2: Registered taxpayers, 2002/03 – 2007/08
NumberIndividuals1 Companies
(CIT)1Trusts1 PAYE1 VAT1
2002/03 3 415 432 814 894 254 593 252 589 506 098
2003/04 3 777 005 817 381 283 825 274 764 536 281
2004/05 4 115 293 933 136 318 967 302 880 578 138
2005/06 4 476 261 1 054 969 344 882 330 194 633 703
2006/07 4 764 105 1 218 905 374 411 349 077 677 153
2007/08 5 204 805 1 584 002 384 747 379 675 745 487
Percentage year-on-year growth2003/04 10.6% 0.3% 11.5% 8.8% 6.0%
2004/05 9.0% 14.2% 12.4% 10.2% 7.8%
2005/06 8.8% 13.1% 8.1% 9.0% 9.6%
2006/07 6.4% 15.5% 8.6% 5.7% 6.9%
2007/08 9.3% 30.0% 2.8% 8.8% 10.1%
1. Excludes cases where status is in suspense, estate and address unknown. The tax year for individuals starts on 1 March and ends at the end of February the following year. The tax year for companies is normally the financia l year of the company for financial reporting purposes.
• Individuals: The number of registered individual taxpayers has increased from 3.4 million in 2002/03 to 5.2 million taxpayers in 2007/08. The percentage year-on-year growth has declined from 10.6 percent in 2003/04 to around 9.3 percent in 2007/08.
• Companies: The number of companies registered for income tax has nearly doubled from 814 894 in 2002/03 to over 1.5 million in 2007/08. The percentage year-on-year increase ranges from 0.3 percent in 2003/04 to 30 percent in 2007/08.
• Trusts: The number of registered trusts has increased from 254 593 in 2002/03 to 384 747 in 2007/08.
2008 TAX STATISTICS
4
• PAYE: The number of taxpayers registered for PAYE has increased from 252 589 in 2002/03 to 379 675 in 2007/08.
• VAT: The number of registered VAT vendors has increased from 506 098 in 2002/03 to 745 487 in 2007/08. The percentage year-on-year growth has increased from 6 percent in 2003/04 to 10.1 percent in 2007/08.
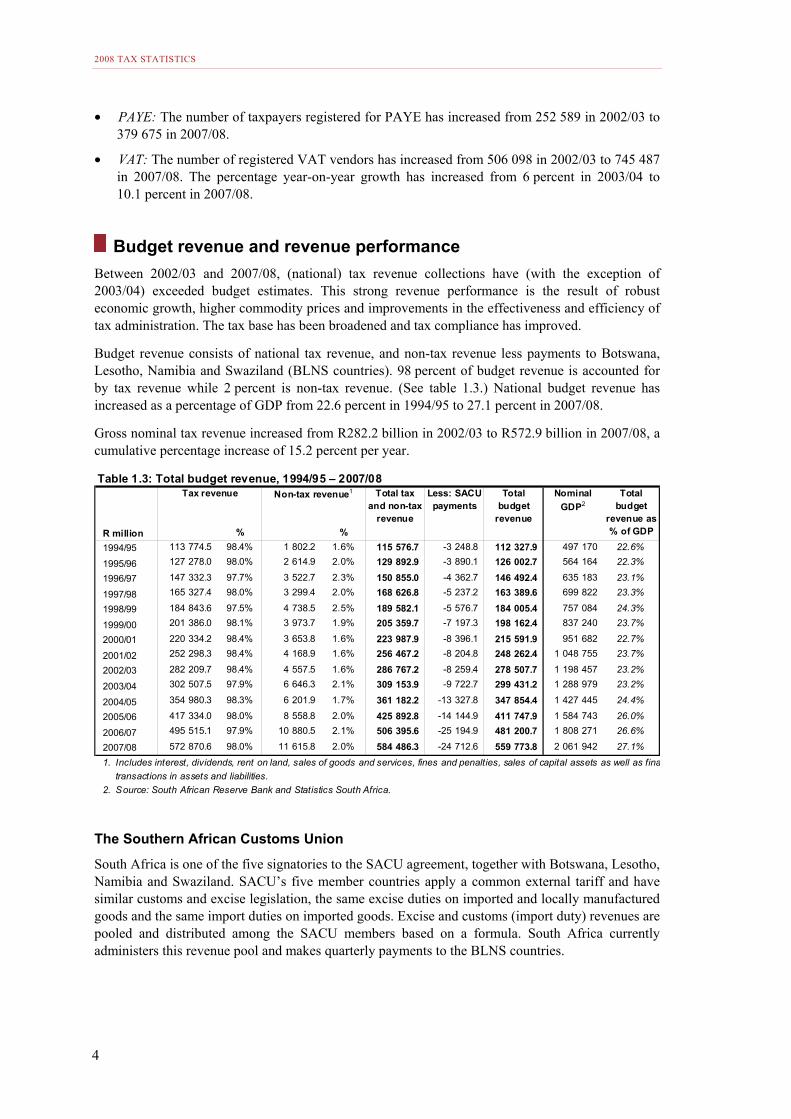
Budget revenue and revenue performance Between 2002/03 and 2007/08, (national) tax revenue collections have (with the exception of 2003/04) exceeded budget estimates. This strong revenue performance is the result of robust economic growth, higher commodity prices and improvements in the effectiveness and efficiency of tax administration. The tax base has been broadened and tax compliance has improved.
Budget revenue consists of national tax revenue, and non-tax revenue less payments to Botswana, Lesotho, Namibia and Swaziland (BLNS countries). 98 percent of budget revenue is accounted for by tax revenue while 2 percent is non-tax revenue. (See table 1.3.) National budget revenue has increased as a percentage of GDP from 22.6 percent in 1994/95 to 27.1 percent in 2007/08.
Gross nominal tax revenue increased from R282.2 billion in 2002/03 to R572.9 billion in 2007/08, a cumulative percentage increase of 15.2 percent per year.
Table 1.3: Total budget revenue, 1994/95 – 2007/08
Tax revenue Non-tax revenue1
R million % %1994/95 113 774.5 98.4% 1 802.2 1.6% 115 576.7 -3 248.8 112 327.9 497 170 22.6%
1995/96 127 278.0 98.0% 2 614.9 2.0% 129 892.9 -3 890.1 126 002.7 564 164 22.3%
1996/97 147 332.3 97.7% 3 522.7 2.3% 150 855.0 -4 362.7 146 492.4 635 183 23.1%
1997/98 165 327.4 98.0% 3 299.4 2.0% 168 626.8 -5 237.2 163 389.6 699 822 23.3%
1998/99 184 843.6 97.5% 4 738.5 2.5% 189 582.1 -5 576.7 184 005.4 757 084 24.3%
1999/00 201 386.0 98.1% 3 973.7 1.9% 205 359.7 -7 197.3 198 162.4 837 240 23.7%
2000/01 220 334.2 98.4% 3 653.8 1.6% 223 987.9 -8 396.1 215 591.9 951 682 22.7%
2001/02 252 298.3 98.4% 4 168.9 1.6% 256 467.2 -8 204.8 248 262.4 1 048 755 23.7%
2002/03 282 209.7 98.4% 4 557.5 1.6% 286 767.2 -8 259.4 278 507.7 1 198 457 23.2%
2003/04 302 507.5 97.9% 6 646.3 2.1% 309 153.9 -9 722.7 299 431.2 1 288 979 23.2%
2004/05 354 980.3 98.3% 6 201.9 1.7% 361 182.2 -13 327.8 347 854.4 1 427 445 24.4%
2005/06 417 334.0 98.0% 8 558.8 2.0% 425 892.8 -14 144.9 411 747.9 1 584 743 26.0%
2006/07 495 515.1 97.9% 10 880.5 2.1% 506 395.6 -25 194.9 481 200.7 1 808 271 26.6%
2007/08 572 870.6 98.0% 11 615.8 2.0% 584 486.3 -24 712.6 559 773.8 2 061 942 27.1%
1. Includes interest, dividends, rent on land, sales of goods and services, fines and penalties, sales of capital assets as well as fina transactions in assets and liabilities.
2. Source: South African Reserve Bank and Statistics South Africa.
Nominal GDP2
Total budget
revenue as % of GDP
Total tax and non-tax
revenue
Less: SACU payments
Total budget
revenue
The Southern African Customs Union
South Africa is one of the five signatories to the SACU agreement, together with Botswana, Lesotho, Namibia and Swaziland. SACU’s five member countries apply a common external tariff and have similar customs and excise legislation, the same excise duties on imported and locally manufactured goods and the same import duties on imported goods. Excise and customs (import duty) revenues are pooled and distributed among the SACU members based on a formula. South Africa currently administers this revenue pool and makes quarterly payments to the BLNS countries.
CHAPTER 1: OVERVIEW OF REVENUE COLLECTIONS
5
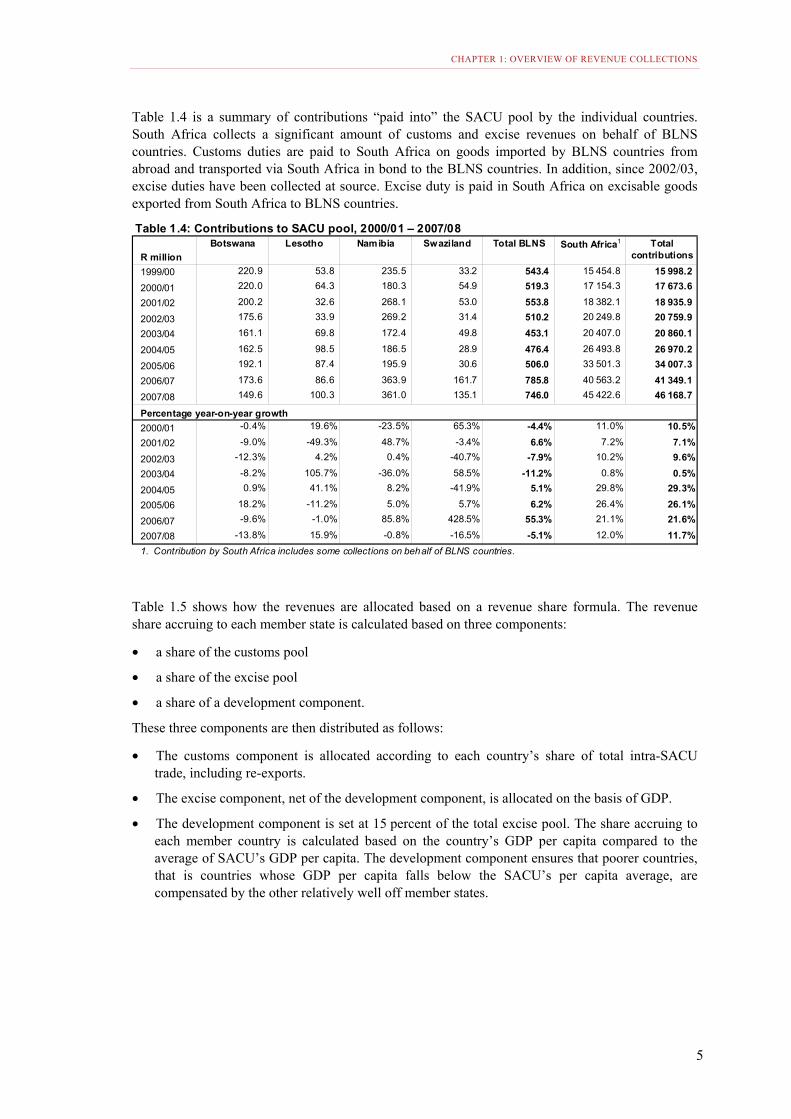
Table 1.4 is a summary of contributions “paid into” the SACU pool by the individual countries. South Africa collects a significant amount of customs and excise revenues on behalf of BLNS countries. Customs duties are paid to South Africa on goods imported by BLNS countries from abroad and transported via South Africa in bond to the BLNS countries. In addition, since 2002/03, excise duties have been collected at source. Excise duty is paid in South Africa on excisable goods exported from South Africa to BLNS countries.
Table 1.4: Contributions to SACU pool, 2000/01 – 2007/08
R millionBotswana Lesotho Namibia Swaziland Total BLNS South Africa1 Total
contributions
1999/00 220.9 53.8 235.5 33.2 543.4 15 454.8 15 998.2
2000/01 220.0 64.3 180.3 54.9 519.3 17 154.3 17 673.6
2001/02 200.2 32.6 268.1 53.0 553.8 18 382.1 18 935.9
2002/03 175.6 33.9 269.2 31.4 510.2 20 249.8 20 759.9
2003/04 161.1 69.8 172.4 49.8 453.1 20 407.0 20 860.1
2004/05 162.5 98.5 186.5 28.9 476.4 26 493.8 26 970.2
2005/06 192.1 87.4 195.9 30.6 506.0 33 501.3 34 007.3
2006/07 173.6 86.6 363.9 161.7 785.8 40 563.2 41 349.1
2007/08 149.6 100.3 361.0 135.1 746.0 45 422.6 46 168.7
Percentage year-on-year growth2000/01 -0.4% 19.6% -23.5% 65.3% -4.4% 11.0% 10.5%
2001/02 -9.0% -49.3% 48.7% -3.4% 6.6% 7.2% 7.1%
2002/03 -12.3% 4.2% 0.4% -40.7% -7.9% 10.2% 9.6%
2003/04 -8.2% 105.7% -36.0% 58.5% -11.2% 0.8% 0.5%
2004/05 0.9% 41.1% 8.2% -41.9% 5.1% 29.8% 29.3%
2005/06 18.2% -11.2% 5.0% 5.7% 6.2% 26.4% 26.1%
2006/07 -9.6% -1.0% 85.8% 428.5% 55.3% 21.1% 21.6%
2007/08 -13.8% 15.9% -0.8% -16.5% -5.1% 12.0% 11.7%1. Contribution by South Africa includes some collections on behalf of BLNS countries.
Table 1.5 shows how the revenues are allocated based on a revenue share formula. The revenue share accruing to each member state is calculated based on three components:
• a share of the customs pool
• a share of the excise pool
• a share of a development component.
These three components are then distributed as follows:
• The customs component is allocated according to each country’s share of total intra-SACU trade, including re-exports.
• The excise component, net of the development component, is allocated on the basis of GDP.
• The development component is set at 15 percent of the total excise pool. The share accruing to each member country is calculated based on the country’s GDP per capita compared to the average of SACU’s GDP per capita. The development component ensures that poorer countries, that is countries whose GDP per capita falls below the SACU’s per capita average, are compensated by the other relatively well off member states.
2008 TAX STATISTICS
6
Table 1.5: Share received from SACU pool, 2000/01 – 2007/08
R millionBotswana Lesotho Namibia Swaziland Total BLNS South Africa1 Total
1999/00 2 552.0 1 183.1 2 240.7 1 221.5 7 197.3 8 800.9 15 998.2
2000/01 2 986.4 1 126.1 2 877.3 1 406.2 8 396.1 9 277.6 17 673.6
2001/02 2 622.4 1 438.2 2 641.2 1 503.1 8 204.8 10 731.0 18 935.9
2002/03 2 574.8 1 470.0 2 596.9 1 617.8 8 259.4 12 500.5 20 759.9
2003/04 3 387.6 1 421.7 3 035.6 1 877.8 9 722.7 11 137.4 20 860.1
2004/05 4 336.7 2 012.4 4 206.8 2 771.9 13 327.8 13 642.4 26 970.2
2005/06 4 772.6 2 306.0 3 891.9 3 136.2 14 106.7 19 900.6 34 007.3
2006/07 7 756.3 3 945.0 8 161.2 5 321.1 25 183.6 16 165.5 41 349.1
2007/08 9 001.4 4 097.7 6 621.8 4 989.0 24 709.9 21 458.7 46 168.7
Percentage of total1999/00 16.0% 7.4% 14.0% 7.6% 45.0% 55.0% 100.0%
2000/01 16.9% 6.4% 16.3% 8.0% 47.5% 52.5% 100.0%
2001/02 13.8% 7.6% 13.9% 7.9% 43.3% 56.7% 100.0%
2002/03 12.4% 7.1% 12.5% 7.8% 39.8% 60.2% 100.0%
2003/04 16.2% 6.8% 14.6% 9.0% 46.6% 53.4% 100.0%
2004/05 16.1% 7.5% 15.6% 10.3% 49.4% 50.6% 100.0%
2005/06 14.0% 6.8% 11.4% 9.2% 41.5% 58.5% 100.0%
2006/07 18.8% 9.5% 19.7% 12.9% 60.9% 39.1% 100.0%
2007/08 19.5% 8.9% 14.3% 10.8% 53.5% 46.5% 100.0%
Percentage year-on-year growth2000/01 17.0% -4.8% 28.4% 15.1% 16.7% 5.4% 10.5%
2001/02 -12.2% 27.7% -8.2% 6.9% -2.3% 15.7% 7.1%
2002/03 -1.8% 2.2% -1.7% 7.6% 0.7% 16.5% 9.6%
2003/04 31.6% -3.3% 16.9% 16.1% 17.7% -10.9% 0.5%
2004/05 28.0% 41.5% 38.6% 47.6% 37.1% 22.5% 29.3%
2005/06 10.1% 14.6% -7.5% 13.1% 5.8% 45.9% 26.1%
2006/07 62.5% 71.1% 109.7% 69.7% 78.5% -18.8% 21.6%
2007/08 16.1% 3.9% -18.9% -6.2% -1.9% 32.7% 11.7%1. Includes amounts allocated to South Africa, the balance of the "surplus/deficit" for that fiscal year and allocations to
the SACU Secretariat.
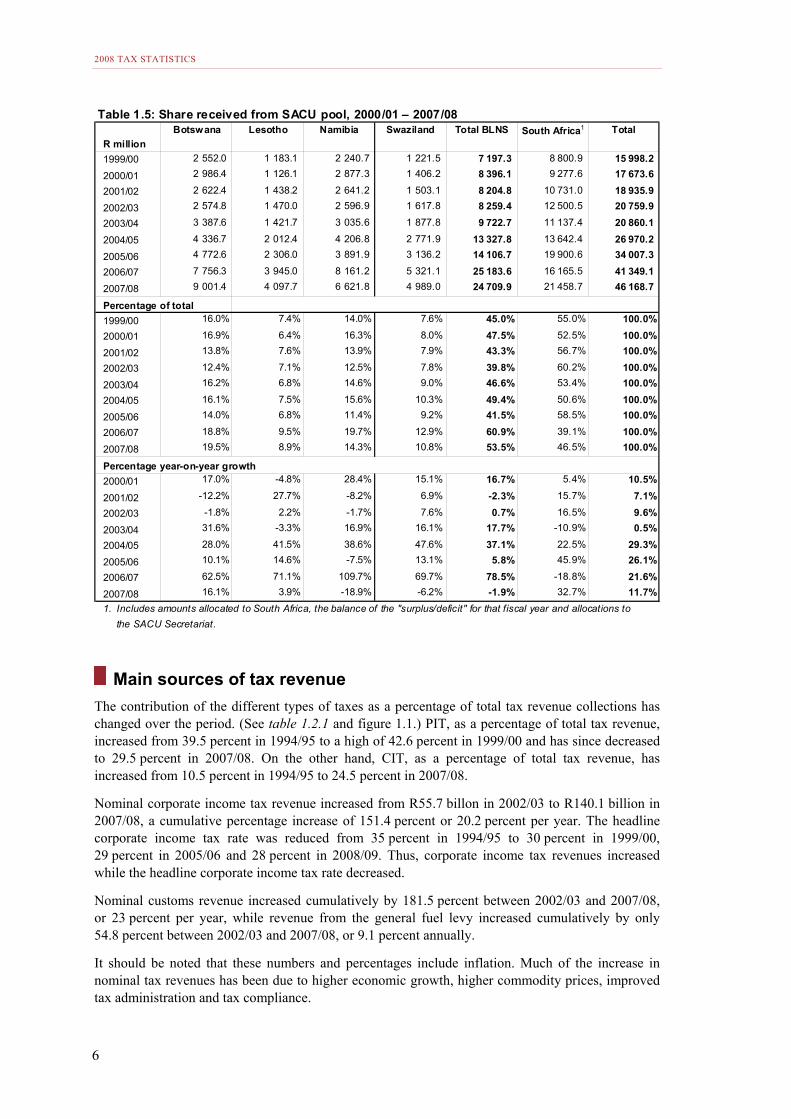
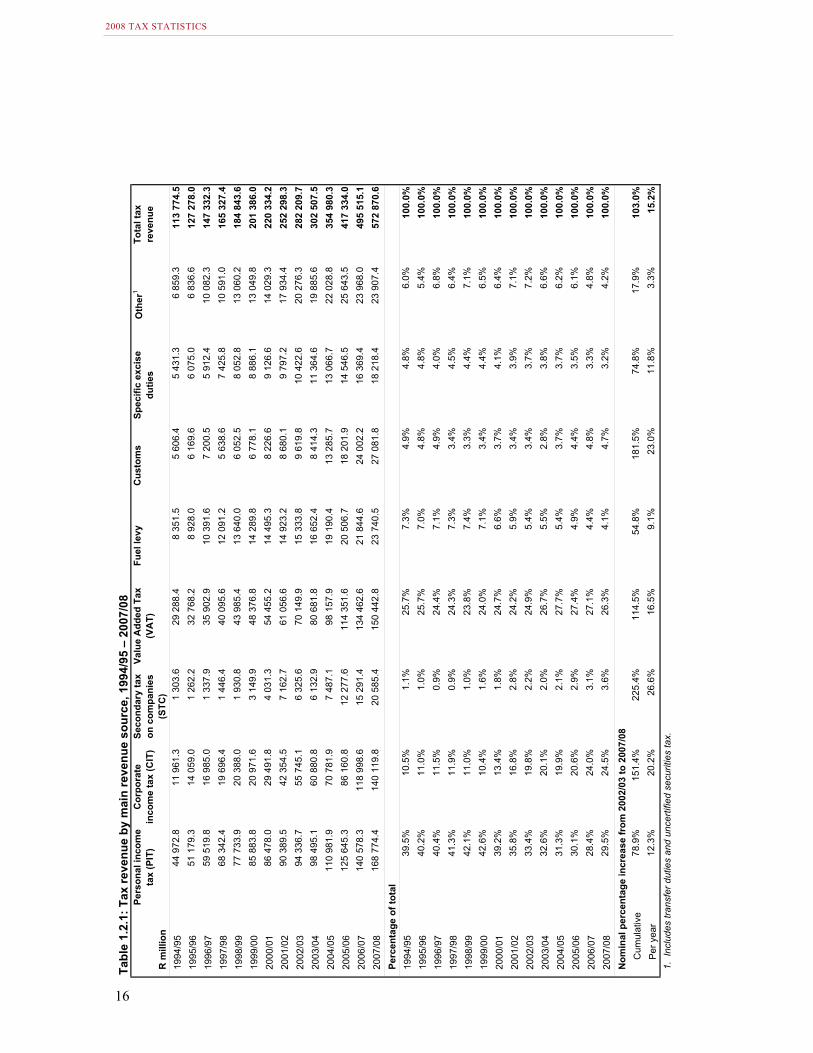
Main sources of tax revenue The contribution of the different types of taxes as a percentage of total tax revenue collections has changed over the period. (See table 1.2.1 and figure 1.1.) PIT, as a percentage of total tax revenue, increased from 39.5 percent in 1994/95 to a high of 42.6 percent in 1999/00 and has since decreased to 29.5 percent in 2007/08. On the other hand, CIT, as a percentage of total tax revenue, has increased from 10.5 percent in 1994/95 to 24.5 percent in 2007/08.
Nominal corporate income tax revenue increased from R55.7 billon in 2002/03 to R140.1 billion in 2007/08, a cumulative percentage increase of 151.4 percent or 20.2 percent per year. The headline corporate income tax rate was reduced from 35 percent in 1994/95 to 30 percent in 1999/00, 29 percent in 2005/06 and 28 percent in 2008/09. Thus, corporate income tax revenues increased while the headline corporate income tax rate decreased.
Nominal customs revenue increased cumulatively by 181.5 percent between 2002/03 and 2007/08, or 23 percent per year, while revenue from the general fuel levy increased cumulatively by only 54.8 percent between 2002/03 and 2007/08, or 9.1 percent annually.
It should be noted that these numbers and percentages include inflation. Much of the increase in nominal tax revenues has been due to higher economic growth, higher commodity prices, improved tax administration and tax compliance.
CHAPTER 1: OVERVIEW OF REVENUE COLLECTIONS
7
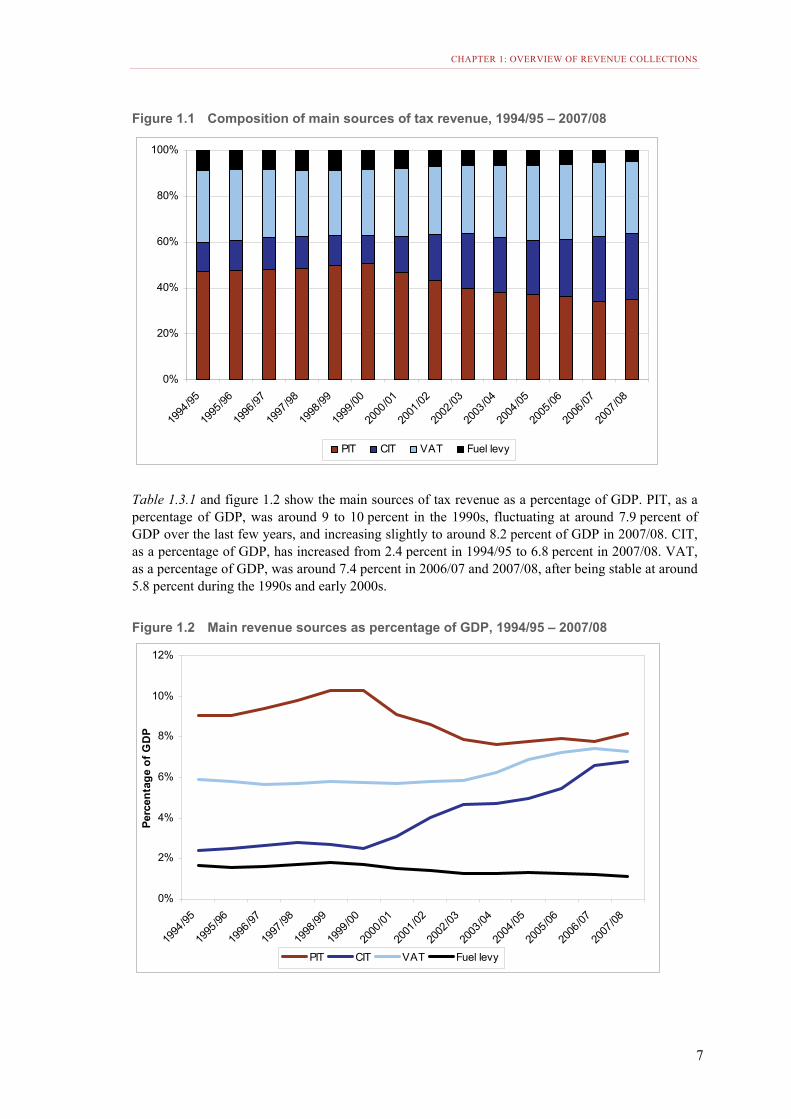
Figure 1.1 Composition of main sources of tax revenue, 1994/95 – 2007/08
0%
20%
40%
60%
80%
100%
1994
/95
1995
/96
1996
/97
1997
/98
1998
/99
1999
/00
2000
/01
2001
/02
2002
/03
2003
/04
2004
/05
2005
/06
2006
/07
2007
/08
PIT CIT VAT Fuel levy
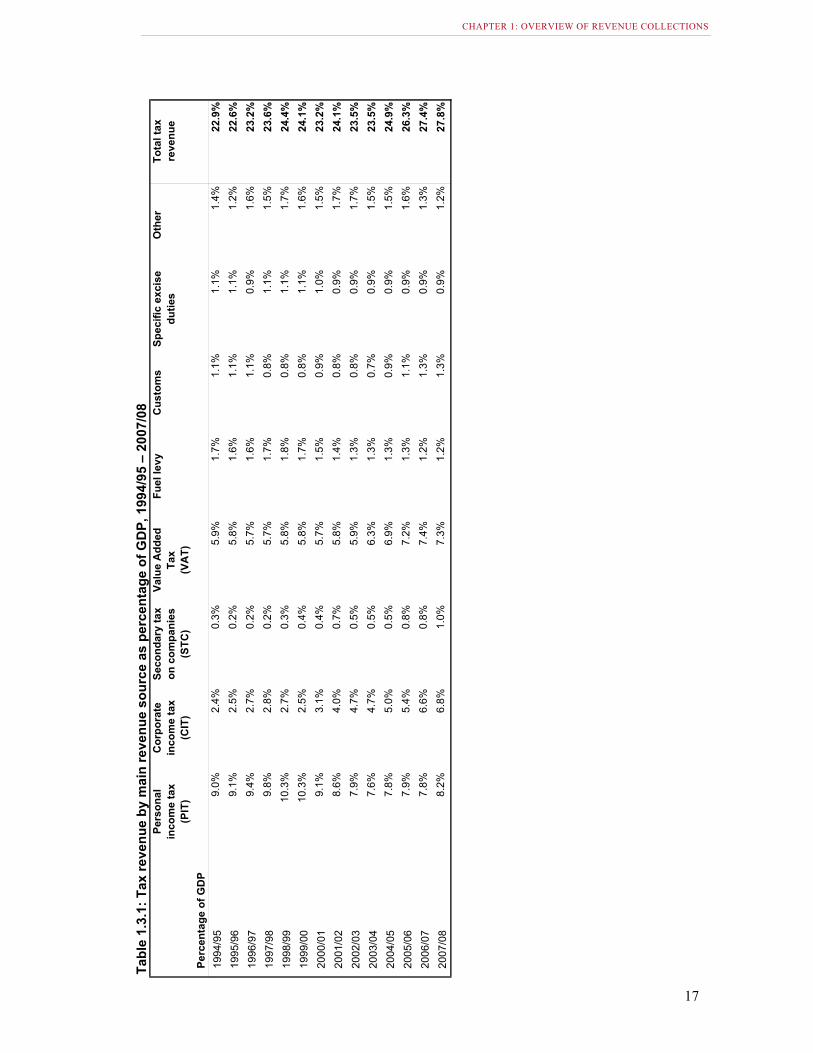
Table 1.3.1 and figure 1.2 show the main sources of tax revenue as a percentage of GDP. PIT, as a percentage of GDP, was around 9 to 10 percent in the 1990s, fluctuating at around 7.9 percent of GDP over the last few years, and increasing slightly to around 8.2 percent of GDP in 2007/08. CIT, as a percentage of GDP, has increased from 2.4 percent in 1994/95 to 6.8 percent in 2007/08. VAT, as a percentage of GDP, was around 7.4 percent in 2006/07 and 2007/08, after being stable at around 5.8 percent during the 1990s and early 2000s.
Figure 1.2 Main revenue sources as percentage of GDP, 1994/95 – 2007/08
0%
2%
4%
6%
8%
10%
12%
1994
/95
1995
/96
1996
/97
1997
/98
1998
/99
1999
/00
2000
/01
2001
/02
2002
/03
2003
/04
2004
/05
2005
/06
2006
/07
2007
/08
Perc
enta
ge o
f GD
P
PIT CIT VAT Fuel levy
2008 TAX STATISTICS
8
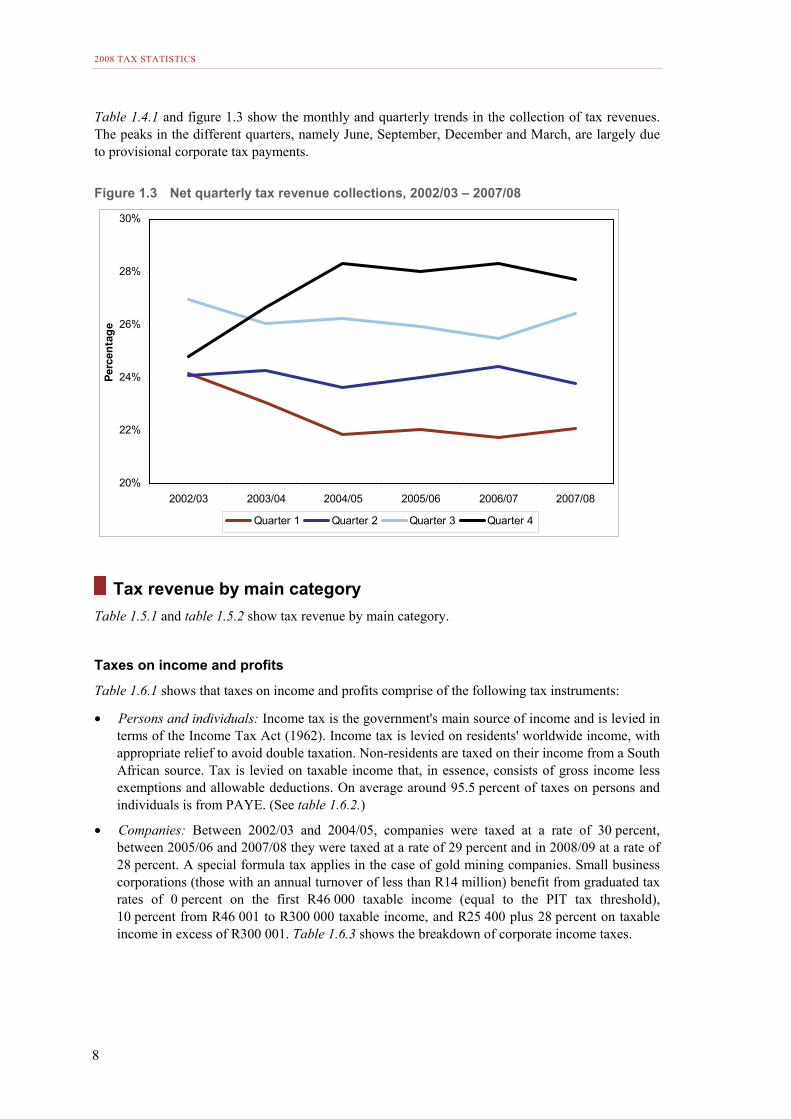
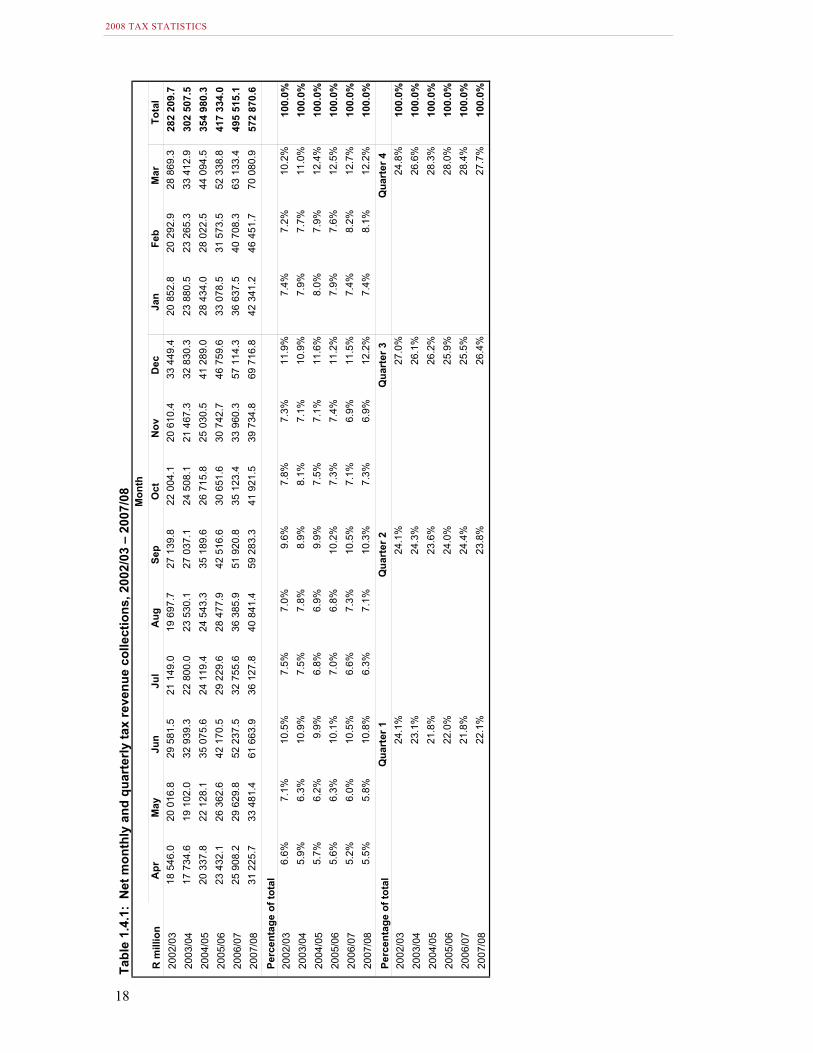
Table 1.4.1 and figure 1.3 show the monthly and quarterly trends in the collection of tax revenues. The peaks in the different quarters, namely June, September, December and March, are largely due to provisional corporate tax payments.
Figure 1.3 Net quarterly tax revenue collections, 2002/03 – 2007/08
20%
22%
24%
26%
28%
30%
2002/03 2003/04 2004/05 2005/06 2006/07 2007/08
Perc
enta
ge
Quarter 1 Quarter 2 Quarter 3 Quarter 4
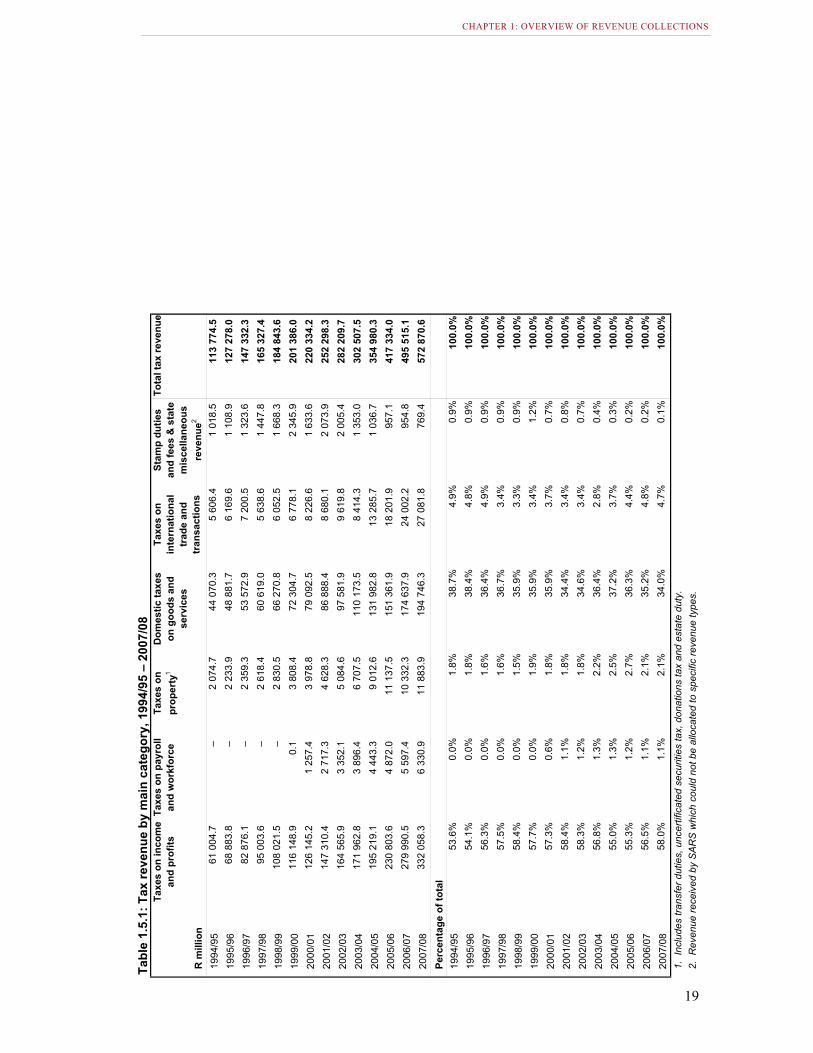
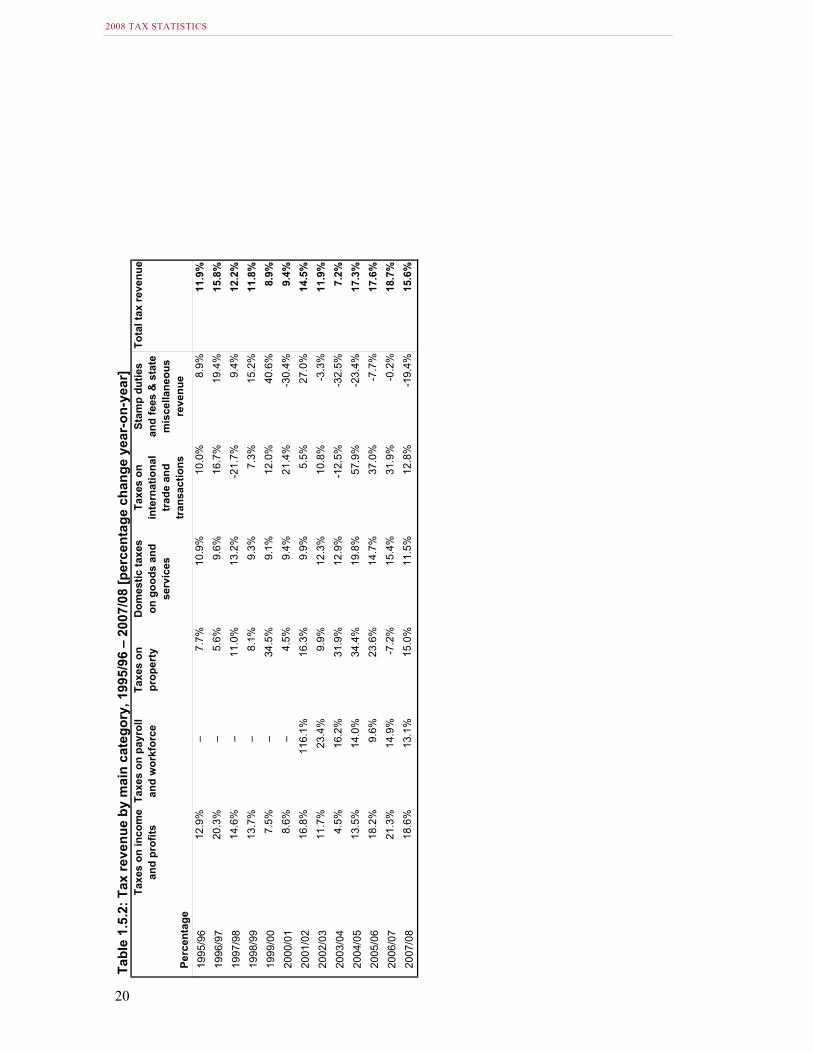
Tax revenue by main category Table 1.5.1 and table 1.5.2 show tax revenue by main category.
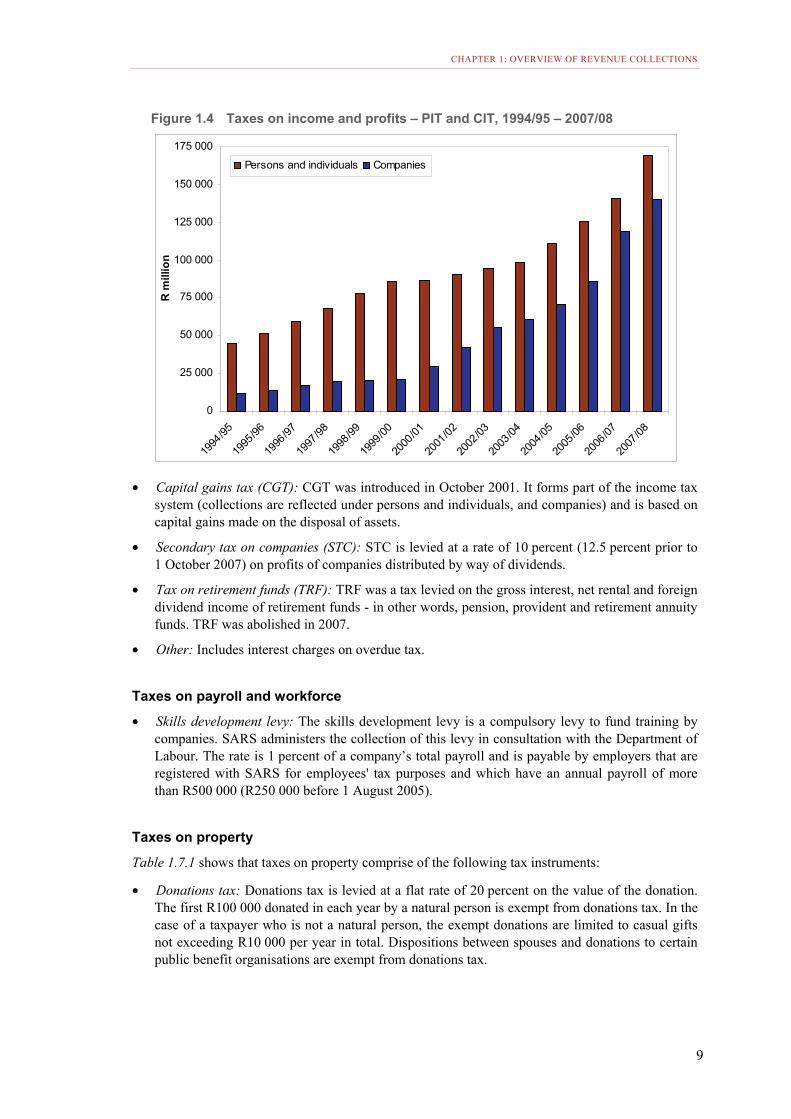
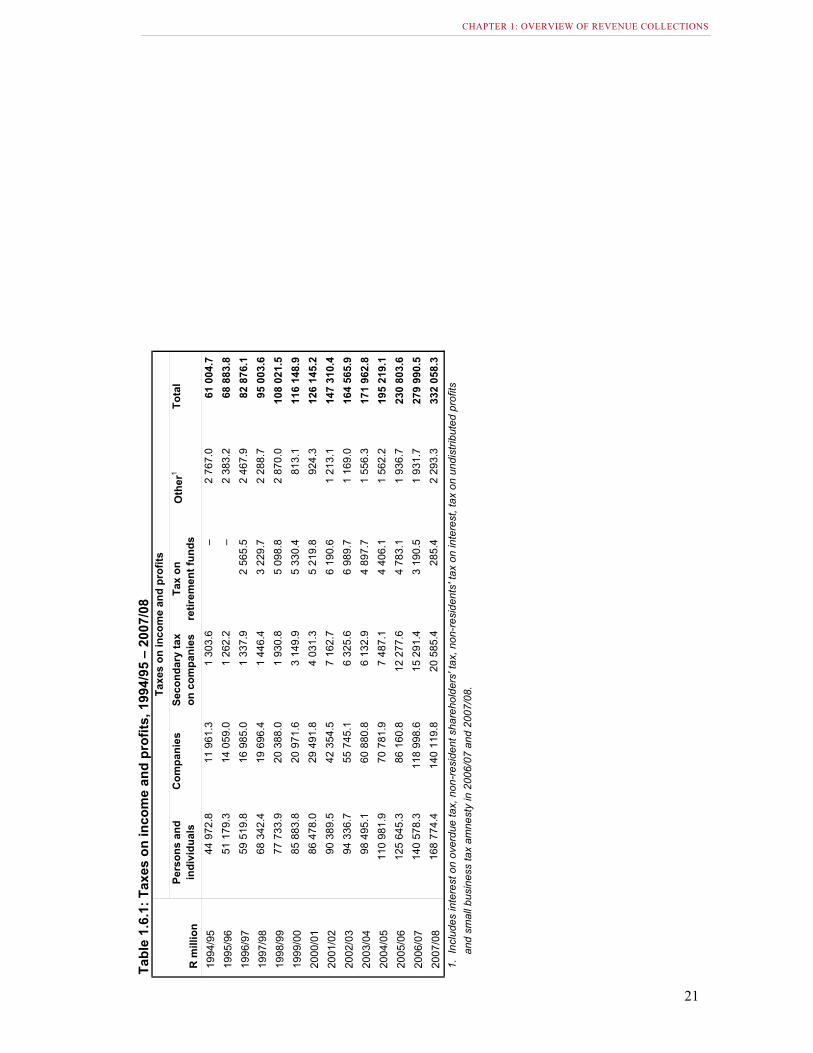
Taxes on income and profits
Table 1.6.1 shows that taxes on income and profits comprise of the following tax instruments:
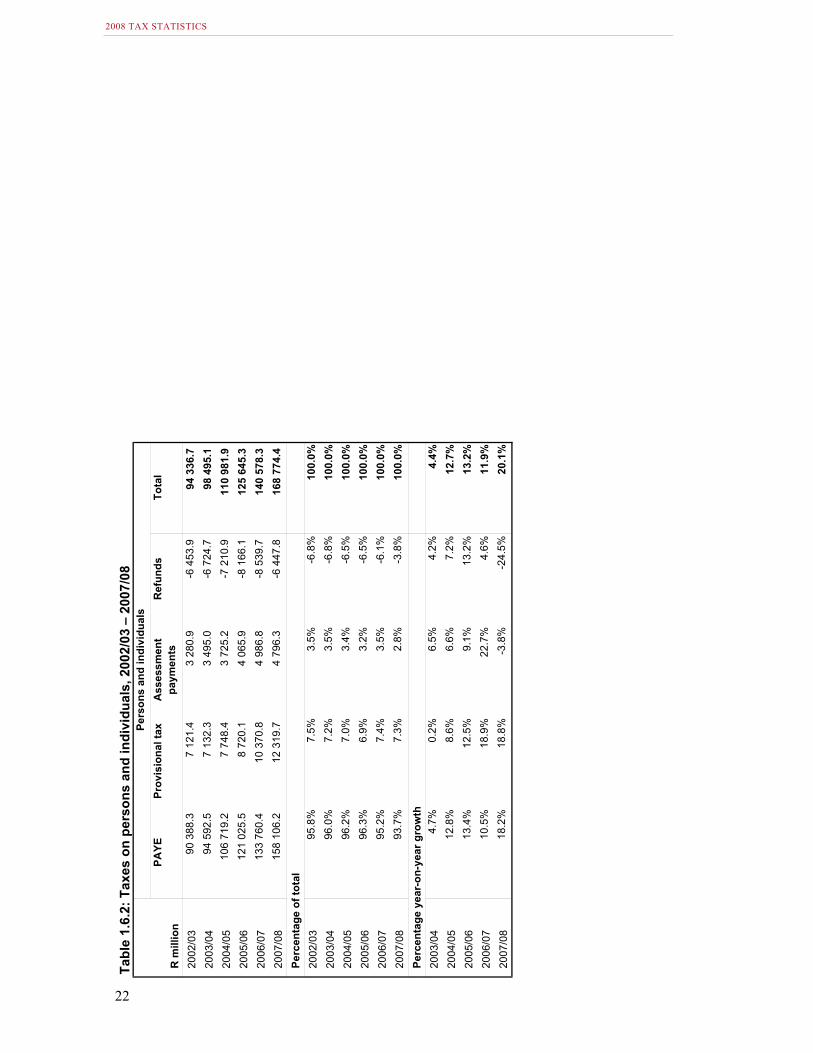
• Persons and individuals: Income tax is the government's main source of income and is levied in terms of the Income Tax Act (1962). Income tax is levied on residents' worldwide income, with appropriate relief to avoid double taxation. Non-residents are taxed on their income from a South African source. Tax is levied on taxable income that, in essence, consists of gross income less exemptions and allowable deductions. On average around 95.5 percent of taxes on persons and individuals is from PAYE. (See table 1.6.2.)
• Companies: Between 2002/03 and 2004/05, companies were taxed at a rate of 30 percent, between 2005/06 and 2007/08 they were taxed at a rate of 29 percent and in 2008/09 at a rate of 28 percent. A special formula tax applies in the case of gold mining companies. Small business corporations (those with an annual turnover of less than R14 million) benefit from graduated tax rates of 0 percent on the first R46 000 taxable income (equal to the PIT tax threshold), 10 percent from R46 001 to R300 000 taxable income, and R25 400 plus 28 percent on taxable income in excess of R300 001. Table 1.6.3 shows the breakdown of corporate income taxes.
CHAPTER 1: OVERVIEW OF REVENUE COLLECTIONS
9
Figure 1.4 Taxes on income and profits – PIT and CIT, 1994/95 – 2007/08
0
25 000
50 000
75 000
100 000
125 000
150 000
175 000
1994
/95
1995
/96
1996
/97
1997
/98
1998
/99
1999
/00
2000
/01
2001
/02
2002
/03
2003
/04
2004
/05
2005
/06
2006
/07
2007
/08
R m
illio
nPersons and individuals Companies
• Capital gains tax (CGT): CGT was introduced in October 2001. It forms part of the income tax system (collections are reflected under persons and individuals, and companies) and is based on capital gains made on the disposal of assets.
• Secondary tax on companies (STC): STC is levied at a rate of 10 percent (12.5 percent prior to 1 October 2007) on profits of companies distributed by way of dividends.
• Tax on retirement funds (TRF): TRF was a tax levied on the gross interest, net rental and foreign dividend income of retirement funds - in other words, pension, provident and retirement annuity funds. TRF was abolished in 2007.
• Other: Includes interest charges on overdue tax.
Taxes on payroll and workforce
• Skills development levy: The skills development levy is a compulsory levy to fund training by companies. SARS administers the collection of this levy in consultation with the Department of Labour. The rate is 1 percent of a company’s total payroll and is payable by employers that are registered with SARS for employees' tax purposes and which have an annual payroll of more than R500 000 (R250 000 before 1 August 2005).
Taxes on property
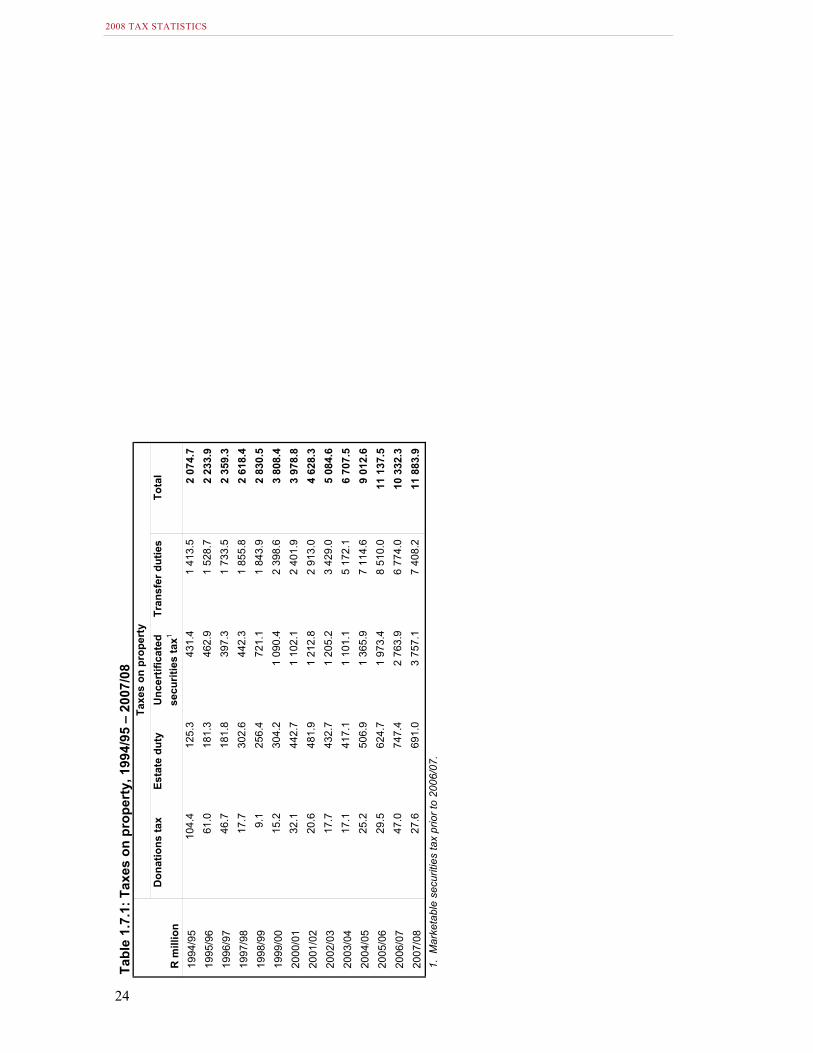
Table 1.7.1 shows that taxes on property comprise of the following tax instruments:
• Donations tax: Donations tax is levied at a flat rate of 20 percent on the value of the donation. The first R100 000 donated in each year by a natural person is exempt from donations tax. In the case of a taxpayer who is not a natural person, the exempt donations are limited to casual gifts not exceeding R10 000 per year in total. Dispositions between spouses and donations to certain public benefit organisations are exempt from donations tax.
2008 TAX STATISTICS
10
• Estate duty: For the purposes of estate duty, an estate consists of all property of the deceased including deemed property, such as life insurance policies and payments from pension funds wherever situated. However, the estate of a deceased non-resident consists only of his or her South African assets. The duty, at a rate of 20 percent, is calculated on the dutiable amount of the estate. Certain admissible deductions from the total value of the estate are allowed.
• Uncertificated securities tax (UST): UST is payable in respect of the change in beneficial ownership of listed securities (securities transfer tax (STT) on the transfer of securities as from 1 July 2008). It is levied at a rate of 0.25 percent.
• Transfer duties: Transfer duty is payable by individuals when they acquire property at the rate of 5 percent of the value above R500 000 and at 8 percent of the value exceeding R1 million. When property is acquired by a person other than an individual, such as a company or trust, transfer duty is payable at a rate of 8 percent of the value. All transactions relating to the supply of goods (property) that are subject to VAT are exempt from transfer duty.
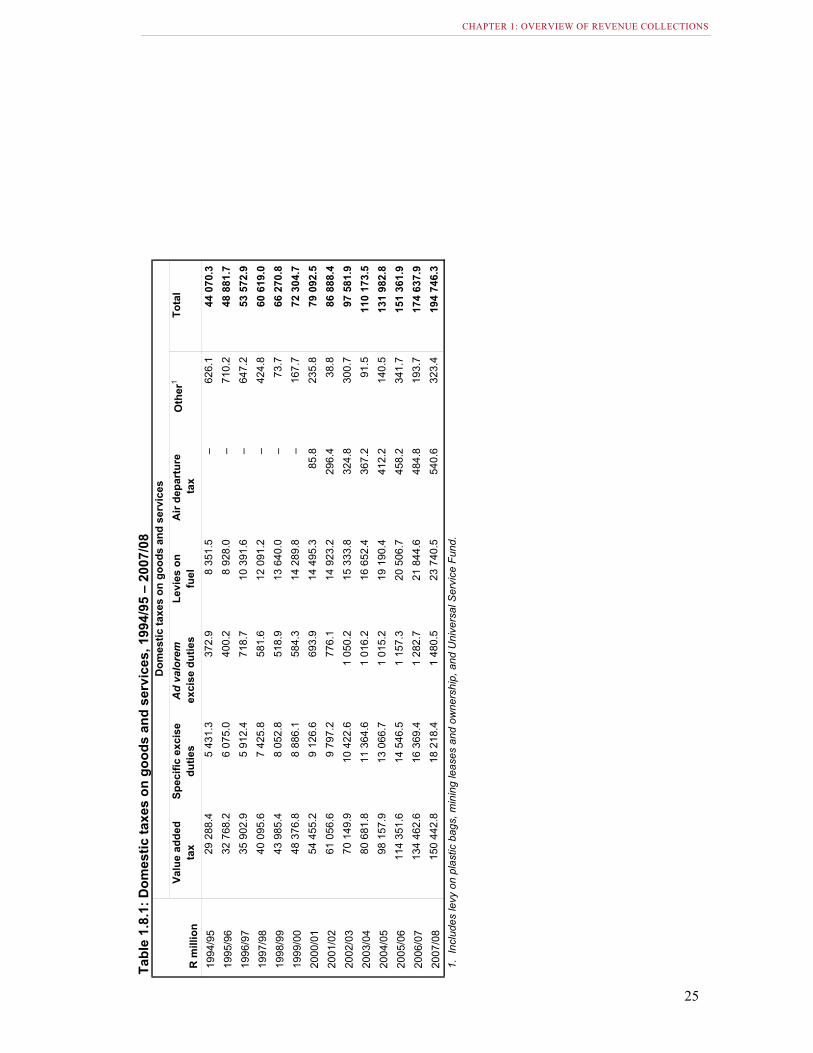
Domestic taxes on goods and services
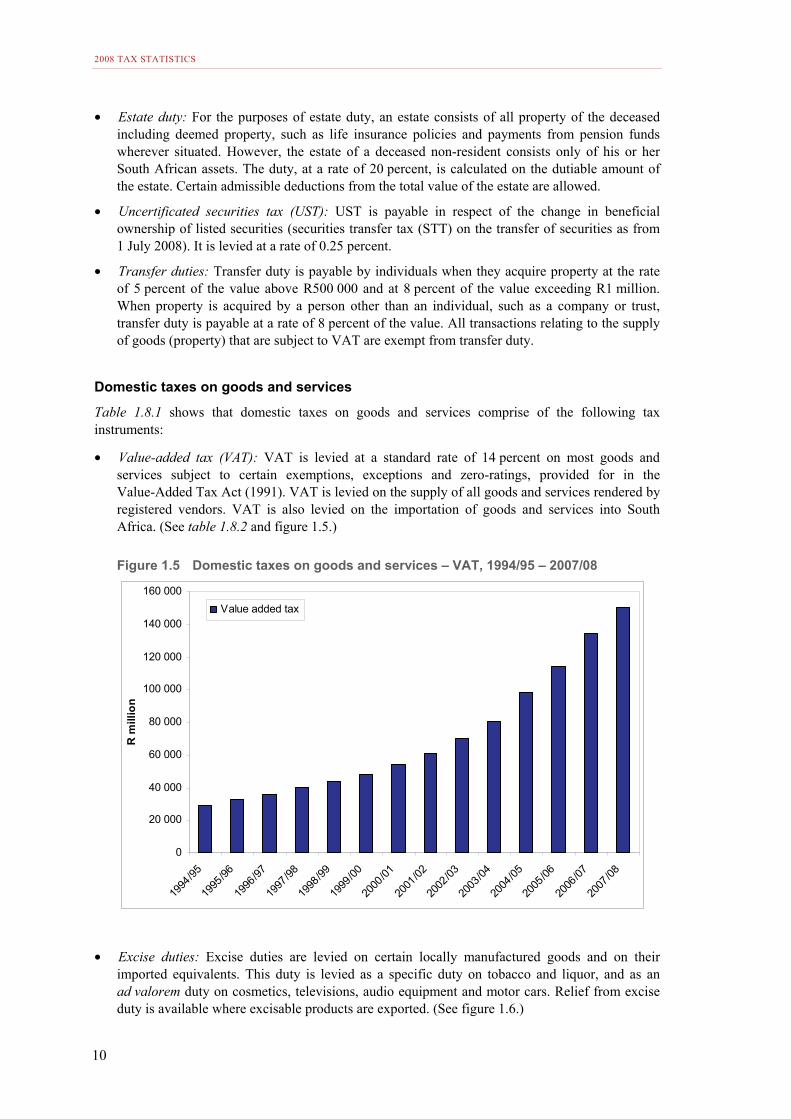
Table 1.8.1 shows that domestic taxes on goods and services comprise of the following tax instruments:
• Value-added tax (VAT): VAT is levied at a standard rate of 14 percent on most goods and services subject to certain exemptions, exceptions and zero-ratings, provided for in the Value-Added Tax Act (1991). VAT is levied on the supply of all goods and services rendered by registered vendors. VAT is also levied on the importation of goods and services into South Africa. (See table 1.8.2 and figure 1.5.)
Figure 1.5 Domestic taxes on goods and services – VAT, 1994/95 – 2007/08
0
20 000
40 000
60 000
80 000
100 000
120 000
140 000
160 000
1994
/95
1995
/96
1996
/97
1997
/98
1998
/99
1999
/00
2000
/01
2001
/02
2002
/03
2003
/04
2004
/05
2005
/06
2006
/07
2007
/08
R m
illio
n
Value added tax
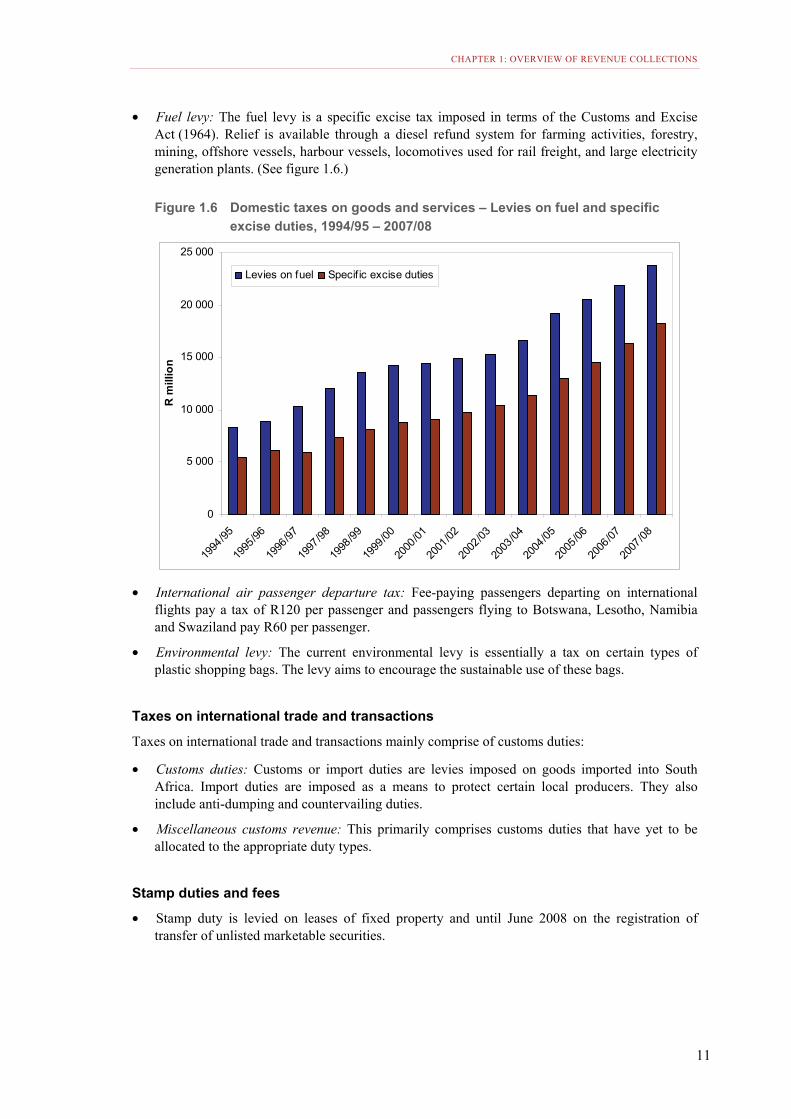
• Excise duties: Excise duties are levied on certain locally manufactured goods and on their imported equivalents. This duty is levied as a specific duty on tobacco and liquor, and as an ad valorem duty on cosmetics, televisions, audio equipment and motor cars. Relief from excise duty is available where excisable products are exported. (See figure 1.6.)
CHAPTER 1: OVERVIEW OF REVENUE COLLECTIONS
11
• Fuel levy: The fuel levy is a specific excise tax imposed in terms of the Customs and Excise Act (1964). Relief is available through a diesel refund system for farming activities, forestry, mining, offshore vessels, harbour vessels, locomotives used for rail freight, and large electricity generation plants. (See figure 1.6.)
Figure 1.6 Domestic taxes on goods and services – Levies on fuel and specific excise duties, 1994/95 – 2007/08
0
5 000
10 000
15 000
20 000
25 000
1994
/95
1995
/96
1996
/97
1997
/98
1998
/99
1999
/00
2000
/01
2001
/02
2002
/03
2003
/04
2004
/05
2005
/06
2006
/07
2007
/08
R m
illio
n
Levies on fuel Specif ic excise duties
• International air passenger departure tax: Fee-paying passengers departing on international
flights pay a tax of R120 per passenger and passengers flying to Botswana, Lesotho, Namibia and Swaziland pay R60 per passenger.
• Environmental levy: The current environmental levy is essentially a tax on certain types of plastic shopping bags. The levy aims to encourage the sustainable use of these bags.
Taxes on international trade and transactions
Taxes on international trade and transactions mainly comprise of customs duties:
• Customs duties: Customs or import duties are levies imposed on goods imported into South Africa. Import duties are imposed as a means to protect certain local producers. They also include anti-dumping and countervailing duties.
• Miscellaneous customs revenue: This primarily comprises customs duties that have yet to be allocated to the appropriate duty types.
Stamp duties and fees
• Stamp duty is levied on leases of fixed property and until June 2008 on the registration of transfer of unlisted marketable securities.
2008 TAX STATISTICS
12
State miscellaneous revenue
• This is revenue received by SARS in respect of taxation that cannot be allocated to specific revenue types.
Other revenue collected by SARS
• Unemployment Insurance Fund (UIF) contributions: The UIF provides short term relief to workers when they become unemployed or are unable to work because of maternity or adoption leave, or illness. It also provides relief to the dependants of a deceased contributor. The bulk of contributions to the UIF is collected by SARS and transferred to the fund, which is administered by the unemployment insurance commissioner.
• Road Accident Fund (RAF): SARS is responsible for the collection of the RAF levy on petrol and diesel.
Other taxes
• Provincial governments impose taxes such as motor vehicle licence fees and gaming (gambling) taxes. Local governments partly finance the provision of municipal services by levying rates on the value of immovable property.
Tax relief Both individuals and companies have benefited from the tax relief over the last few years. However, most of the tax relief has accrued to individuals. Table 1.9.1 provides a summary of tax relief.
Changes in tax policy between 2002/03 and 2006/07 included significant personal income tax relief, through adjustments to the personal income tax brackets and the primary and secondary rebate thresholds, and a marginal reduction in the headline corporate income tax rate.
The effectiveness of tax administration continued to improve during this period. This was supported by measures to improve the fairness of the tax system by closing down various tax loopholes and enhanced efforts at ensuring tax compliance.
Tax rates Table 1.10.1 shows the maximum marginal tax rates for the major tax instruments. The maximum PIT tax rate has remained constant at 40 percent. The headline CIT rate was reduced from 30 percent to 28 percent. PIT relief was provided over the last five years by significantly adjusting the income tax brackets while leaving the marginal tax rates unchanged.
Roles of National Treasury and SARS
National Treasury
The Tax Policy Unit within National Treasury advises the Minister of Finance on the formulation of tax policy and is also responsible for drafting tax legislation, tax revenue analysis and tax revenue forecasting, in consultation with SARS.
CHAPTER 1: OVERVIEW OF REVENUE COLLECTIONS
13
The Tax Policy Unit aims to design tax instruments that fulfil revenue-raising objectives, achieve efficiency and equity objectives, and support redistributive and social policy objectives. In designing tax policy, there is close co-operation between SARS and National Treasury; consultation with other stakeholders, both the public and private sector, is also viewed as important.
South African Revenue Service
The South African Revenue Service Act (1997) (the SARS Act) gives SARS the mandate to:
• collect all tax revenues that are due to the fiscus
• ensure maximum compliance with relevant legislation
• provide a customs service that will maximise revenue, facilitate trade and protect ports of entry against smuggling and other illegal trade.
SARS’ main functions are to:
• collect and administer all national taxes, duties and levies
• collect revenue that may be imposed under any other legislation, as agreed between SARS and an organ of state or institution entitled to the revenue
• provide protection against the illegal importation and exportation of goods
• facilitate trade
• advise the Minister of Finance on tax revenue matters.
SARS is responsible for collecting a wide range of taxes:
• Personal income tax (PIT), including capital gains tax (CGT)
• Corporate income tax (CIT), including CGT
• Value-added tax (VAT)
• Customs/import duties
• Excise duties
• Donations tax
• Transfer duty
• Estate duty
• Stamp duty (until March 2009)
• Uncertificated securities tax (securities transfer tax from 1 July 2008)
• Skills development levy
• Unemployment insurance fund (UIF) contributions
• International air passenger departure tax
• Donations tax
• Fuel levy
• Environmental levy
• Other taxes.
2008 TAX STATISTICS
14
Operating cost of SARS
The operating cost to revenue ratio is an indication of the efficiency with which revenue is collected. However, this ratio is influenced by the tax bases of the different taxes collected and systems development costs. Table 1.11.1 shows that this ratio is around 1 percent.
•
Tables
Table 1.1.1 Provincial and local government tax revenue, 2002/03 – 2007/08 ........................ 15
Table 1.2.1 Tax revenue by main revenue source, 1994/95 – 2007/08 .................................. 16
Table 1.3.1 Tax revenue by main revenue source as percentage of GDP, 1994/95 – 2007/08 ................................................................................................................... 17
Table 1.4.1 Net monthly and quarterly tax revenue collections, 2002/03 – 2007/08 ............ 18
Table 1.5.1 Tax revenue by main category, 1994/95 – 2007/08 ............................................. 19
Table 1.5.2 Tax revenue by main category, 1994/95 – 2007/08 [percentage change year-on-year]. 20
Table 1.6.1 Taxes on income and profits, 1994/95 – 2007/08................................................ 21 Table 1.6.2 Taxes on persons and individuals, 2002/03 – 2007/08 .................................................. 22
Table 1.6.3 Taxes on companies, 2002/03 – 2007/08....................................................................... 23
Table 1.7.1 Taxes on property, 1994/95 – 2007/08................................................................. 24
Table 1.8.1 Domestic taxes on goods and services, 1994/95 – 2007/08................................ 25 Table 1.8.2 Value-added tax (VAT), 2002/03 – 2007/08 ................................................................. 26
Table 1.9.1 Summary of tax relief, 2002/03 – 2007/08........................................................... 27
Table 1.10.1 Maximum marginal tax rates, 2002/03 – 2007/08............................................... 27
Table 1.11.1 Total tax revenue and cost of collections, 1998/99 – 2007/08............................ 28
Tabl
e 1.
1.1:
Pro
vinc
ial a
nd lo
cal g
over
nmen
t tax
reve
nue,
200
2/03
– 2
007/
08Pr
ovin
ces1
Loca
l gov
ernm
ent2
R m
illio
n
Cas
ino
taxe
sH
orse
ra
cing
ta
xes
Liqu
or
licen
ces
Mot
or
vehi
cle
licen
ces
Tota
l pr
ovin
cial
ta
x re
venu
e
Prop
erty
ra
tes
Reg
iona
l se
rvic
e le
vies
3
Tota
l loc
al
gove
rnm
ent
tax
reve
nue
2002
/03
533.
6
10
3.6
14.8
2
121.
4
2 77
3.4
12
602
.8
4
460.
0
17 0
62.8
2003
/04
650.
8
10
3.4
14.4
2
538.
0
3 30
6.6
13
980
.2
4
983.
3
18 9
63.5
2004
/05
723.
0
89
.9
17.7
2
694.
9
3 52
5.5
16
396
.0
7
008.
8
23 4
04.7
2005
/06
896.
2
96
.5
18.8
3
299.
7
4 31
1.2
17
401
.0
7
603.
9
25 0
04.9
2006
/07
1 06
4.8
12
4.5
20.1
3
605.
8
4 81
5.3
18
521
.4
38
5.7
18 9
07.1
2007
/08
1 10
1.7
11
7.2
37.1
3
639.
8
4 89
5.9
21
486
.1
95
.2
21 5
81.3
1. P
rovi
ncia
l num
bers
take
n fro
m th
e P
rovi
ncia
l Bud
gets
and
Exp
endi
ture
Rev
iew
. All
num
bers
rela
ting
to 2
007/
08 a
re B
udge
t n
umbe
rs.
2. L
ocal
gov
ernm
ent n
umbe
rs ta
ken
from
the
Loca
l Gov
ernm
ent B
udge
ts a
nd E
xpen
ditu
re R
evie
w. T
he fi
nanc
ial y
ear o
f the
mun
icip
aliti
es s
tarts
on
1 Ju
ly to
30
June
of t
he fo
llow
ing
year
. N
umbe
rs u
p to
200
5/06
hav
e be
en a
udite
d, a
re
pre
-aud
ited
for 2
006/
07 a
nd b
udge
ted
for 2
007/
08.
3. R
egio
nal s
ervi
ce le
vies
wer
e ab
olis
hed
in 2
006/
07.
CHAPTER 1: OVERVIEW OF REVENUE COLLECTIONS
15
Tabl
e 1.
2.1:
Tax
reve
nue
by m
ain
reve
nue
sour
ce, 1
994/
95 –
200
7/08
R m
illio
n
Pers
onal
inco
me
tax
(PIT
)C
orpo
rate
in
com
e ta
x (C
IT)
Seco
ndar
y ta
x on
com
pani
es
(STC
)
Valu
e A
dded
Tax
(V
AT)
Fuel
levy
Cus
tom
sSp
ecifi
c ex
cise
du
ties
Oth
er1
Tota
l tax
re
venu
e
1994
/95
44 9
72.8
11 9
61.3
1 30
3.6
29 2
88.4
8 35
1.5
5 60
6.4
5 43
1.3
6 85
9.3
113
774.
5
1995
/96
51 1
79.3
14 0
59.0
1 26
2.2
32 7
68.2
8 92
8.0
6 16
9.6
6 07
5.0
6 83
6.6
127
278.
0
1996
/97
59 5
19.8
16 9
85.0
1 33
7.9
35 9
02.9
10 3
91.6
7 20
0.5
5 91
2.4
10 0
82.3
147
332.
3
1997
/98
68 3
42.4
19 6
96.4
1 44
6.4
40 0
95.6
12 0
91.2
5 63
8.6
7 42
5.8
10 5
91.0
165
327.
4
1998
/99
77 7
33.9
20 3
88.0
1 93
0.8
43 9
85.4
13 6
40.0
6 05
2.5
8 05
2.8
13 0
60.2
184
843.
6
1999
/00
85 8
83.8
20 9
71.6
3 14
9.9
48 3
76.8
14 2
89.8
6 77
8.1
8 88
6.1
13 0
49.8
201
386.
0
2000
/01
86 4
78.0
29 4
91.8
4 03
1.3
54 4
55.2
14 4
95.3
8 22
6.6
9 12
6.6
14 0
29.3
220
334.
2
2001
/02
90 3
89.5
42 3
54.5
7 16
2.7
61 0
56.6
14 9
23.2
8 68
0.1
9 79
7.2
17 9
34.4
252
298.
3
2002
/03
94 3
36.7
55 7
45.1
6 32
5.6
70 1
49.9
15 3
33.8
9 61
9.8
10 4
22.6
20 2
76.3
282
209.
7
2003
/04
98 4
95.1
60 8
80.8
6 13
2.9
80 6
81.8
16 6
52.4
8 41
4.3
11 3
64.6
19 8
85.6
302
507.
5
2004
/05
110
981.
970
781
.97
487.
198
157
.919
190
.413
285
.713
066
.722
028
.835
4 98
0.3
2005
/06
125
645.
386
160
.812
277
.611
4 35
1.6
20 5
06.7
18 2
01.9
14 5
46.5
25 6
43.5
417
334.
0
2006
/07
140
578.
311
8 99
8.6
15 2
91.4
134
462.
621
844
.624
002
.216
369
.423
968
.049
5 51
5.1
2007
/08
168
774.
414
0 11
9.8
20 5
85.4
150
442.
823
740
.527
081
.818
218
.423
907
.457
2 87
0.6
Perc
enta
ge o
f tot
al19
94/9
539
.5%
10.5
%1.
1%25
.7%
7.3%
4.9%
4.8%
6.0%
100.
0%
1995
/96
40.2
%11
.0%
1.0%
25.7
%7.
0%4.
8%4.
8%5.
4%10
0.0%
1996
/97
40.4
%11
.5%
0.9%
24.4
%7.
1%4.
9%4.
0%6.
8%10
0.0%
1997
/98
41.3
%11
.9%
0.9%
24.3
%7.
3%3.
4%4.
5%6.
4%10
0.0%
1998
/99
42.1
%11
.0%
1.0%
23.8
%7.
4%3.
3%4.
4%7.
1%10
0.0%
1999
/00
42.6
%10
.4%
1.6%
24.0
%7.
1%3.
4%4.
4%6.
5%10
0.0%
2000
/01
39.2
%13
.4%
1.8%
24.7
%6.
6%3.
7%4.
1%6.
4%10
0.0%
2001
/02
35.8
%16
.8%
2.8%
24.2
%5.
9%3.
4%3.
9%7.
1%10
0.0%
2002
/03
33.4
%19
.8%
2.2%
24.9
%5.
4%3.
4%3.
7%7.
2%10
0.0%
2003
/04
32.6
%20
.1%
2.0%
26.7
%5.
5%2.
8%3.
8%6.
6%10
0.0%
2004
/05
31.3
%19
.9%
2.1%
27.7
%5.
4%3.
7%3.
7%6.
2%10
0.0%
2005
/06
30.1
%20
.6%
2.9%
27.4
%4.
9%4.
4%3.
5%6.
1%10
0.0%
2006
/07
28.4
%24
.0%
3.1%
27.1
%4.
4%4.
8%3.
3%4.
8%10
0.0%
2007
/08
29.5
%24
.5%
3.6%
26.3
%4.
1%4.
7%3.
2%4.
2%10
0.0%
Nom
inal
per
cent
age
incr
ease
from
200
2/03
to 2
007/
08C
umul
ativ
e78
.9%
151.
4%22
5.4%
114.
5%54
.8%
181.
5%74
.8%
17.9
%10
3.0%
Per
yea
r12
.3%
20.2
%26
.6%
16.5
%9.
1%23
.0%
11.8
%3.
3%15
.2%
1. I
nclu
des
trans
fer d
utie
s an
d un
certi
fied
secu
ritie
s ta
x.
2008 TAX STATISTICS
16
Tabl
e 1.
3.1:
Tax
reve
nue
by m
ain
reve
nue
sour
ce a
s pe
rcen
tage
of G
DP,
199
4/95
– 2
007/
08
Perc
enta
ge o
f GD
P
Pers
onal
in
com
e ta
x (P
IT)
Cor
pora
te
inco
me
tax
(CIT
)
Seco
ndar
y ta
x on
com
pani
es
(STC
)
Valu
e A
dded
Ta
x (V
AT)
Fuel
levy
Cus
tom
sSp
ecifi
c ex
cise
du
ties
Oth
erTo
tal t
ax
reve
nue
1994
/95
9.0%
2.4%
0.3%
5.9%
1.7%
1.1%
1.1%
1.4%
22.9
%
1995
/96
9.1%
2.5%
0.2%
5.8%
1.6%
1.1%
1.1%
1.2%
22.6
%
1996
/97
9.4%
2.7%
0.2%
5.7%
1.6%
1.1%
0.9%
1.6%
23.2
%
1997
/98
9.8%
2.8%
0.2%
5.7%
1.7%
0.8%
1.1%
1.5%
23.6
%
1998
/99
10.3
%2.
7%0.
3%5.
8%1.
8%0.
8%1.
1%1.
7%24
.4%
1999
/00
10.3
%2.
5%0.
4%5.
8%1.
7%0.
8%1.
1%1.
6%24
.1%
2000
/01
9.1%
3.1%
0.4%
5.7%
1.5%
0.9%
1.0%
1.5%
23.2
%
2001
/02
8.6%
4.0%
0.7%
5.8%
1.4%
0.8%
0.9%
1.7%
24.1
%
2002
/03
7.9%
4.7%
0.5%
5.9%
1.3%
0.8%
0.9%
1.7%
23.5
%
2003
/04
7.6%
4.7%
0.5%
6.3%
1.3%
0.7%
0.9%
1.5%
23.5
%
2004
/05
7.8%
5.0%
0.5%
6.9%
1.3%
0.9%
0.9%
1.5%
24.9
%
2005
/06
7.9%
5.4%
0.8%
7.2%
1.3%
1.1%
0.9%
1.6%
26.3
%
2006
/07
7.8%
6.6%
0.8%
7.4%
1.2%
1.3%
0.9%
1.3%
27.4
%
2007
/08
8.2%
6.8%
1.0%
7.3%
1.2%
1.3%
0.9%
1.2%
27.8
%
CHAPTER 1: OVERVIEW OF REVENUE COLLECTIONS
17
Tabl
e 1.
4.1:
Net
mon
thly
and
qua
rter
ly ta
x re
venu
e co
llect
ions
, 200
2/03
– 2
007/
08 Mon
thR
mill
ion
Apr
May
Jun
Jul
Aug
Sep
Oct
Nov
Dec
Jan
Feb
Mar
Tota
l20
02/0
318
546
.0
20
016
.8
29
581
.5
21
149
.0
19
697
.7
27
139
.8
22
004
.1
20
610
.4
33
449
.4
20
852
.8
20
292
.9
28
869
.3
28
2 20
9.7
2003
/04
17 7
34.6
19 1
02.0
32 9
39.3
22 8
00.0
23 5
30.1
27 0
37.1
24 5
08.1
21 4
67.3
32 8
30.3
23 8
80.5
23 2
65.3
33 4
12.9
302
507.
5
2004
/05
20 3
37.8
22 1
28.1
35 0
75.6
24 1
19.4
24 5
43.3
35 1
89.6
26 7
15.8
25 0
30.5
41 2
89.0
28 4
34.0
28 0
22.5
44 0
94.5
354
980.
3
2005
/06
23 4
32.1
26 3
62.6
42 1
70.5
29 2
29.6
28 4
77.9
42 5
16.6
30 6
51.6
30 7
42.7
46 7
59.6
33 0
78.5
31 5
73.5
52 3
38.8
417
334.
0
2006
/07
25 9
08.2
29 6
29.8
52 2
37.5
32 7
55.6
36 3
85.9
51 9
20.8
35 1
23.4
33 9
60.3
57 1
14.3
36 6
37.5
40 7
08.3
63 1
33.4
495
515.
1
2007
/08
31 2
25.7
33 4
81.4
61 6
63.9
36 1
27.8
40 8
41.4
59 2
83.3
41 9
21.5
39 7
34.8
69 7
16.8
42 3
41.2
46 4
51.7
70 0
80.9
572
870.
6
Perc
enta
ge o
f tot
al20
02/0
36.
6%7.
1%10
.5%
7.5%
7.0%
9.6%
7.8%
7.3%
11.9
%7.
4%7.
2%10
.2%
100.
0%
2003
/04
5.9%
6.3%
10.9
%7.
5%7.
8%8.
9%8.
1%7.
1%10
.9%
7.9%
7.7%
11.0
%10
0.0%
2004
/05
5.7%
6.2%
9.9%
6.8%
6.9%
9.9%
7.5%
7.1%
11.6
%8.
0%7.
9%12
.4%
100.
0%
2005
/06
5.6%
6.3%
10.1
%7.
0%6.
8%10
.2%
7.3%
7.4%
11.2
%7.
9%7.
6%12
.5%
100.
0%
2006
/07
5.2%
6.0%
10.5
%6.
6%7.
3%10
.5%
7.1%
6.9%
11.5
%7.
4%8.
2%12
.7%
100.
0%
2007
/08
5.5%
5.8%
10.8
%6.
3%7.
1%10
.3%
7.3%
6.9%
12.2
%7.
4%8.
1%12
.2%
100.
0%
Perc
enta
ge o
f tot
alQ
uart
er 1
Qua
rter
2Q
uart
er 3
Qua
rter
4
2002
/03
24.1
%24
.1%
27.0
%24
.8%
100.
0%
2003
/04
23.1
%24
.3%
26.1
%26
.6%
100.
0%
2004
/05
21.8
%23
.6%
26.2
%28
.3%
100.
0%
2005
/06
22.0
%24
.0%
25.9
%28
.0%
100.
0%
2006
/07
21.8
%24
.4%
25.5
%28
.4%
100.
0%
2007
/08
22.1
%23
.8%
26.4
%27
.7%
100.
0%
2008 TAX STATISTICS
18
Tabl
e 1.
5.1:
Tax
reve
nue
by m
ain
cate
gory
, 199
4/95
– 2
007/
08
R m
illio
n
Taxe
s on
inco
me
and
prof
itsTa
xes
on p
ayro
ll an
d w
orkf
orce
Taxe
s on
pr
oper
ty1
Dom
estic
taxe
s on
goo
ds a
nd
serv
ices
Taxe
s on
in
tern
atio
nal
trad
e an
d tr
ansa
ctio
ns
Stam
p du
ties
and
fees
& s
tate
m
isce
llane
ous
reve
nue2
Tota
l tax
reve
nue
1994
/95
61 0
04.7
–
2
074.
7
44
070
.3
5 60
6.4
1 01
8.5
113
774.
5
1995
/96
68 8
83.8
–
2
233.
9
48
881
.7
6 16
9.6
1 10
8.9
127
278.
0
1996
/97
82 8
76.1
–
2
359.
3
53
572
.9
7 20
0.5
1 32
3.6
147
332.
3
1997
/98
95 0
03.6
–
2
618.
4
60
619
.0
5 63
8.6
1 44
7.8
165
327.
4
1998
/99
108
021.
5
–
2
830.
5
66
270
.8
6 05
2.5
1 66
8.3
184
843.
6
1999
/00
116
148.
9
0.
1
3
808.
4
72
304
.7
6 77
8.1
2 34
5.9
201
386.
0
2000
/01
126
145.
2
1
257.
4
3
978.
8
79
092
.5
8 22
6.6
1 63
3.6
220
334.
2
2001
/02
147
310.
4
2
717.
3
4
628.
3
86
888
.4
8 68
0.1
2 07
3.9
252
298.
3
2002
/03
164
565.
9
3
352.
1
5
084.
6
97
581
.9
9 61
9.8
2 00
5.4
282
209.
7
2003
/04
171
962.
8
3
896.
4
6
707.
5
11
0 17
3.5
8 41
4.3
1 35
3.0
302
507.
5
2004
/05
195
219.
1
4
443.
3
9
012.
6
13
1 98
2.8
13 2
85.7
1
036.
7
35
4 98
0.3
2005
/06
230
803.
6
4
872.
0
11
137
.5
151
361.
9
18
201
.9
957.
1
417
334.
0
2006
/07
279
990.
5
5
597.
4
10
332
.3
174
637.
9
24
002
.2
954.
8
495
515.
1
2007
/08
332
058.
3
6
330.
9
11
883
.9
194
746.
3
27
081
.8
769.
4
572
870.
6
Perc
enta
ge o
f tot
al19
94/9
553
.6%
0.0%
1.8%
38.7
%4.
9%0.
9%10
0.0%
1995
/96
54.1
%0.
0%1.
8%38
.4%
4.8%
0.9%
100.
0%
1996
/97
56.3
%0.
0%1.
6%36
.4%
4.9%
0.9%
100.
0%
1997
/98
57.5
%0.
0%1.
6%36
.7%
3.4%
0.9%
100.
0%
1998
/99
58.4
%0.
0%1.
5%35
.9%
3.3%
0.9%
100.
0%
1999
/00
57.7
%0.
0%1.
9%35
.9%
3.4%
1.2%
100.
0%
2000
/01
57.3
%0.
6%1.
8%35
.9%
3.7%
0.7%
100.
0%
2001
/02
58.4
%1.
1%1.
8%34
.4%
3.4%
0.8%
100.
0%
2002
/03
58.3
%1.
2%1.
8%34
.6%
3.4%
0.7%
100.
0%
2003
/04
56.8
%1.
3%2.
2%36
.4%
2.8%
0.4%
100.
0%
2004
/05
55.0
%1.
3%2.
5%37
.2%
3.7%
0.3%
100.
0%
2005
/06
55.3
%1.
2%2.
7%36
.3%
4.4%
0.2%
100.
0%
2006
/07
56.5
%1.
1%2.
1%35
.2%
4.8%
0.2%
100.
0%
2007
/08
58.0
%1.
1%2.
1%34
.0%
4.7%
0.1%
100.
0%1.
Inc
lude
s tra
nsfe
r dut
ies,
unc
ertif
icat
ed s
ecur
ities
tax,
don
atio
ns ta
x an
d es
tate
dut
y.2.
Rev
enue
rece
ived
by
SA
RS
whi
ch c
ould
not
be
allo
cate
d to
spe
cific
reve
nue
type
s.
CHAPTER 1: OVERVIEW OF REVENUE COLLECTIONS
19
Tabl
e 1.
5.2:
Tax
reve
nue
by m
ain
cate
gory
, 199
5/96
– 2
007/
08 [p
erce
ntag
e ch
ange
yea
r-on
-yea
r]
Perc
enta
ge
Taxe
s on
inco
me
and
prof
itsTa
xes
on p
ayro
ll an
d w
orkf
orce
Taxe
s on
pr
oper
tyD
omes
tic ta
xes
on g
oods
and
se
rvic
es
Taxe
s on
in
tern
atio
nal
trad
e an
d tr
ansa
ctio
ns
Stam
p du
ties
and
fees
& s
tate
m
isce
llane
ous
reve
nue
Tota
l tax
reve
nue
1995
/96
12.9
%–
7.7%
10.9
%10
.0%
8.9%
11.9
%
1996
/97
20.3
%–
5.6%
9.6%
16.7
%19
.4%
15.8
%
1997
/98
14.6
%–
11.0
%13
.2%
-21.
7%9.
4%12
.2%
1998
/99
13.7
%–
8.1%
9.3%
7.3%
15.2
%11
.8%
1999
/00
7.5%
–
34
.5%
9.1%
12.0
%40
.6%
8.9%
2000
/01
8.6%
–
4.
5%9.
4%21
.4%
-30.
4%9.
4%
2001
/02
16.8
%11
6.1%
16.3
%9.
9%5.
5%27
.0%
14.5
%
2002
/03
11.7
%23
.4%
9.9%
12.3
%10
.8%
-3.3
%11
.9%
2003
/04
4.5%
16.2
%31
.9%
12.9
%-1
2.5%
-32.
5%7.
2%
2004
/05
13.5
%14
.0%
34.4
%19
.8%
57.9
%-2
3.4%
17.3
%
2005
/06
18.2
%9.
6%23
.6%
14.7
%37
.0%
-7.7
%17
.6%
2006
/07
21.3
%14
.9%
-7.2
%15
.4%
31.9
%-0
.2%
18.7
%
2007
/08
18.6
%13
.1%
15.0
%11
.5%
12.8
%-1
9.4%
15.6
%
2008 TAX STATISTICS
20
Tabl
e 1.
6.1:
Tax
es o
n in
com
e an
d pr
ofits
, 199
4/95
– 2
007/
08Ta
xes
on in
com
e an
d pr
ofits
R m
illio
nPe
rson
s an
d in
divi
dual
sC
ompa
nies
Seco
ndar
y ta
x on
com
pani
esTa
x on
re
tirem
ent f
unds
Oth
er1
Tota
l
1994
/95
44 9
72.8
11
961
.3
1 30
3.6
–
2 76
7.0
61 0
04.7
1995
/96
51 1
79.3
14
059
.0
1 26
2.2
–
2 38
3.2
68 8
83.8
1996
/97
59 5
19.8
16
985
.0
1 33
7.9
2 56
5.5
2 46
7.9
82 8
76.1
1997
/98
68 3
42.4
19
696
.4
1 44
6.4
3 22
9.7
2 28
8.7
95 0
03.6
1998
/99
77 7
33.9
20
388
.0
1 93
0.8
5 09
8.8
2 87
0.0
108
021.
5
1999
/00
85 8
83.8
20
971
.6
3 14
9.9
5 33
0.4
813.
1
116
148.
9
2000
/01
86 4
78.0
29
491
.8
4 03
1.3
5 21
9.8
924.
3
126
145.
2
2001
/02
90 3
89.5
42
354
.5
7 16
2.7
6 19
0.6
1 21
3.1
147
310.
4
2002
/03
94 3
36.7
55
745
.1
6 32
5.6
6 98
9.7
1 16
9.0
164
565.
9
2003
/04
98 4
95.1
60
880
.8
6 13
2.9
4 89
7.7
1 55
6.3
171
962.
8
2004
/05
110
981.
9
70
781
.9
7 48
7.1
4 40
6.1
1 56
2.2
195
219.
1
2005
/06
125
645.
3
86
160
.8
12 2
77.6
4
783.
1
1
936.
7
23
0 80
3.6
2006
/07
140
578.
3
11
8 99
8.6
15 2
91.4
3
190.
5
1
931.
7
27
9 99
0.5
2007
/08
168
774.
4
14
0 11
9.8
20 5
85.4
28
5.4
2
293.
3
33
2 05
8.3
1. I
nclu
des
inte
rest
on
over
due
tax,
non
-res
iden
t sha
reho
lder
s' ta
x, n
on-r
esid
ents
' tax
on
inte
rest
, tax
on
undi
strib
uted
pro
fits
and
sm
all b
usin
ess
tax
amne
sty
in 2
006/
07 a
nd 2
007/
08.
CHAPTER 1: OVERVIEW OF REVENUE COLLECTIONS
21
Tabl
e 1.
6.2:
Tax
es o
n pe
rson
s an
d in
divi
dual
s, 2
002/
03 –
200
7/08
Pers
ons
and
indi
vidu
als
R m
illio
nPA
YEPr
ovis
iona
l tax
Ass
essm
ent
paym
ents
Ref
unds
Tota
l
2002
/03
90 3
88.3
7
121.
4
3
280.
9
-6
453
.994
336
.7
2003
/04
94 5
92.5
7
132.
3
3
495.
0
-6
724
.798
495
.1
2004
/05
106
719.
2
7
748.
4
3
725.
2
-7
210
.911
0 98
1.9
2005
/06
121
025.
5
8
720.
1
4
065.
9
-8
166
.112
5 64
5.3
2006
/07
133
760.
4
10
370
.8
4 98
6.8
-8 5
39.7
140
578.
3
2007
/08
158
106.
2
12
319
.7
4 79
6.3
-6 4
47.8
168
774.
4
Perc
enta
ge o
f tot
al20
02/0
395
.8%
7.5%
3.5%
-6.8
%10
0.0%
2003
/04
96.0
%7.
2%3.
5%-6
.8%
100.
0%
2004
/05
96.2
%7.
0%3.
4%-6
.5%
100.
0%
2005
/06
96.3
%6.
9%3.
2%-6
.5%
100.
0%
2006
/07
95.2
%7.
4%3.
5%-6
.1%
100.
0%
2007
/08
93.7
%7.
3%2.
8%-3
.8%
100.
0%
Perc
enta
ge y
ear-
on-y
ear g
row
th20
03/0
44.
7%0.
2%6.
5%4.
2%4.
4%
2004
/05
12.8
%8.
6%6.
6%7.
2%12
.7%
2005
/06
13.4
%12
.5%
9.1%
13.2
%13
.2%
2006
/07
10.5
%18
.9%
22.7
%4.
6%11
.9%
2007
/08
18.2
%18
.8%
-3.8
%-2
4.5%
20.1
%
2008 TAX STATISTICS
22

Tabl
e 1.
6.3:
Tax
es o
n co
mpa
nies
, 200
2/03
– 2
007/
08C
ompa
nies
R m
illio
nPr
ovis
iona
l tax
Ass
essm
ent
paym
ents
Roy
altie
sR
efun
ds1
Tota
l
2002
/03
56 5
73.8
2
921.
6
20
9.6
-3
960
.055
745
.1
2003
/04
60 6
73.0
3
040.
6
99
.5
-2 9
32.2
60 8
80.8
2004
/05
70 5
71.8
4
007.
4
14
5.4
-3
942
.770
781
.9
2005
/06
87 9
49.6
4
487.
9
12
3.7
-6
400
.486
160
.8
2006
/07
118
205.
1
7
084.
2
51
3.5
-6
804
.211
8 99
8.6
2007
/08
139
281.
0
7
595.
9
20
3.8
-6
960
.814
0 11
9.8
Perc
enta
ge o
f tot
al20
02/0
310
1.5%
5.2%
0.4%
-7.1
%10
0.0%
2003
/04
99.7
%5.
0%0.
2%-4
.8%
100.
0%
2004
/05
99.7
%5.
7%0.
2%-5
.6%
100.
0%
2005
/06
102.
1%5.
2%0.
1%-7
.4%
100.
0%
2006
/07
99.3
%6.
0%0.
4%-5
.7%
100.
0%
2007
/08
99.4
%5.
4%0.
1%-5
.0%
100.
0%
Perc
enta
ge y
ear-
on-y
ear g
row
th20
03/0
47.
2%4.
1%-5
2.5%
-26.
0%9.
2%
2004
/05
16.3
%31
.8%
46.1
%34
.5%
16.3
%
2005
/06
24.6
%12
.0%
-14.
9%62
.3%
21.7
%
2006
/07
34.4
%57
.9%
315.
2%6.
3%38
.1%
2007
/08
17.8
%7.
2%-6
0.3%
2.3%
17.7
%1.
Inc
lude
s ta
x cr
edit
certi
ficat
es.
CHAPTER 1: OVERVIEW OF REVENUE COLLECTIONS
23
Tabl
e 1.
7.1:
Tax
es o
n pr
oper
ty, 1
994/
95 –
200
7/08
Taxe
s on
pro
pert
y
R m
illio
nD
onat
ions
tax
Esta
te d
uty
Unc
ertif
icat
ed
secu
ritie
s ta
x1Tr
ansf
er d
utie
sTo
tal
1994
/95
104.
4
125.
3
431.
4
1 41
3.5
2 07
4.7
1995
/96
61.0
18
1.3
46
2.9
1
528.
7
2
233.
9
1996
/97
46.7
18
1.8
39
7.3
1
733.
5
2
359.
3
1997
/98
17.7
30
2.6
44
2.3
1
855.
8
2
618.
4
1998
/99
9.1
256.
4
721.
1
1 84
3.9
2 83
0.5
1999
/00
15.2
30
4.2
1
090.
4
2
398.
6
3
808.
4
2000
/01
32.1
44
2.7
1
102.
1
2
401.
9
3
978.
8
2001
/02
20.6
48
1.9
1
212.
8
2
913.
0
4
628.
3
2002
/03
17.7
43
2.7
1
205.
2
3
429.
0
5
084.
6
2003
/04
17.1
41
7.1
1
101.
1
5
172.
1
6
707.
5
2004
/05
25.2
50
6.9
1
365.
9
7
114.
6
9
012.
6
2005
/06
29.5
62
4.7
1
973.
4
8
510.
0
11
137
.5
2006
/07
47.0
74
7.4
2
763.
9
6
774.
0
10
332
.3
2007
/08
27.6
69
1.0
3
757.
1
7
408.
2
11
883
.9
1. M
arke
tabl
e se
curit
ies
tax
prio
r to
2006
/07.
2008 TAX STATISTICS
24
Tabl
e 1.
8.1:
Dom
estic
taxe
s on
goo
ds a
nd s
ervi
ces,
199
4/95
– 2
007/
08D
omes
tic ta
xes
on g
oods
and
ser
vice
s
R m
illio
nVa
lue
adde
d ta
xSp
ecifi
c ex
cise
du
ties
Ad
valo
rem
ex
cise
dut
ies
Levi
es o
n fu
elA
ir de
part
ure
tax
Oth
er1
Tota
l
1994
/95
29 2
88.4
5
431.
3
37
2.9
8
351.
5
–
62
6.1
44
070
.3
1995
/96
32 7
68.2
6
075.
0
40
0.2
8
928.
0
–
71
0.2
48
881
.7
1996
/97
35 9
02.9
5
912.
4
71
8.7
10
391
.6
–
647.
2
53 5
72.9
1997
/98
40 0
95.6
7
425.
8
58
1.6
12
091
.2
–
424.
8
60 6
19.0
1998
/99
43 9
85.4
8
052.
8
51
8.9
13
640
.0
–
73.7
66
270
.8
1999
/00
48 3
76.8
8
886.
1
58
4.3
14
289
.8
–
167.
7
72 3
04.7
2000
/01
54 4
55.2
9
126.
6
69
3.9
14
495
.3
85.8
23
5.8
79
092
.5
2001
/02
61 0
56.6
9
797.
2
77
6.1
14
923
.2
296.
4
38.8
86
888
.4
2002
/03
70 1
49.9
10
422
.6
1 05
0.2
15 3
33.8
32
4.8
30
0.7
97
581
.9
2003
/04
80 6
81.8
11
364
.6
1 01
6.2
16 6
52.4
36
7.2
91
.5
110
173.
5
2004
/05
98 1
57.9
13
066
.7
1 01
5.2
19 1
90.4
41
2.2
14
0.5
13
1 98
2.8
2005
/06
114
351.
6
14
546
.5
1 15
7.3
20 5
06.7
45
8.2
34
1.7
15
1 36
1.9
2006
/07
134
462.
6
16
369
.4
1 28
2.7
21 8
44.6
48
4.8
19
3.7
17
4 63
7.9
2007
/08
150
442.
8
18
218
.4
1 48
0.5
23 7
40.5
54
0.6
32
3.4
19
4 74
6.3
1. I
nclu
des
levy
on
plas
tic b
ags,
min
ing
leas
es a
nd o
wne
rshi
p, a
nd U
nive
rsal
Ser
vice
Fun
d.
CHAPTER 1: OVERVIEW OF REVENUE COLLECTIONS
25

Tabl
e 1.
8.2:
Val
ue-a
dded
tax
(VA
T), 2
002/
03 –
200
7/08
VAT
R m
illio
nD
omes
ticC
usto
ms
Gro
ssR
efun
dsTo
tal
2002
/03
83 6
75.3
37
745
.8
121
421.
0
-5
1 27
1.2
70 1
49.9
2003
/04
96 4
05.3
36
947
.5
133
352.
7
-5
2 67
1.0
80 6
81.8
2004
/05
110
166.
8
43
465
.7
153
632.
5
-5
5 47
4.7
98 1
57.9
2005
/06
125
756.
3
50
261
.1
176
017.
4
-6
1 66
5.8
114
351.
6
2006
/07
144
884.
0
66
917
.0
211
801.
0
-7
7 33
8.4
134
462.
6
2007
/08
171
618.
8
77
929
.2
249
548.
0
-9
9 10
5.1
150
442.
8
Perc
enta
ge o
f tot
al20
02/0
368
.9%
31.1
%10
0.0%
-42.
2%57
.8%
2003
/04
72.3
%27
.7%
100.
0%-3
9.5%
60.5
%
2004
/05
71.7
%28
.3%
100.
0%-3
6.1%
63.9
%
2005
/06
71.4
%28
.6%
100.
0%-3
5.0%
65.0
%
2006
/07
68.4
%31
.6%
100.
0%-3
6.5%
63.5
%
2007
/08
68.8
%31
.2%
100.
0%-3
9.7%
60.3
%
Perc
enta
ge y
ear-
on-y
ear g
row
th20
03/0
415
.2%
-2.1
%9.
8%2.
7%15
.0%
2004
/05
14.3
%17
.6%
15.2
%5.
3%21
.7%
2005
/06
14.2
%15
.6%
14.6
%11
.2%
16.5
%
2006
/07
15.2
%33
.1%
20.3
%25
.4%
17.6
%
2007
/08
18.5
%16
.5%
17.8
%28
.1%
11.9
%
2008 TAX STATISTICS
26
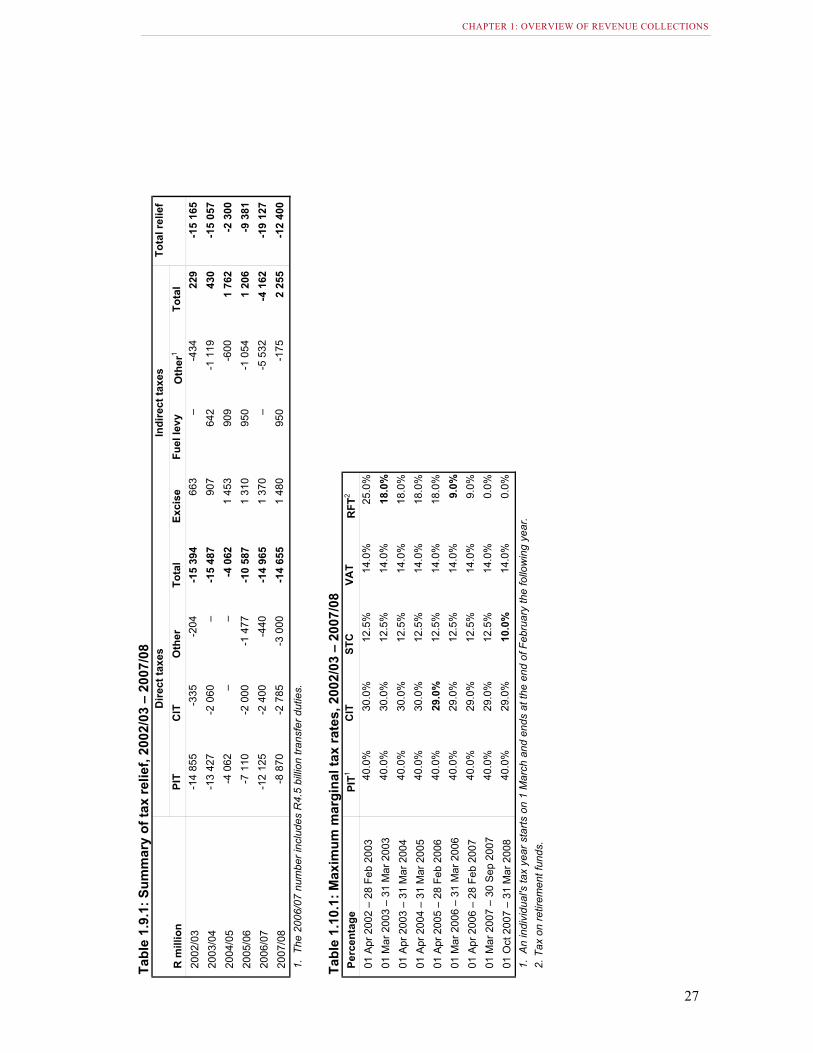
Tabl
e 1.
9.1:
Sum
mar
y of
tax
relie
f, 20
02/0
3 –
2007
/08
Dire
ct ta
xes
Indi
rect
taxe
s
R m
illio
nPI
TC
ITO
ther
Tota
lEx
cise
Fuel
levy
Oth
er1
Tota
l20
02/0
3 -1
4 85
5 -3
35 -2
04 -1
5 39
466
3
–
-4
3422
9
-15
165
2003
/04
-13
427
-2 0
60–
-15
487
907
64
2
-1 1
1943
0
-15
057
2004
/05
-4 0
62–
–
-4
062
1 45
3
90
9
-600
1 76
2
-2
300
2005
/06
-7 1
10 -2
000
-1 4
77 -1
0 58
71
310
950
-1
054
1 20
6
-9
381
2006
/07
-12
125
-2 4
00 -4
40 -1
4 96
51
370
–
-5
532
-4 1
62 -1
9 12
7
2007
/08
-8 8
70 -2
785
-3 0
00 -1
4 65
51
480
950
-1
752
255
-12
400
1. T
he 2
006/
07 n
umbe
r inc
lude
s R
4.5
billi
on tr
ansf
er d
utie
s.
Tabl
e 1.
10.1
: Max
imum
mar
gina
l tax
rate
s, 2
002/
03 –
200
7/08
Perc
enta
gePI
T1C
ITST
CVA
TR
FT2
01 A
pr 2
002
– 28
Feb
200
340
.0%
30.0
%12
.5%
14.0
%25
.0%
01 M
ar 2
003
– 31
Mar
200
340
.0%
30.0
%12
.5%
14.0
%18
.0%
01 A
pr 2
003
– 31
Mar
200
440
.0%
30.0
%12
.5%
14.0
%18
.0%
01 A
pr 2
004
– 31
Mar
200
540
.0%
30.0
%12
.5%
14.0
%18
.0%
01 A
pr 2
005
– 28
Feb
200
640
.0%
29.0
%12
.5%
14.0
%18
.0%
01 M
ar 2
006
– 31
Mar
200
640
.0%
29.0
%12
.5%
14.0
%9.
0%
01 A
pr 2
006
– 28
Feb
200
740
.0%
29.0
%12
.5%
14.0
%9.
0%
01 M
ar 2
007
– 30
Sep
200
740
.0%
29.0
%12
.5%
14.0
%0.
0%
01 O
ct 2
007
– 31
Mar
200
840
.0%
29.0
%10
.0%
14.0
%0.
0%
1. A
n in
divi
dual
's ta
x ye
ar s
tarts
on
1 M
arch
and
end
s at
the
end
of F
ebru
ary
the
follo
win
g ye
ar.
2. T
ax o
n re
tirem
ent f
unds
.
Tota
l rel
ief
CHAPTER 1: OVERVIEW OF REVENUE COLLECTIONS
27
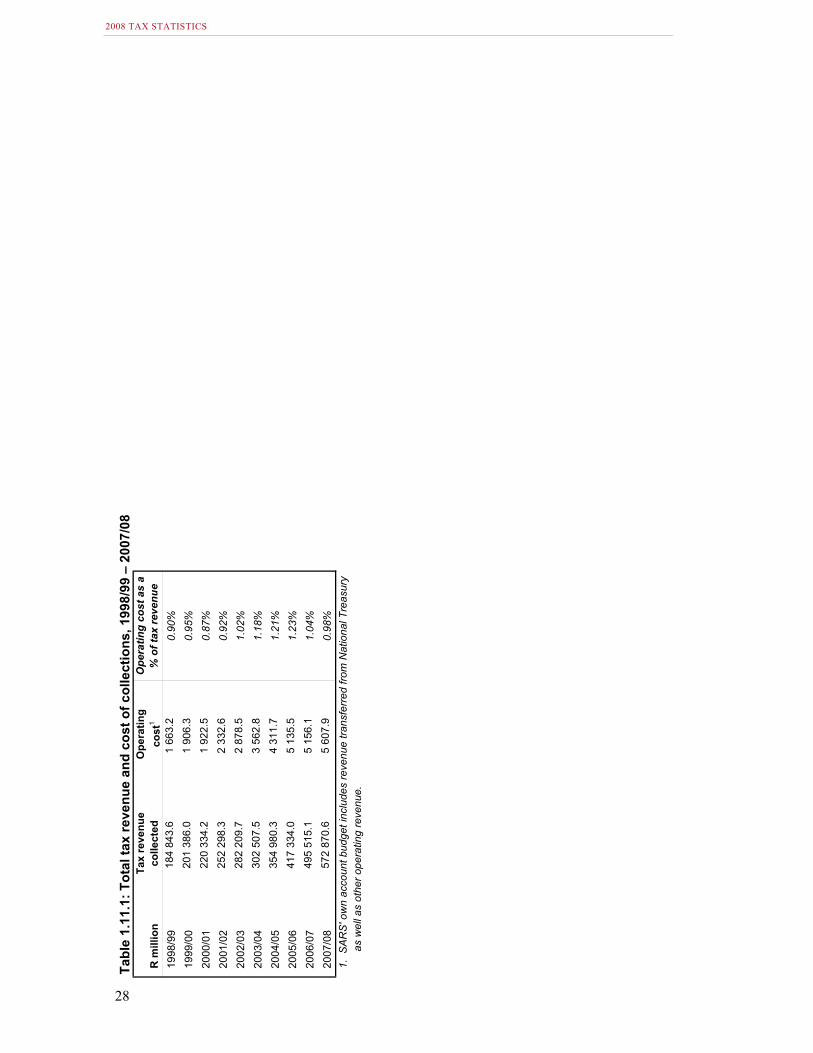
Tabl
e 1.
11.1
: Tot
al ta
x re
venu
e an
d co
st o
f col
lect
ions
, 199
8/99
– 2
007/
08
R m
illio
nTa
x re
venu
e co
llect
edO
pera
ting
cost
1O
pera
ting
cost
as
a %
of t
ax re
venu
e19
98/9
918
4 84
3.6
1 66
3.2
0.90
%19
99/0
020
1 38
6.0
1 90
6.3
0.95
%20
00/0
122
0 33
4.2
1 92
2.5
0.87
%20
01/0
225
2 29
8.3
2 33
2.6
0.92
%20
02/0
328
2 20
9.7
2 87
8.5
1.02
%20
03/0
430
2 50
7.5
3 56
2.8
1.18
%20
04/0
535
4 98
0.3
4 31
1.7
1.21
%20
05/0
641
7 33
4.0
5 13
5.5
1.23
%20
06/0
749
5 51
5.1
5 15
6.1
1.04
%20
07/0
857
2 87
0.6
5 60
7.9
0.98
%1.
SA
RS
' ow
n ac
coun
t bud
get i
nclu
des
reve
nue
trans
ferr
ed fr
om N
atio
nal T
reas
ury
as
wel
l as
othe
r ope
ratin
g re
venu
e.
2008 TAX STATISTICS
28