Embed Size (px)
Citation preview
1
“What do they know of England who only England know?” Rudyard Kipling’s fa-mous remark is as suitable for Ukraine, as it is for every other country on the globe: Without knowledge of the external world you don’t know your own country. Com-paring the progress of nations is a useful thing, if you want to know where your na-tion stands. And without this knowledge, how can you judge the progress or regress of the country?
Comparing the development of Ukraine with that of its neighbours, as well as its ,,reference group” of EU-countries like Poland, countries in transition, or even highly developed Western states shows where Ukraine stands. Especially in its 20th year of independence, Ukraine needs to know the experience of others who have success-fully mastered the thorny path of transition.
Ukraine in the World 2011 with its international statistics thus comes at the right time. Be it politics, economy, energy, demographics, or the military – the reader can easily compare and (re)think the achievements of the Ukrainian society, economy and the state. Readable descriptions of indexes help to understand what each table or graph is about: From GDP per capita to the number of dealers of luxury cars inter-esting statistics are all around in this booklet. As this is already the second edition of Ukraine in the World the reader can also compare the development of Ukraine vis-à-vis the previous year(s).
And he can critically judge: One’s own actions as a citizen, politician, business-man, clerk or worker as well as the behavior of political and economic leaders.
As knowing is always the best guideline for acting, the reader may choose to act to bring Ukraine forward in its efforts at a successful transition to democracy, the rule of law, market economy and, last but not least, European integration.
I wish you an inspiring and critical reading!
Nico LangeDirector of the Konrad Adenauer Stiftung Ukraine
Kiev, march 2011
INTRODUCTION
2 3
year
year 2009 2010
16 447 259 16 543 219 14 119 050 14 624 184 4 984 730 5 745 133 5 068 890 5 390 897 3 338 680 3 305 898 2 178 860 2 258 565 1 231 890 1 476 912 1 236 940 1 430 020 430 736 438 884 287 219 354 414 310 057 351 015 161 521 158 393 117404 136561 129 540 132 276 88 210 86 262 48 975 52 887 47 101 44 843 10 745 11 234 5 403 5 357
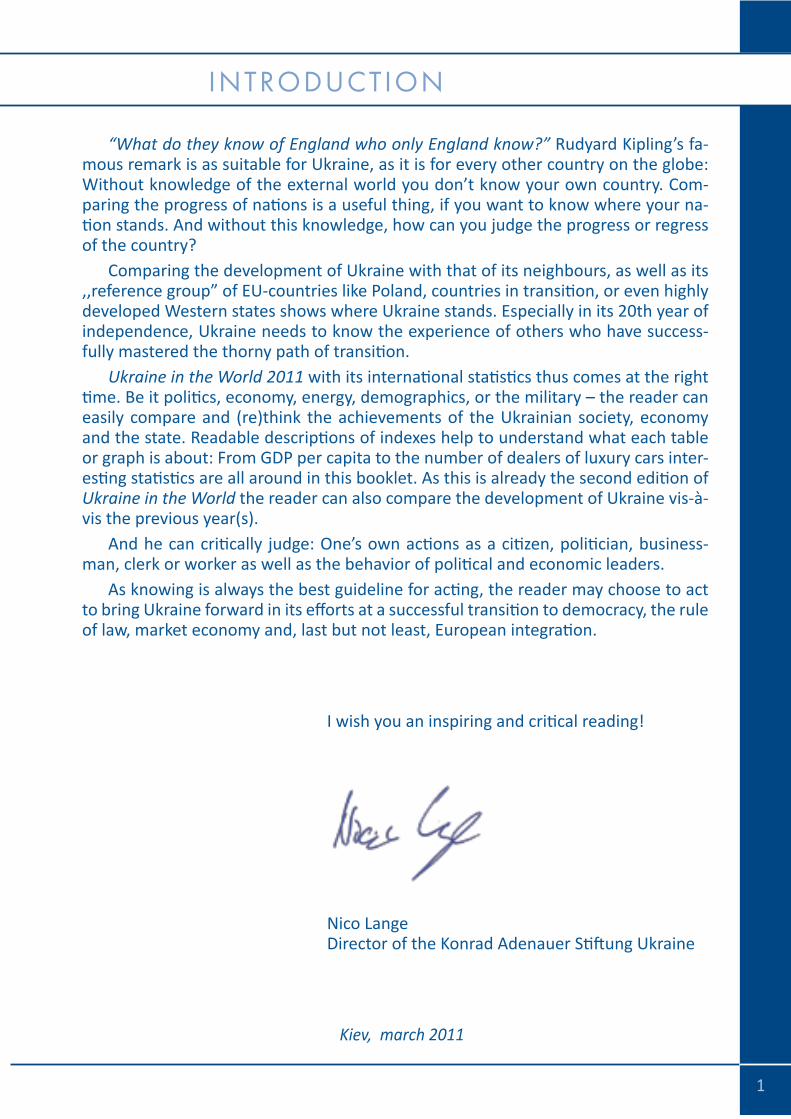
The gross domestic product (GDP) is a basic measure of a country’s overall eco-nomic output. It is the market value of all final goods and services made within the borders of a country in a year. It is often pos-itively related to the standard of living.
GROss DOmesTIC pRODUCT
Gross domestic product, current prices (billions of U.S.-Dollars)
COUnTRy
European UnionUSA
ChinaJapan
GermanyUnited Kingdom
RussiaIndia
PolandSouth Africa
ArgentinaRomaniaUkraine
HungarySlovak Republic
BelarusBulgariaGeorgia
Moldova
�
�
�
�
�
�
�
�
�
�
�
�
�
�
�
�
�
�
�
The gross domestic product per capita (GDP per capita) indica-tor gives us understanding of the share of each person in goods and services produced in the country during a year. Per capita income is often used as a measure of wealth of population of the country, particularly for comparison of countries with each other.
GROss DOmesTIC pRODUCT peR CapITa
Gross domestic product per capita, current prices, (thousands of U.S. Dollars)
COUnTRy
USA
Japan
Germany
United Kingdom
Slovak Republic
Hungary
Poland
Russia
Argentina
Romania
South Africa
Bulgaria
Belarus
China
Ukraine
Georgia
Moldova
India
Source: IMF, 2010, 2011 Source: IMF, 2010, 2011
2009 2010
45934 47132
39740 42325
40831 40512
35257 36298
16281 15906
12914 13210
11302 11521
8681 10521
7725 8663
7523 7390
5823 7101
6223 5955
5166 5607
3734 4283
2568 3002
2450 2559
1514 1503
1031 1176
�
�
�
�
�
�
�
�
�
�
�
�
�
�
�
�
�
�
4 5
year
year
Rank
1
2
3
4
5
6
7
8
22
24
26
35
42
54
62
60
119
146
165
Rank
1
2
10
33
32
37
38
55
63
71
73
80
93
90
101
105
133
124
142
167
172
Rank
1
2
3
4
5
6
7
9
21
24
26
40
49
55
60
62
122
147
168
Rank
1
2
11
32
36
39
42
57
64
65
72
75
88
97
101
106
128
134
153
164
179
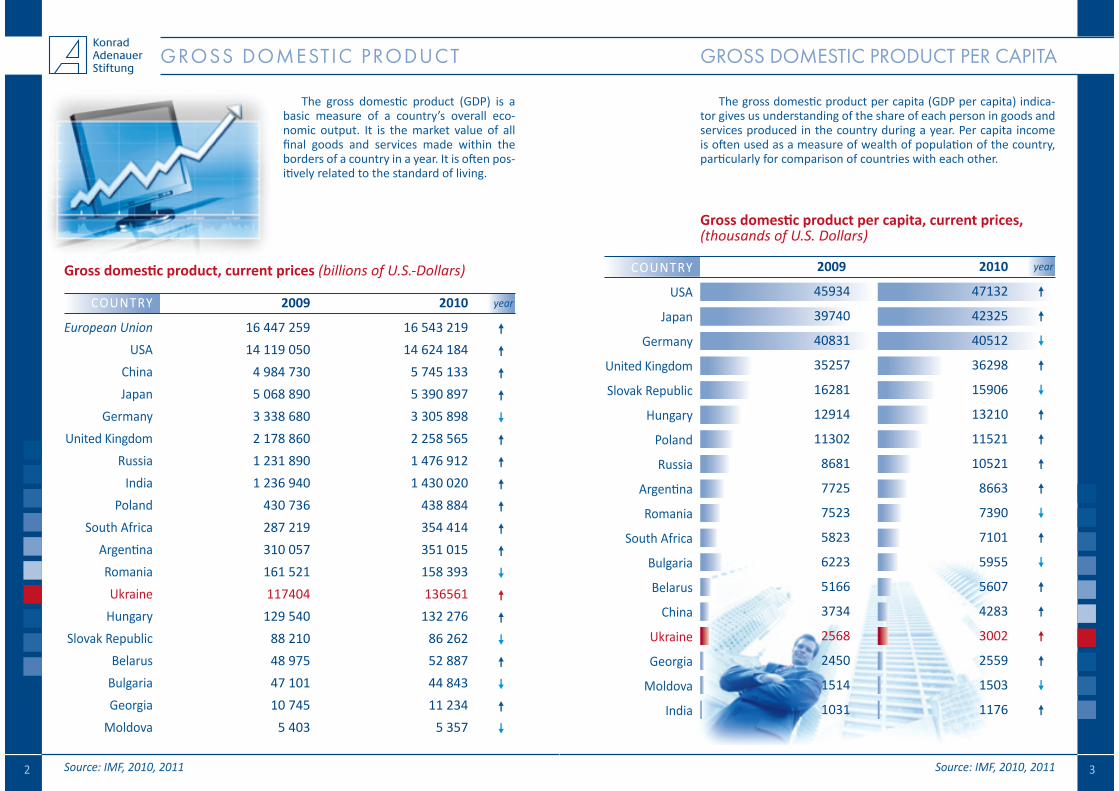
The gross domestic product (GDP) on purchasing power par-ity (PPP) basis is more useful when comparing differences in living standards on the whole between nations because PPP takes into account the relative cost of living and the inflation rates of differ-ent countries, rather than just a nominal gross domestic product (GDP) comparison.
GDp aT pURChasING pOweR paRITy (ppp)
GDP at purchasing power parity PPP exchange rates, (thousands of U.S. Dollars)
COUnTRy
European Union
USA
China
Japan
India
Germany
Russia
United Kingdom
Poland
Argentina
South Africa
Ukraine
Romania
Hungary
Belarus
Slovak Republic
Georgia
Moldova
Liechtenstein
COUnTRy
Qatar
Liechtenstein
USA
Germany
United Kingdom
Japan
European Union
Slovak Republic
Hungary
Poland
Russia
Argentina
Belarus
Romania
World
South Africa
China
Ukraine
Georgia
India
Moldova
The gross domestic product (GDP) on purchasing power parity (PPP) basis per capita is more useful when comparing differences in living standards on the whole between nations because PPP takes into account the relative cost of living and the inflation rates of dif-ferent countries, rather than just a nominal gross domestic product (GDP) comparison.
GDp ON pURChasING pOweR paRITy basIs peR CapITa
GDP on purchasing power parity basis per capita, (thousands of U.S. Dollars)
Source: CIA Factbook, 2010, estimated for 2010 if not stated otherwise
2009
14 940 000
14 440 000
7 992 000
4 340 000
3 304 000
2 925 000
2 271 000
2 236 000
670 700
575 200
492 200
338 600
272 000
196 700
114 300
119 800
21 560
10 800
4 160
2009
121000
118000
47500
35500
36700
34100
33700
22000
19800
17400
16100
14200
11800
12200
10500
10100
6000
7400
4700
2900
2500
2010
14 890 000
14 720 000
9 854 000
4 338 000
4 046 000
2 951 000
2 229 000
2 189 000
721 700
621 700
527 500
306 300
253 300
190 000
128 400
121 300
22 070
10 600
4 160
2010
145300
122100
47400
35900
35100
34200
32900
22200
19000
18800
15900
15000
13400
11500
11100
10700
7400
6700
4800
3400
2500
�
�
�
�
�
�
�
�
�
�
�
�
�
�
�
�
�
�
�
�
�
�
�
�
�
�
�
�
�
�
�
�
�
�
�
�
�
�
�
�
Source: CIA Factbook, 2010, data for 2010 estimated
6 7
yearyear
GDp GROwTh RaTe
GDP growth rate
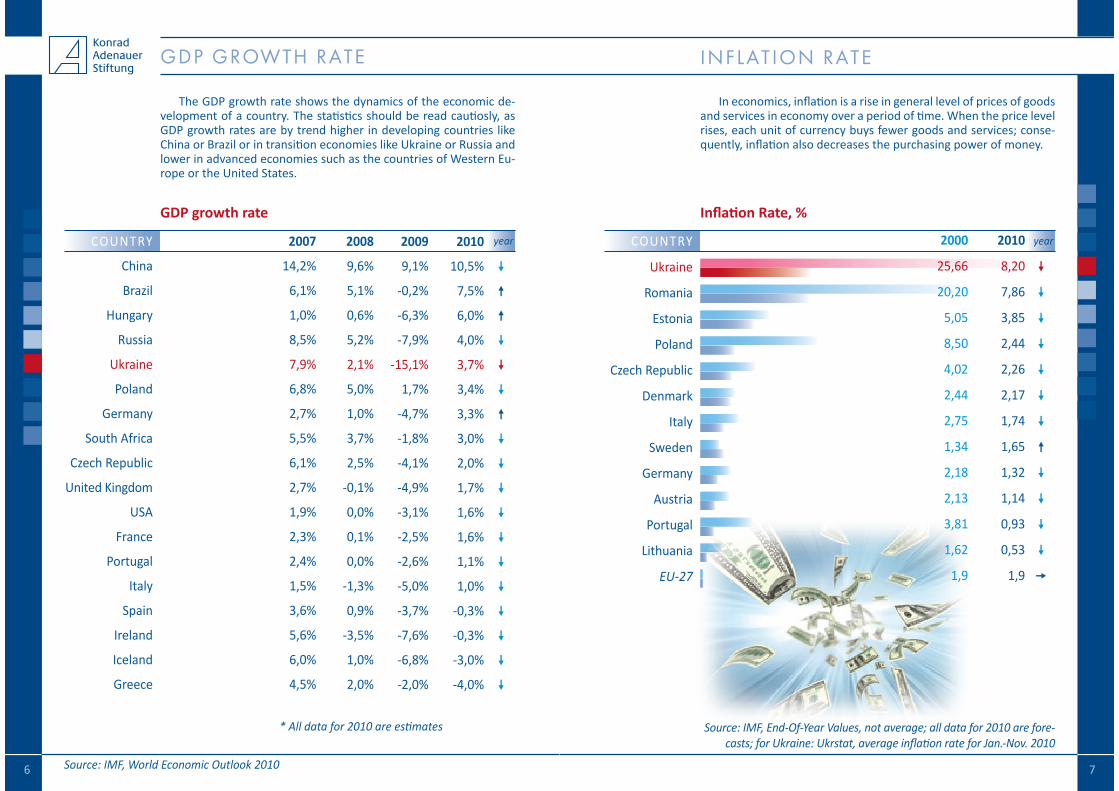
The GDP growth rate shows the dynamics of the economic de-velopment of a country. The statistics should be read cautiosly, as GDP growth rates are by trend higher in developing countries like China or Brazil or in transition economies like Ukraine or Russia and lower in advanced economies such as the countries of Western Eu-rope or the United States.
Source: IMF, World Economic Outlook 2010
2010
10,5%
7,5%
6,0%
4,0%
3,7%
3,4%
3,3%
3,0%
2,0%
1,7%
1,6%
1,6%
1,1%
1,0%
-0,3%
-0,3%
-3,0%
-4,0%
2009
9,1%
-0,2%
-6,3%
-7,9%
-15,1%
1,7%
-4,7%
-1,8%
-4,1%
-4,9%
-3,1%
-2,5%
-2,6%
-5,0%
-3,7%
-7,6%
-6,8%
-2,0%
2008
9,6%
5,1%
0,6%
5,2%
2,1%
5,0%
1,0%
3,7%
2,5%
-0,1%
0,0%
0,1%
0,0%
-1,3%
0,9%
-3,5%
1,0%
2,0%
2007
14,2%
6,1%
1,0%
8,5%
7,9%
6,8%
2,7%
5,5%
6,1%
2,7%
1,9%
2,3%
2,4%
1,5%
3,6%
5,6%
6,0%
4,5%
COUnTRy
China
Brazil
Hungary
Russia
Ukraine
Poland
Germany
South Africa
Czech Republic
United Kingdom
USA
France
Portugal
Italy
Spain
Ireland
Iceland
Greece
COUnTRy
Ukraine
Romania
Estonia
Poland
Czech Republic
Denmark
Italy
Sweden
Germany
Austria
Portugal
Lithuania
EU-27
* All data for 2010 are estimates
In economics, inflation is a rise in general level of prices of goods and services in economy over a period of time. When the price level rises, each unit of currency buys fewer goods and services; conse-quently, inflation also decreases the purchasing power of money.
INflaTION RaTe
Source: IMF, End-Of-Year Values, not average; all data for 2010 are fore-casts; for Ukraine: Ukrstat, average inflation rate for Jan.-Nov. 2010
Inflation Rate, %
�
�
�
�
�
�
�
�
�
�
�
�
�
�
�
�
�
�
2010
8,20
7,86
3,85
2,44
2,26
2,17
1,74
1,65
1,32
1,14
0,93
0,53
1,9
2000
25,66
20,20
5,05
8,50
4,02
2,44
2,75
1,34
2,18
2,13
3,81
1,62
1,9
�
�
�
�
�
�
�
�
�
�
�
�
�
8 9
year
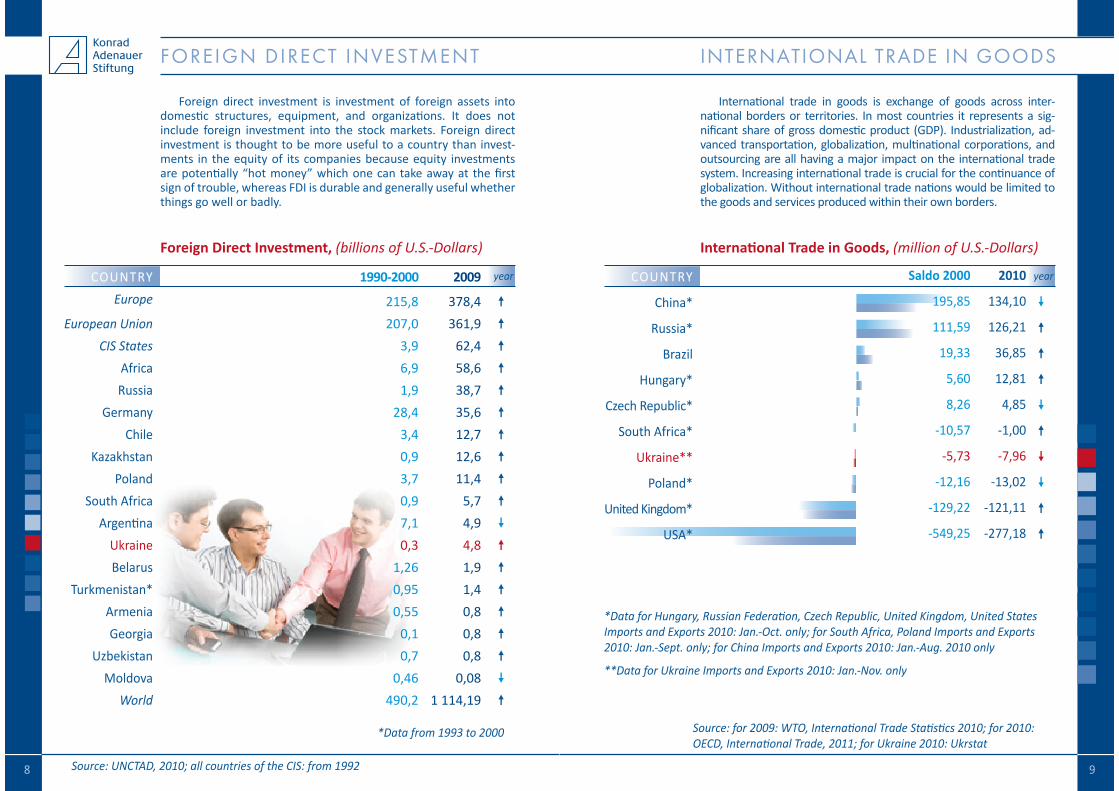
Foreign direct investment is investment of foreign assets into domestic structures, equipment, and organizations. It does not include foreign investment into the stock markets. Foreign direct investment is thought to be more useful to a country than invest-ments in the equity of its companies because equity investments are potentially “hot money” which one can take away at the first sign of trouble, whereas FDI is durable and generally useful whether things go well or badly.
fOReIGN DIReCT INvesTmeNT
Foreign Direct Investment, (billions of U.S.-Dollars)
COUnTRyEurope
European UnionCIS States
AfricaRussia
GermanyChile
KazakhstanPoland
South AfricaArgentina
UkraineBelarus
Turkmenistan*ArmeniaGeorgia
UzbekistanMoldova
World
1990-2000 2009
215,8 378,4 207,0 361,9 3,9 62,4 6,9 58,6 1,9 38,7 28,4 35,6 3,4 12,7 0,9 12,6 3,7 11,4 0,9 5,7 7,1 4,9 0,3 4,8 1,26 1,9 0,95 1,4 0,55 0,8 0,1 0,8 0,7 0,8 0,46 0,08 490,2 1 114,19
Source: UNCTAD, 2010; all countries of the CIS: from 1992
*Data from 1993 to 2000
�
�
�
�
�
�
�
�
�
�
�
�
�
�
�
�
�
�
�
International trade in goods is exchange of goods across inter-national borders or territories. In most countries it represents a sig-nificant share of gross domestic product (GDP). Industrialization, ad-vanced transportation, globalization, multinational corporations, and outsourcing are all having a major impact on the international trade system. Increasing international trade is crucial for the continuance of globalization. Without international trade nations would be limited to the goods and services produced within their own borders.
INTeRNaTIONal TRaDe IN GOODs
Source: for 2009: WTO, International Trade Statistics 2010; for 2010: OECD, International Trade, 2011; for Ukraine 2010: Ukrstat
International Trade in Goods, (million of U.S.-Dollars)
*Data for Hungary, Russian Federation, Czech Republic, United Kingdom, United States Imports and Exports 2010: Jan.-Oct. only; for South Africa, Poland Imports and Exports 2010: Jan.-Sept. only; for China Imports and Exports 2010: Jan.-Aug. 2010 only
**Data for Ukraine Imports and Exports 2010: Jan.-Nov. only
year 2010
134,10
126,21
36,85
12,81
4,85
-1,00
-7,96
-13,02
-121,11
-277,18
Saldo 2000
195,85
111,59
19,33
5,60
8,26
-10,57
-5,73
-12,16
-129,22
-549,25
COUnTRy
China*
Russia*
Brazil
Hungary*
Czech Republic*
South Africa*
Ukraine**
Poland*
United Kingdom*
USA*
�
�
�
�
�
�
�
�
�
�
10 11
COUnTRy 2007 2008 2009 2010Brazil 180,300 193,800 238,500 290,900USA 70,570 77,650 130,800 no dataChina 1,534,000 1,955,000 2,426,000 2,622,000Hungary 24,050 33,870 44,180 45,730Poland 65,750 62,180 79,580 99,760South Africa 32,940 34,070 39,680 45,520Czech Republic 34,590 36,680 41,200 38,670United Kingdom 57,300 52,980 66,720 no dataGermany 136,200 138,000 180,800 no dataFrance 115,700 102,900 133,100 no dataGreece 3,658 3,473 5,546 no dataPortugal 11,550 11,950 16,030 no dataSpain 19,050 20,250 28,200 no dataItaly 94,330 105,300 132,800 no dataIreland** 0,926* 1,023 2,154 no dataIceland 2,436 2,500 3,883 4,206Russia 476,400 427,100 439,400 483,100**
Ukraine 32,480 31,540 26,510 32,910
ReseRves Of fOReIGN CURReNCy
Reserves of foreign currency and gold, (thousands of U.S.-Dollars)
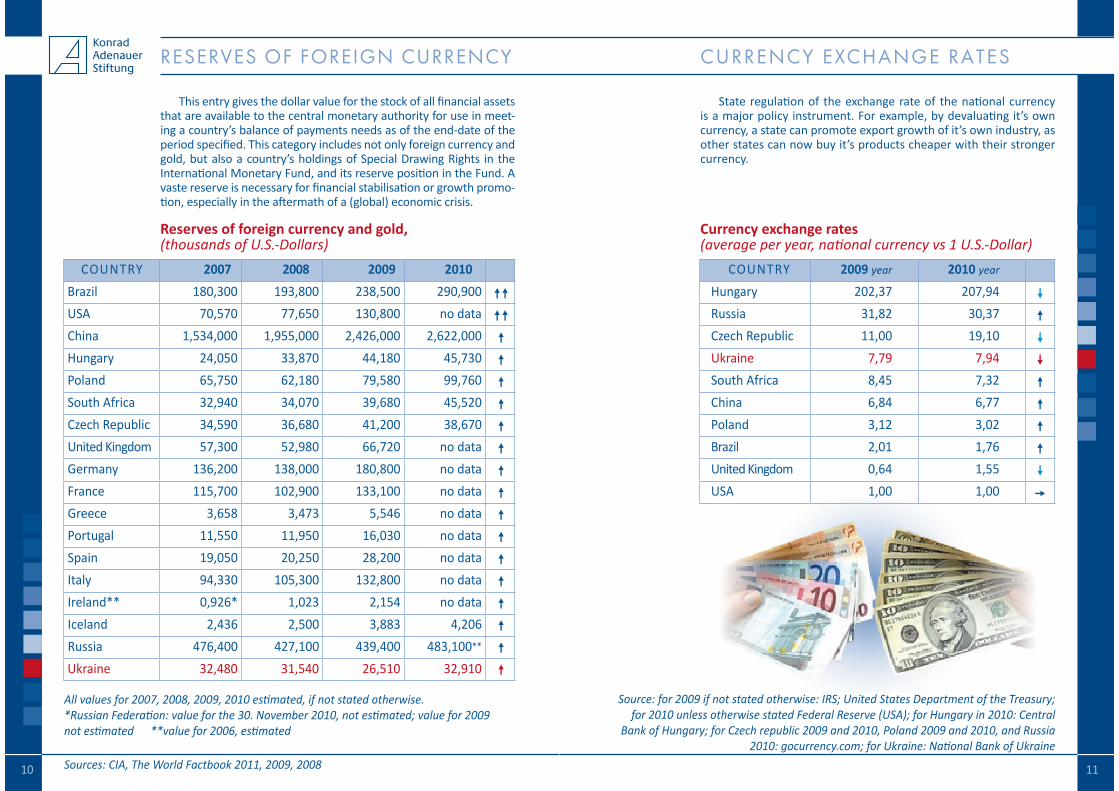
This entry gives the dollar value for the stock of all financial assets that are available to the central monetary authority for use in meet-ing a country’s balance of payments needs as of the end-date of the period specified. This category includes not only foreign currency and gold, but also a country’s holdings of Special Drawing Rights in the International Monetary Fund, and its reserve position in the Fund. A vaste reserve is necessary for financial stabilisation or growth promo-tion, especially in the aftermath of a (global) economic crisis.
Sources: CIA, The World Factbook 2011, 2009, 2008
��
��
�
�
�
�
�
�
�
�
�
�
�
�
�
�
�
�
All values for 2007, 2008, 2009, 2010 estimated, if not stated otherwise.*Russian Federation: value for the 30. November 2010, not estimated; value for 2009 not estimated **value for 2006, estimated
CURReNCy exChaNGe RaTes
Currency exchange rates (average per year, national currency vs 1 U.S.-Dollar)
State regulation of the exchange rate of the national currency is a major policy instrument. For example, by devaluating it’s own currency, a state can promote export growth of it’s own industry, as other states can now buy it’s products cheaper with their stronger currency.
COUnTRy 2009 year 2010 year
Hungary 202,37 207,94Russia 31,82 30,37Czech Republic 11,00 19,10Ukraine 7,79 7,94South Africa 8,45 7,32China 6,84 6,77Poland 3,12 3,02Brazil 2,01 1,76United Kingdom 0,64 1,55USA 1,00 1,00
�
�
�
�
�
�
�
�
�
�
Source: for 2009 if not stated otherwise: IRS; United States Department of the Treasury; for 2010 unless otherwise stated Federal Reserve (USA); for Hungary in 2010: Central
Bank of Hungary; for Czech republic 2009 and 2010, Poland 2009 and 2010, and Russia 2010: gocurrency.com; for Ukraine: National Bank of Ukraine
12 13
year
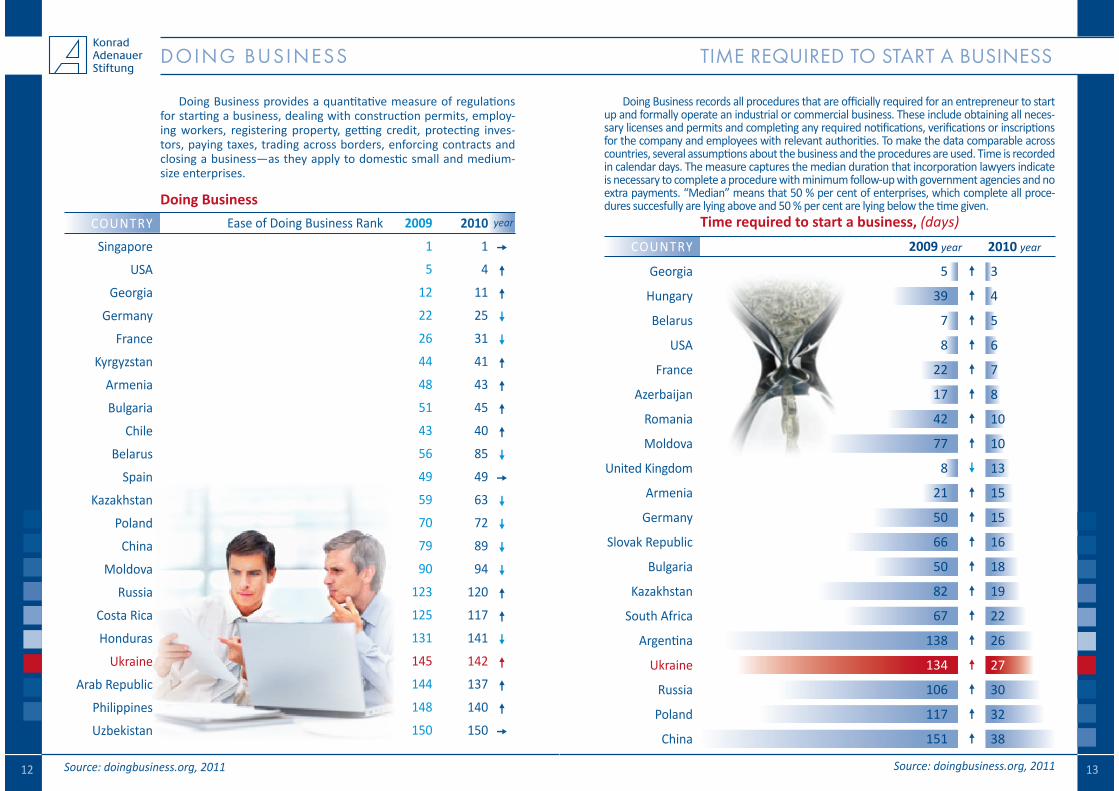
Doing Business provides a quantitative measure of regulations for starting a business, dealing with construction permits, employ-ing workers, registering property, getting credit, protecting inves-tors, paying taxes, trading across borders, enforcing contracts and closing a business—as they apply to domestic small and medium-size enterprises.
DOING bUsINess
Doing Business
Source: doingbusiness.org, 2011
Doing Business records all procedures that are officially required for an entrepreneur to start up and formally operate an industrial or commercial business. These include obtaining all neces-sary licenses and permits and completing any required notifications, verifications or inscriptions for the company and employees with relevant authorities. To make the data comparable across countries, several assumptions about the business and the procedures are used. Time is recorded in calendar days. The measure captures the median duration that incorporation lawyers indicate is necessary to complete a procedure with minimum follow-up with government agencies and no extra payments. “Median” means that 50 % per cent of enterprises, which complete all proce-dures succesfully are lying above and 50 % per cent are lying below the time given.
TIme ReqUIReD TO sTaRT a bUsINess
Time required to start a business, (days)COUnTRy
Georgia
Hungary
Belarus
USA
France
Azerbaijan
Romania
Moldova
United Kingdom
Armenia
Germany
Slovak Republic
Bulgaria
Kazakhstan
South Africa
Argentina
Ukraine
Russia
Poland
China
Source: doingbusiness.org, 2011
3
4
5
6
7
8
10
10
13
15
15
16
18
19
22
26
27
30
32
38
5
39
7
8
22
17
42
77
8
21
50
66
50
82
67
138
134
106
117
151
2009 year 2010 year
COUnTRy
Singapore
USA
Georgia
Germany
France
Kyrgyzstan
Armenia
Bulgaria
Chile
Belarus
Spain
Kazakhstan
Poland
China
Moldova
Russia
Costa Rica
Honduras
Ukraine
Arab Republic
Philippines
Uzbekistan
�
�
�
�
�
�
�
�
�
�
�
�
�
�
�
�
�
�
�
�
�
�
�
�
�
�
�
�
�
�
�
�
�
�
�
�
�
�
�
�
�
�
2010
1
4
11
25
31
41
43
45
40
85
49
63
72
89
94
120
117
141
142
137
140
150
Ease of Doing Business Rank 2009
1
5
12
22
26
44
48
51
43
56
49
59
70
79
90
123
125
131
145
144
148
150
14 15
year
year
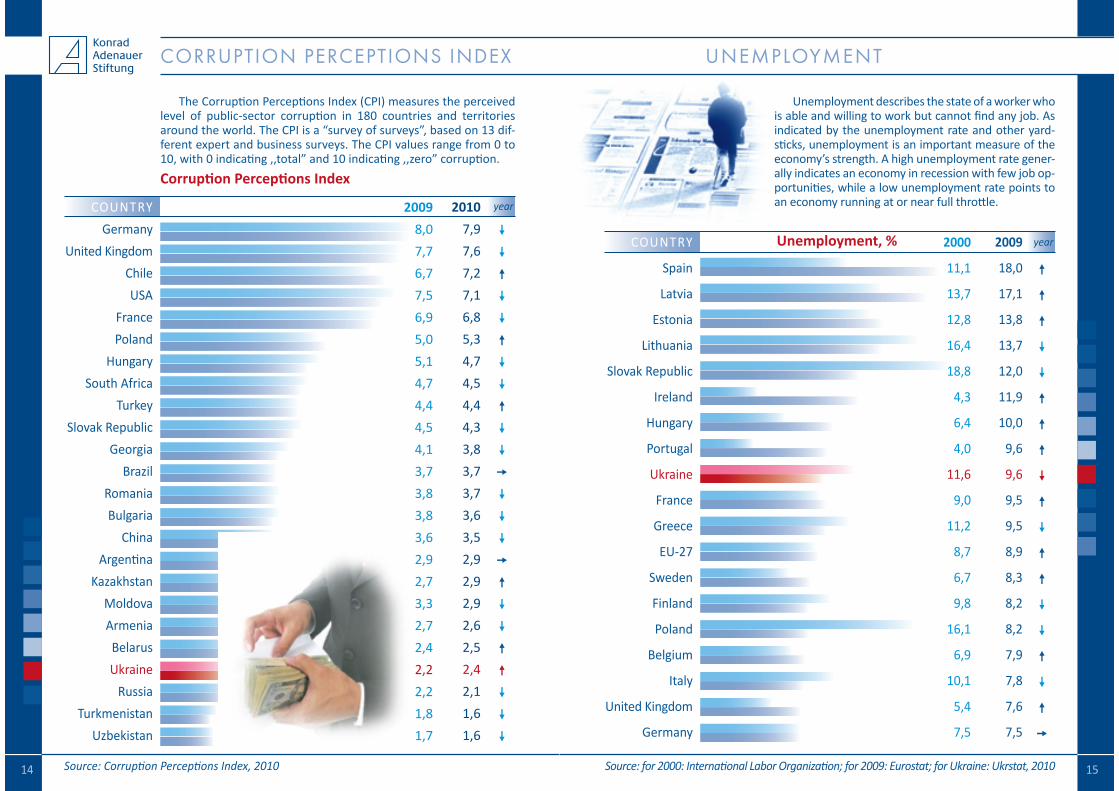
The Corruption Perceptions Index (CPI) measures the perceived level of public-sector corruption in 180 countries and territories around the world. The CPI is a “survey of surveys”, based on 13 dif-ferent expert and business surveys. The CPI values range from 0 to 10, with 0 indicating ,,total” and 10 indicating ,,zero” corruption.
CORRUpTION peRCepTIONs INDex
Corruption Perceptions Index
Source: Corruption Perceptions Index, 2010
COUnTRyGermany
United KingdomChileUSA
FrancePoland
HungarySouth Africa
TurkeySlovak Republic
GeorgiaBrazil
RomaniaBulgaria
ChinaArgentina
KazakhstanMoldovaArmeniaBelarusUkraine
RussiaTurkmenistan
Uzbekistan
20107,97,67,27,16,85,34,74,54,44,33,83,73,73,63,52,92,92,92,62,52,42,11,61,6
2009 8,07,76,77,56,95,05,14,74,44,54,13,73,83,83,62,92,73,32,72,42,22,21,81,7
Unemployment describes the state of a worker who is able and willing to work but cannot find any job. As indicated by the unemployment rate and other yard-sticks, unemployment is an important measure of the economy’s strength. A high unemployment rate gener-ally indicates an economy in recession with few job op-portunities, while a low unemployment rate points to an economy running at or near full throttle.
UNemplOymeNT
Unemployment, % COUnTRy
Spain
Latvia
Estonia
Lithuania
Slovak Republic
Ireland
Hungary
Portugal
Ukraine
France
Greece
EU-27
Sweden
Finland
Poland
Belgium
Italy
United Kingdom
Germany
Source: for 2000: International Labor Organization; for 2009: Eurostat; for Ukraine: Ukrstat, 2010
2000
11,1
13,7
12,8
16,4
18,8
4,3
6,4
4,0
11,6
9,0
11,2
8,7
6,7
9,8
16,1
6,9
10,1
5,4
7,5
2009
18,0
17,1
13,8
13,7
12,0
11,9
10,0
9,6
9,6
9,5
9,5
8,9
8,3
8,2
8,2
7,9
7,8
7,6
7,5
�
�
�
�
�
�
�
�
�
�
�
�
�
�
�
�
�
�
�
�
�
�
�
�
�
�
�
�
�
�
�
�
�
�
�
�
�
�
�
�
�
�
�
16 17
year
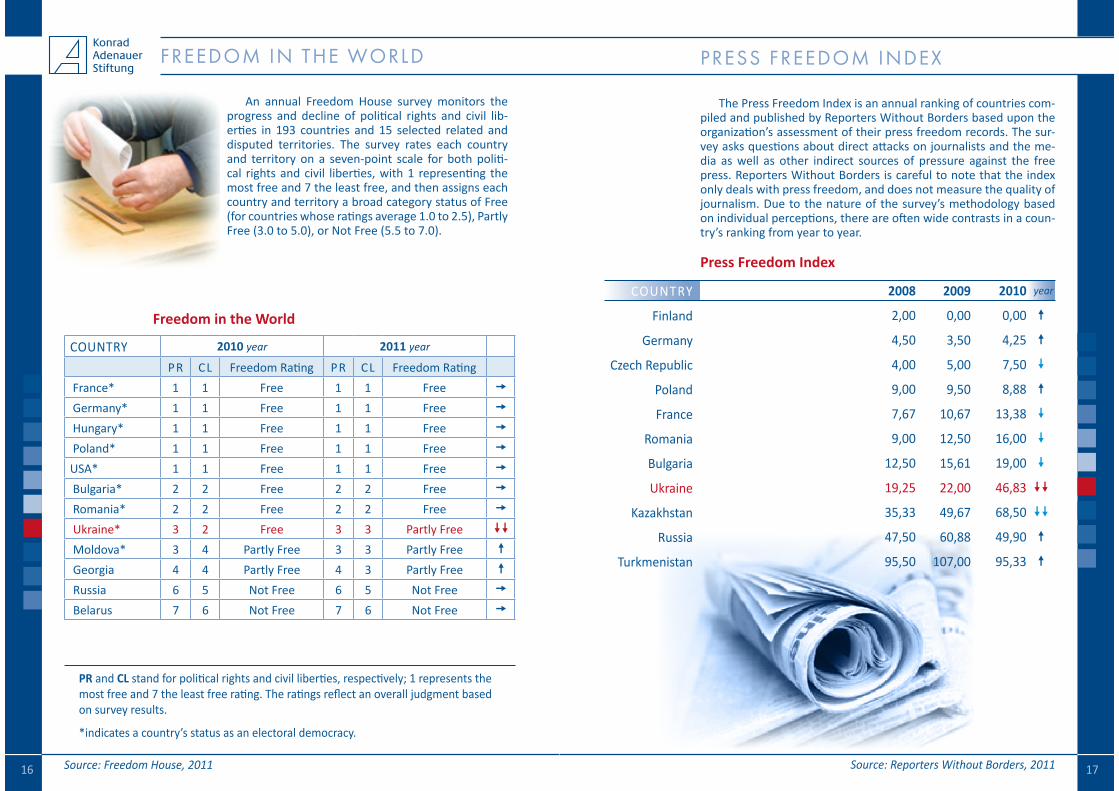
An annual Freedom House survey monitors the progress and decline of political rights and civil lib-erties in 193 countries and 15 selected related and disputed territories. The survey rates each country and territory on a seven-point scale for both politi-cal rights and civil liberties, with 1 representing the most free and 7 the least free, and then assigns each country and territory a broad category status of Free (for countries whose ratings average 1.0 to 2.5), Partly Free (3.0 to 5.0), or Not Free (5.5 to 7.0).
fReeDOm IN The wORlD
Freedom in the World
Source: Freedom House, 2011
PR and CL stand for political rights and civil liberties, respectively; 1 represents the most free and 7 the least free rating. The ratings reflect an overall judgment based on survey results.
*indicates a country’s status as an electoral democracy.
pRess fReeDOm INDex
The Press Freedom Index is an annual ranking of countries com-piled and published by Reporters Without Borders based upon the organization’s assessment of their press freedom records. The sur-vey asks questions about direct attacks on journalists and the me-dia as well as other indirect sources of pressure against the free press. Reporters Without Borders is careful to note that the index only deals with press freedom, and does not measure the quality of journalism. Due to the nature of the survey’s methodology based on individual perceptions, there are often wide contrasts in a coun-try’s ranking from year to year.
Source: Reporters Without Borders, 2011
COUnTRy 2010 year 2011 year
PR CL Freedom Rating PR CL Freedom Rating France* 1 1 Free 1 1 Free Germany* 1 1 Free 1 1 Free Hungary* 1 1 Free 1 1 Free Poland* 1 1 Free 1 1 FreeUSA* 1 1 Free 1 1 Free Bulgaria* 2 2 Free 2 2 Free Romania* 2 2 Free 2 2 Free Ukraine* 3 2 Free 3 3 Partly Free Moldova* 3 4 Partly Free 3 3 Partly Free Georgia 4 4 Partly Free 4 3 Partly Free Russia 6 5 Not Free 6 5 Not Free Belarus 7 6 Not Free 7 6 Not Free
����� �� ���� ��
Press Freedom Index
COUnTRy
Finland
Germany
Czech Republic
Poland
France
Romania
Bulgaria
Ukraine
Kazakhstan
Russia
Turkmenistan
2009
0,00
3,50
5,00
9,50
10,67
12,50
15,61
22,00
49,67
60,88
107,00
2008
2,00
4,50
4,00
9,00
7,67
9,00
12,50
19,25
35,33
47,50
95,50
2010
0,00
4,25
7,50
8,88
13,38
16,00
19,00
46,83
68,50
49,90
95,33
�
�
�
�
�
�
�
��
��
�
�
18 19
year year
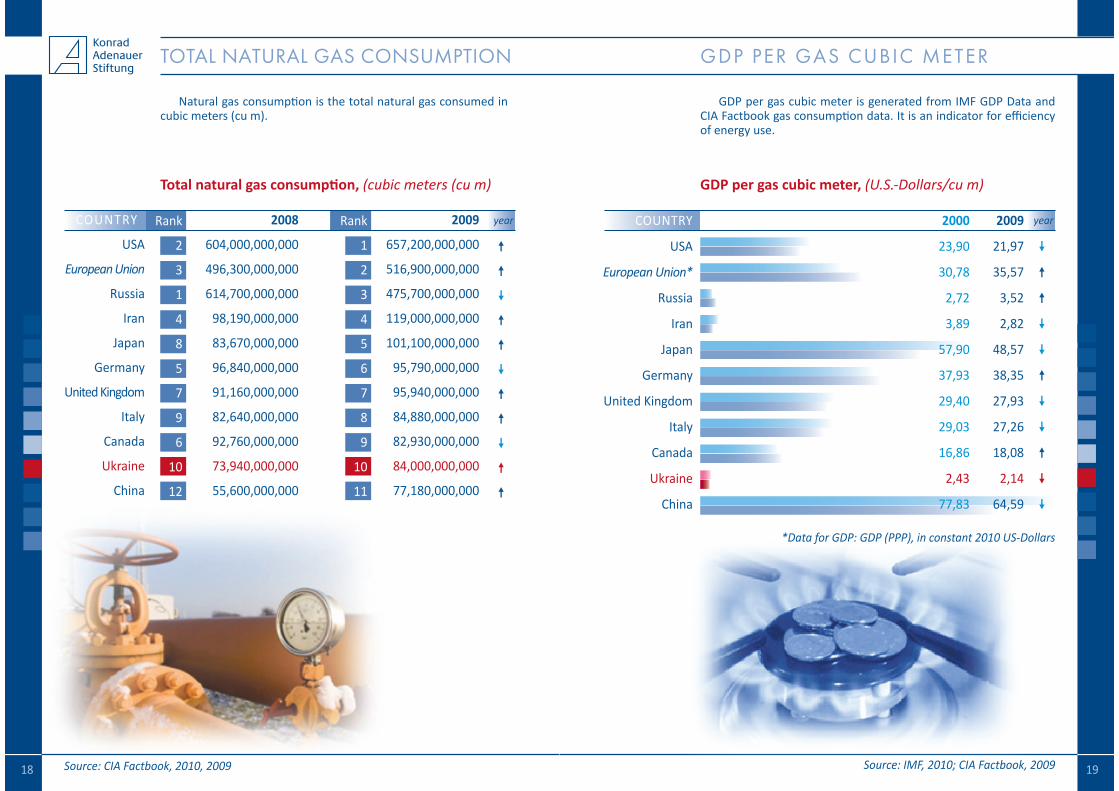
natural gas consumption is the total natural gas consumed in cubic meters (cu m).
TOTal NaTURal Gas CONsUmpTION
Total natural gas consumption, (cubic meters (cu m)
Rank
2
3
1
4
8
5
7
9
6
10
12
Rank
1
2
3
4
5
6
7
8
9
10
11
2008
604,000,000,000
496,300,000,000
614,700,000,000
98,190,000,000
83,670,000,000
96,840,000,000
91,160,000,000
82,640,000,000
92,760,000,000
73,940,000,000
55,600,000,000
2009
657,200,000,000
516,900,000,000
475,700,000,000
119,000,000,000
101,100,000,000
95,790,000,000
95,940,000,000
84,880,000,000
82,930,000,000
84,000,000,000
77,180,000,000
COUnTRy
USA
European Union
Russia
Iran
Japan
Germany
United Kingdom
Italy
Canada
Ukraine
China
Source: CIA Factbook, 2010, 2009
�
�
�
�
�
�
�
�
�
�
�
Source: IMF, 2010; CIA Factbook, 2009
*Data for GDP: GDP (PPP), in constant 2010 US-Dollars
GDP per gas cubiс meter is generated from IMF GDP Data and CIA Factbook gas consumption data. It is an indicator for efficiency of energy use.
GDp peR Gas CUbIс meTeR
GDP per gas cubiс meter, (U.S.-Dollars/cu m)
COUnTRy
USA
European Union*
Russia
Iran
Japan
Germany
United Kingdom
Italy
Canada
Ukraine
China
2000
23,90
30,78
2,72
3,89
57,90
37,93
29,40
29,03
16,86
2,43
77,83
2009
21,97
35,57
3,52
2,82
48,57
38,35
27,93
27,26
18,08
2,14
64,59
�
�
�
�
�
�
�
�
�
�
�
20 21
year year
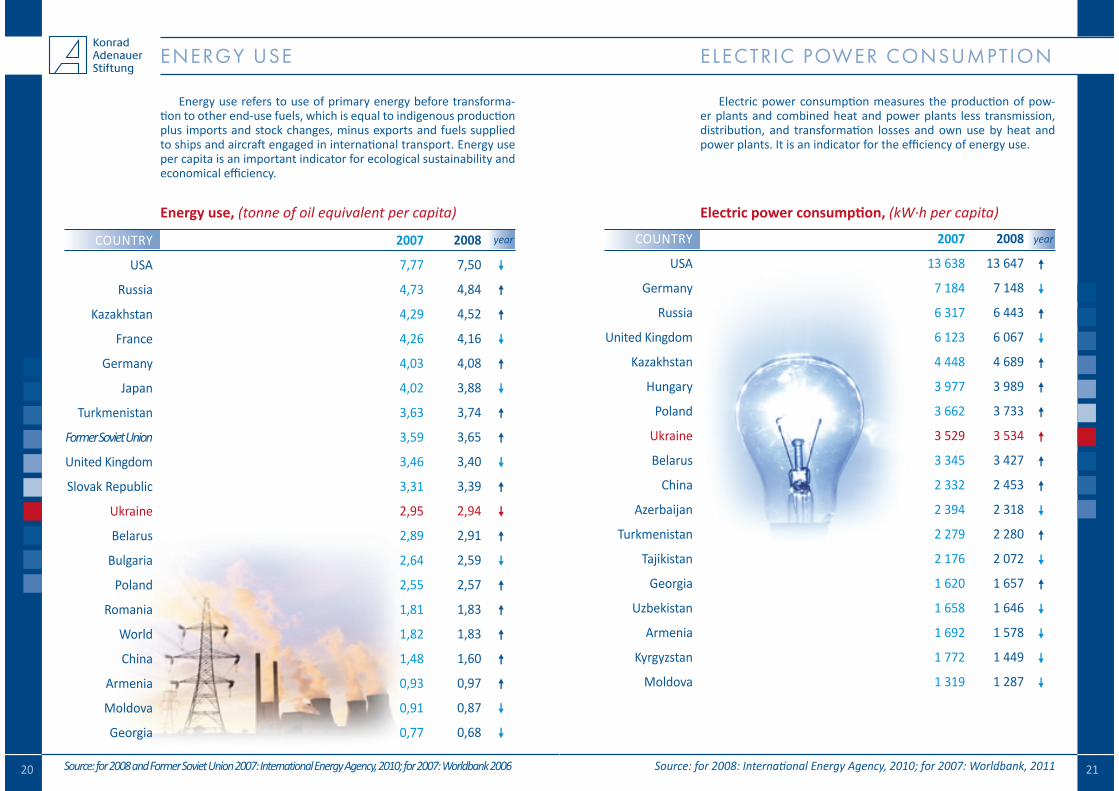
Energy use refers to use of primary energy before transforma-tion to other end-use fuels, which is equal to indigenous production plus imports and stock changes, minus exports and fuels supplied to ships and aircraft engaged in international transport. Energy use per capita is an important indicator for ecological sustainability and economical efficiency.
eNeRGy Use
Energy use, (tonne of oil equivalent per capita)
COUnTRy
USA
Russia
Kazakhstan
France
Germany
Japan
Turkmenistan
Former Soviet Union
United Kingdom
Slovak Republic
Ukraine
Belarus
Bulgaria
Poland
Romania
World
China
Armenia
Moldova
Georgia
2007
7,77
4,73
4,29
4,26
4,03
4,02
3,63
3,59
3,46
3,31
2,95
2,89
2,64
2,55
1,81
1,82
1,48
0,93
0,91
0,77
2008
7,50
4,84
4,52
4,16
4,08
3,88
3,74
3,65
3,40
3,39
2,94
2,91
2,59
2,57
1,83
1,83
1,60
0,97
0,87
0,68
Source: for 2008 and Former Soviet Union 2007: International Energy Agency, 2010; for 2007: Worldbank 2006
�
�
�
�
�
�
�
�
�
�
�
�
�
�
�
�
�
�
�
�
Electric power consumption measures the production of pow-er plants and combined heat and power plants less transmission, distribution, and transformation losses and own use by heat and power plants. It is an indicator for the efficiency of energy use.
eleCTRIC pOweR CONsUmpTION
Electric power consumption, (kW·h per capita)
COUnTRy
USA
Germany
Russia
United Kingdom
Kazakhstan
Hungary
Poland
Ukraine
Belarus
China
Azerbaijan
Turkmenistan
Tajikistan
Georgia
Uzbekistan
Armenia
Kyrgyzstan
Moldova
Source: for 2008: International Energy Agency, 2010; for 2007: Worldbank, 2011
�
�
�
�
�
�
�
�
�
�
�
�
�
�
�
�
�
�
2007
13 638
7 184
6 317
6 123
4 448
3 977
3 662
3 529
3 345
2 332
2 394
2 279
2 176
1 620
1 658
1 692
1 772
1 319
2008
13 647
7 148
6 443
6 067
4 689
3 989
3 733
3 534
3 427
2 453
2 318
2 280
2 072
1 657
1 646
1 578
1 449
1 287
22 23
year
yearCOUnTRy
Norway
Euro Zone
USA
United Kingdom
Hungary
South Afrika
Poland
Russia
Ukraine
China
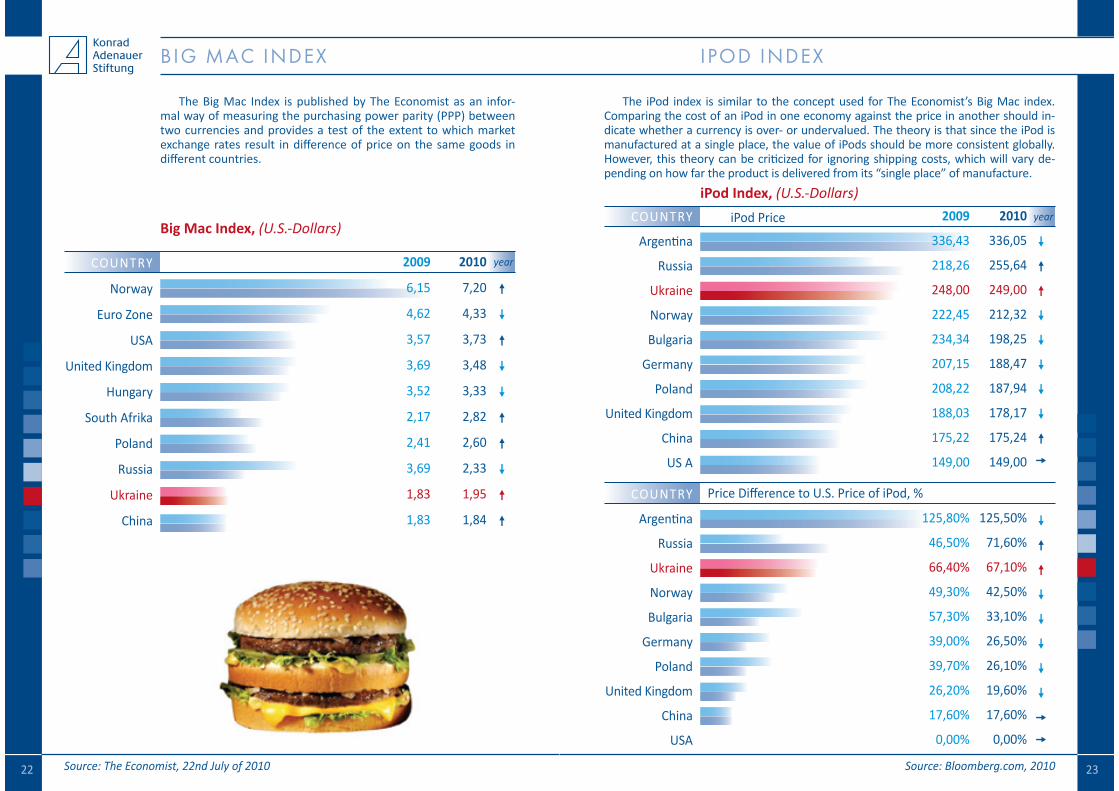
The Big Mac Index is published by The Economist as an infor-mal way of measuring the purchasing power parity (PPP) between two currencies and provides a test of the extent to which market exchange rates result in difference of price on the same goods in different countries.
bIG maC INDex
Big Mac Index, (U.S.-Dollars)
Source: The Economist, 22nd July of 2010
iPod Price
Price Difference to U.S. Price of iPod, %
The iPod index is similar to the concept used for The Economist’s Big Mac index. Comparing the cost of an iPod in one economy against the price in another should in-dicate whether a currency is over- or undervalued. The theory is that since the iPod is manufactured at a single place, the value of iPods should be more consistent globally. However, this theory can be criticized for ignoring shipping costs, which will vary de-pending on how far the product is delivered from its “single place” of manufacture.
IpOD INDex
iPod Index, (U.S.-Dollars)COUnTRy
Argentina
Russia
Ukraine
Norway
Bulgaria
Germany
Poland
United Kingdom
China
US A
COUnTRy
Argentina
Russia
Ukraine
Norway
Bulgaria
Germany
Poland
United Kingdom
China
USA
2009
336,43
218,26
248,00
222,45
234,34
207,15
208,22
188,03
175,22
149,00
125,80%
46,50%
66,40%
49,30%
57,30%
39,00%
39,70%
26,20%
17,60%
0,00%
2010
336,05
255,64
249,00
212,32
198,25
188,47
187,94
178,17
175,24
149,00
125,50%
71,60%
67,10%
42,50%
33,10%
26,50%
26,10%
19,60%
17,60%
0,00%
Source: Bloomberg.com, 2010
�
�
�
�
�
�
�
�
�
�
�
�
�
�
�
�
�
�
�
�
2009
6,15
4,62
3,57
3,69
3,52
2,17
2,41
3,69
1,83
1,83
2010
7,20
4,33
3,73
3,48
3,33
2,82
2,60
2,33
1,95
1,84
�
�
�
�
�
�
�
�
�
�
24 25
year year
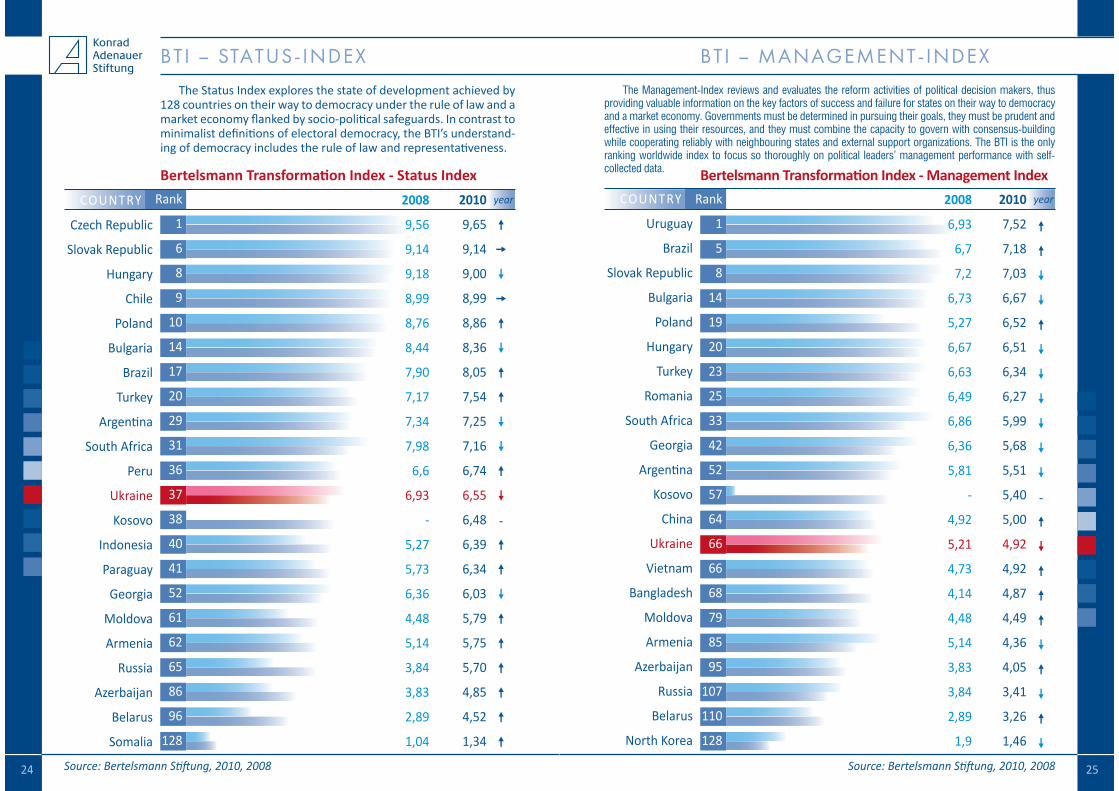
The Status Index explores the state of development achieved by 128 countries on their way to democracy under the rule of law and a market economy flanked by socio-political safeguards. In contrast to minimalist definitions of electoral democracy, the BTI’s understand-ing of democracy includes the rule of law and representativeness.
bTI -- sTaTUs- INDex
COUnTRy
Czech Republic
Slovak Republic
Hungary
Chile
Poland
Bulgaria
Brazil
Turkey
Argentina
South Africa
Peru
Ukraine
Kosovo
Indonesia
Paraguay
Georgia
Moldova
Armenia
Russia
Azerbaijan
Belarus
Somalia
Rank
1
6
8
9
10
14
17
20
29
31
36
37
38
40
41
52
61
62
65
86
96
128
Source: Bertelsmann Stiftung, 2010, 2008
The Management-Index reviews and evaluates the reform activities of political decision makers, thus providing valuable information on the key factors of success and failure for states on their way to democracy and a market economy. Governments must be determined in pursuing their goals, they must be prudent and effective in using their resources, and they must combine the capacity to govern with consensus-building while cooperating reliably with neighbouring states and external support organizations. The BTI is the only ranking worldwide index to focus so thoroughly on political leaders’ management performance with self-collected data.
bTI -- maNaGemeNT-INDex
Source: Bertelsmann Stiftung, 2010, 2008
COUnTRy
Uruguay
Brazil
Slovak Republic
Bulgaria
Poland
Hungary
Turkey
Romania
South Africa
Georgia
Argentina
Kosovo
China
Ukraine
Vietnam
Bangladesh
Moldova
Armenia
Azerbaijan
Russia
Belarus
North Korea
Rank
1
5
8
14
19
20
23
25
33
42
52
57
64
66
66
68
79
85
95
107
110
128
�
�
�
�
�
�
�
�
�
�
�
-
�
�
�
�
�
�
�
�
�
�
2008
9,56
9,14
9,18
8,99
8,76
8,44
7,90
7,17
7,34
7,98
6,6
6,93
-
5,27
5,73
6,36
4,48
5,14
3,84
3,83
2,89
1,04
2010
9,65
9,14
9,00
8,99
8,86
8,36
8,05
7,54
7,25
7,16
6,74
6,55
6,48
6,39
6,34
6,03
5,79
5,75
5,70
4,85
4,52
1,34
�
�
�
�
�
�
�
�
�
�
�
�
-
�
�
�
�
�
�
�
�
�
2008
6,93
6,7
7,2
6,73
5,27
6,67
6,63
6,49
6,86
6,36
5,81
-
4,92
5,21
4,73
4,14
4,48
5,14
3,83
3,84
2,89
1,9
2010
7,52
7,18
7,03
6,67
6,52
6,51
6,34
6,27
5,99
5,68
5,51
5,40
5,00
4,92
4,92
4,87
4,49
4,36
4,05
3,41
3,26
1,46
Bertelsmann Transformation Index - Status Index Bertelsmann Transformation Index - Management Index
26 27
year
year
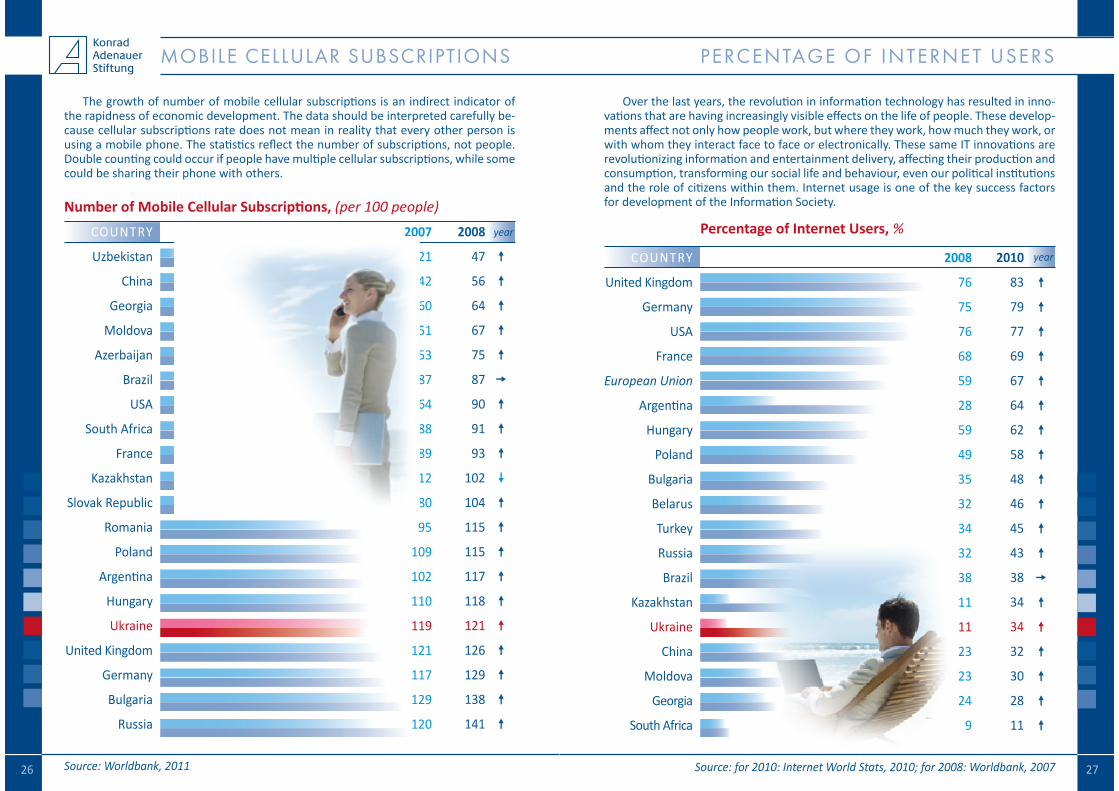
The growth of number of mobile cellular subscriptions is an indirect indicator of the rapidness of economic development. The data should be interpreted carefully be-cause cellular subscriptions rate does not mean in reality that every other person is using a mobile phone. The statistics reflect the number of subscriptions, not people. Double counting could occur if people have multiple cellular subscriptions, while some could be sharing their phone with others.
mObIle CellUlaR sUbsCRIpTIONs
Number of Mobile Cellular Subscriptions, (per 100 people)COUnTRy
Uzbekistan
China
Georgia
Moldova
Azerbaijan
Brazil
USA
South Africa
France
Kazakhstan
Slovak Republic
Romania
Poland
Argentina
Hungary
Ukraine
United Kingdom
Germany
Bulgaria
Russia
Source: Worldbank, 2011
2007
21
42
60
51
53
87
64
88
89
112
80
95
109
102
110
119
121
117
129
120
2008
47
56
64
67
75
87
90
91
93
102
104
115
115
117
118
121
126
129
138
141
Over the last years, the revolution in information technology has resulted in inno-vations that are having increasingly visible effects on the life of people. These develop-ments affect not only how people work, but where they work, how much they work, or with whom they interact face to face or electronically. These same IT innovations are revolutionizing information and entertainment delivery, affecting their production and consumption, transforming our social life and behaviour, even our political institutions and the role of citizens within them. Internet usage is one of the key success factors for development of the Information Society.
peRCeNTaGe Of INTeRNeT UseRs
Percentage of Internet Users, %
COUnTRy
United Kingdom
Germany
USA
France
European Union
Argentina
Hungary
Poland
Bulgaria
Belarus
Turkey
Russia
Brazil
Kazakhstan
Ukraine
China
Moldova
Georgia
South Africa
Source: for 2010: Internet World Stats, 2010; for 2008: Worldbank, 2007
2008
76
75
76
68
59
28
59
49
35
32
34
32
38
11
11
23
23
24
9
2010
83
79
77
69
67
64
62
58
48
46
45
43
38
34
34
32
30
28
11
�
�
�
�
�
�
�
�
�
�
�
�
�
�
�
�
�
�
�
�
�
�
�
�
�
�
�
�
�
�
�
�
�
�
�
�
�
�
�
28 29
year
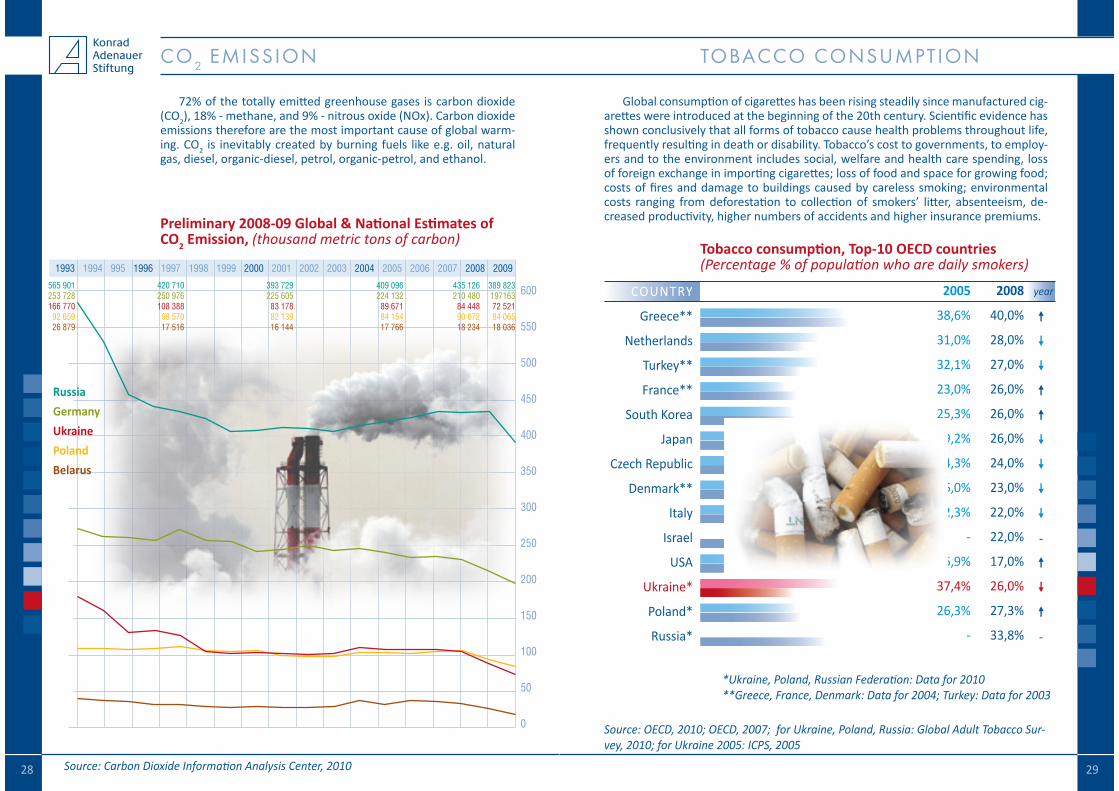
72% of the totally emitted greenhouse gases is carbon dioxide (CO2), 18% - methane, and 9% - nitrous oxide (nOx). Carbon dioxide emissions therefore are the most important cause of global warm-ing. CO2 is inevitably created by burning fuels like e.g. oil, natural gas, diesel, organic-diesel, petrol, organic-petrol, and ethanol.
CO2 emIssION
Preliminary 2008-09 Global & National Estimates of CO2 Emission, (thousand metric tons of carbon)
Source: Carbon Dioxide Information Analysis Center, 2010
600
550
500
450
400
350
300
250
200
150
100
50
0
1993 1994 995 1996 1997 1998 1999 2000 2001 2002 2003 2004 2005 2006 2007 2008 2009
565 901253 728166 770
92 65926 879
420 710250 976108 388
98 57017 516
393 729225 605
83 17882 13916 144
409 096224 132
89 67184 15417 766
435 126210 480
84 44890 07218 234
389 823 19716372 52184 06518 036
RussiaGermany UkrainePolandBelarus
Global consumption of cigarettes has been rising steadily since manufactured cig-arettes were introduced at the beginning of the 20th century. Scientific evidence has shown conclusively that all forms of tobacco cause health problems throughout life, frequently resulting in death or disability. Tobacco’s cost to governments, to employ-ers and to the environment includes social, welfare and health care spending, loss of foreign exchange in importing cigarettes; loss of food and space for growing food; costs of fires and damage to buildings caused by careless smoking; environmental costs ranging from deforestation to collection of smokers’ litter, absenteeism, de-creased productivity, higher numbers of accidents and higher insurance premiums.
TObaCCO CONsUmpTION
Tobacco consumption, Top-10 OECD countries(Percentage % of population who are daily smokers)
COUnTRy
Greece**
Netherlands
Turkey**
France**
South Korea
Japan
Czech Republic
Denmark**
Italy
Israel
USA
Ukraine*
Poland*
Russia*
Source: OECD, 2010; OECD, 2007; for Ukraine, Poland, Russia: Global Adult Tobacco Sur-vey, 2010; for Ukraine 2005: ICPS, 2005
*Ukraine, Poland, Russian Federation: Data for 2010**Greece, France, Denmark: Data for 2004; Turkey: Data for 2003
2005
38,6%
31,0%
32,1%
23,0%
25,3%
29,2%
24,3%
26,0%
22,3%
-
16,9%
37,4%
26,3%
-
2008
40,0%
28,0%
27,0%
26,0%
26,0%
26,0%
24,0%
23,0%
22,0%
22,0%
17,0%
26,0%
27,3%
33,8%
�
�
�
�
�
�
�
�
�
-
�
�
�
-
30 31
year
DealeRs Of lUxURy vehIClespasseNGeR CaRs
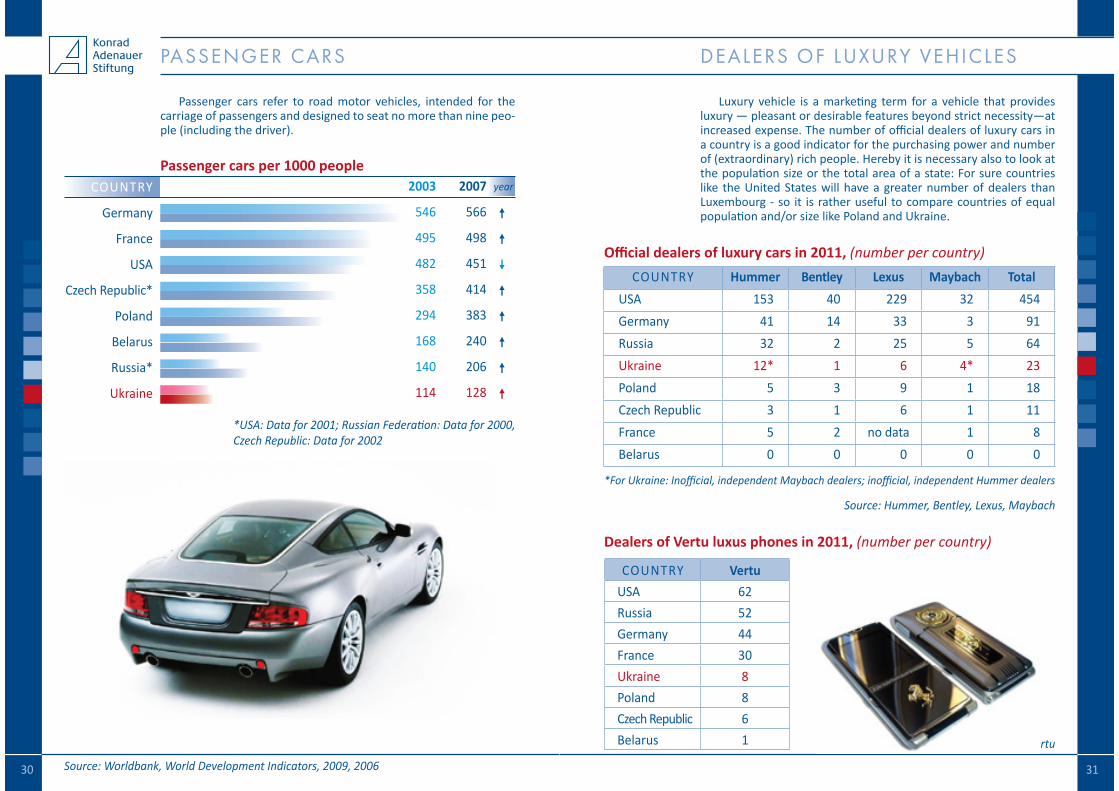
Passenger cars per 1000 people COUnTRy
Germany
France
USA
Czech Republic*
Poland
Belarus
Russia*
Ukraine
2003
546
495
482
358
294
168
140
114
2007
566
498
451
414
383
240
206
128
Passenger cars refer to road motor vehicles, intended for the carriage of passengers and designed to seat no more than nine peo-ple (including the driver).
�
�
�
�
�
�
�
�
Official dealers of luxury cars in 2011, (number per country)
Dealers of Vertu luxus phones in 2011, (number per country)
Source: Vertu
Source: Hummer, Bentley, Lexus, Maybach
COUnTRy Hummer Bentley Lexus Maybach TotalUSA 153 40 229 32 454Germany 41 14 33 3 91Russia 32 2 25 5 64Ukraine 12* 1 6 4* 23Poland 5 3 9 1 18Czech Republic 3 1 6 1 11France 5 2 no data 1 8Belarus 0 0 0 0 0
*For Ukraine: Inofficial, independent Maybach dealers; inofficial, independent Hummer dealers
Luxury vehicle is a marketing term for a vehicle that provides luxury — pleasant or desirable features beyond strict necessity—at increased expense. The number of official dealers of luxury cars in a country is a good indicator for the purchasing power and number of (extraordinary) rich people. Hereby it is necessary also to look at the population size or the total area of a state: For sure countries like the United States will have a greater number of dealers than Luxembourg - so it is rather useful to compare countries of equal population and/or size like Poland and Ukraine.
COUnTRy VertuUSA 62Russia 52Germany 44France 30Ukraine 8Poland 8Czech Republic 6Belarus 1
Source: Worldbank, World Development Indicators, 2009, 2006
*USA: Data for 2001; Russian Federation: Data for 2000, Czech Republic: Data for 2002
32 33
year
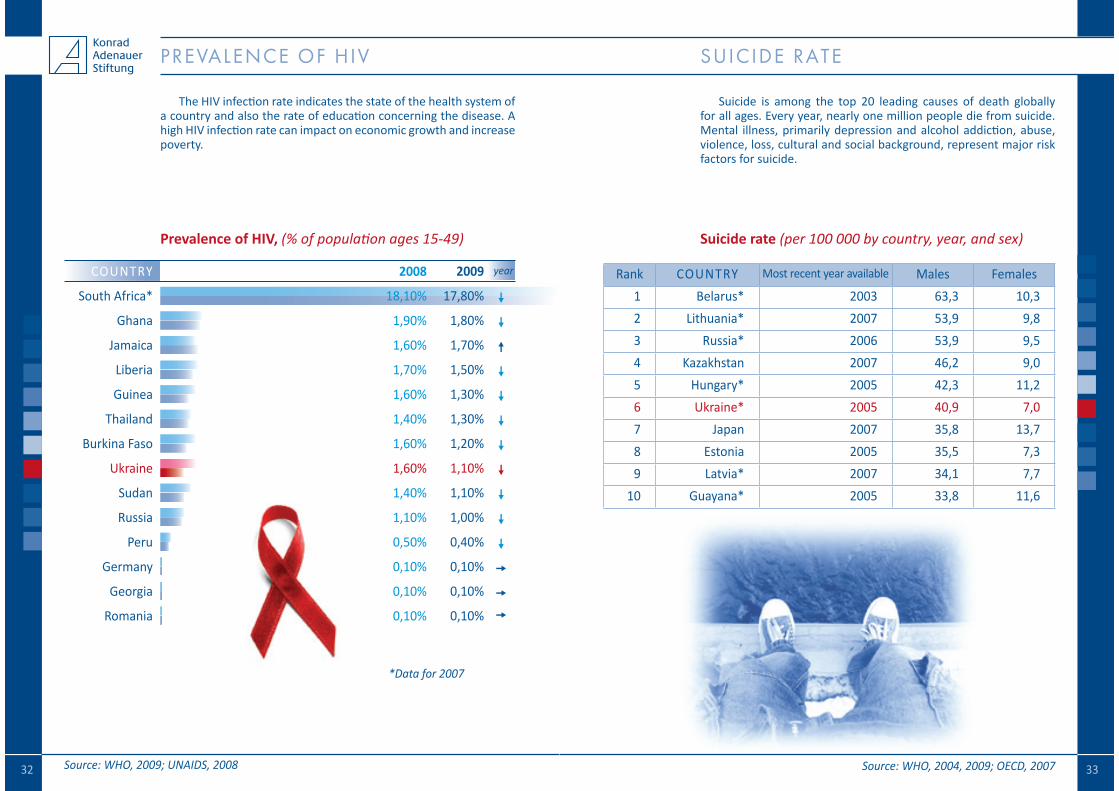
The HIV infection rate indicates the state of the health system of a country and also the rate of education concerning the disease. A high HIV infection rate can impact on economic growth and increase poverty.
pRevaleNCe Of hIv
Prevalence of HIV, (% of population ages 15-49)
COUnTRy
South Africa*
Ghana
Jamaica
Liberia
Guinea
Thailand
Burkina Faso
Ukraine
Sudan
Russia
Peru
Germany
Georgia
Romania
Source: WHO, 2009; UNAIDS, 2008
*Data for 2007
2008
18,10%
1,90%
1,60%
1,70%
1,60%
1,40%
1,60%
1,60%
1,40%
1,10%
0,50%
0,10%
0,10%
0,10%
2009
17,80%
1,80%
1,70%
1,50%
1,30%
1,30%
1,20%
1,10%
1,10%
1,00%
0,40%
0,10%
0,10%
0,10%
�
�
�
�
�
�
�
�
�
�
�
�
�
�
Suicide is among the top 20 leading causes of death globally for all ages. Every year, nearly one million people die from suicide. Mental illness, primarily depression and alcohol addiction, abuse, violence, loss, cultural and social background, represent major risk factors for suicide.
sUICIDe RaTe
Suicide rate (per 100 000 by country, year, and sex)
Rank COUnTRy Most recent year available Males Females1 Belarus* 2003 63,3 10,32 Lithuania* 2007 53,9 9,83 Russia* 2006 53,9 9,54 Kazakhstan 2007 46,2 9,05 Hungary* 2005 42,3 11,26 Ukraine* 2005 40,9 7,07 Japan 2007 35,8 13,78 Estonia 2005 35,5 7,39 Latvia* 2007 34,1 7,7
10 Guayana* 2005 33,8 11,6
Source: WHO, 2004, 2009; OECD, 2007
34 35
yearyear
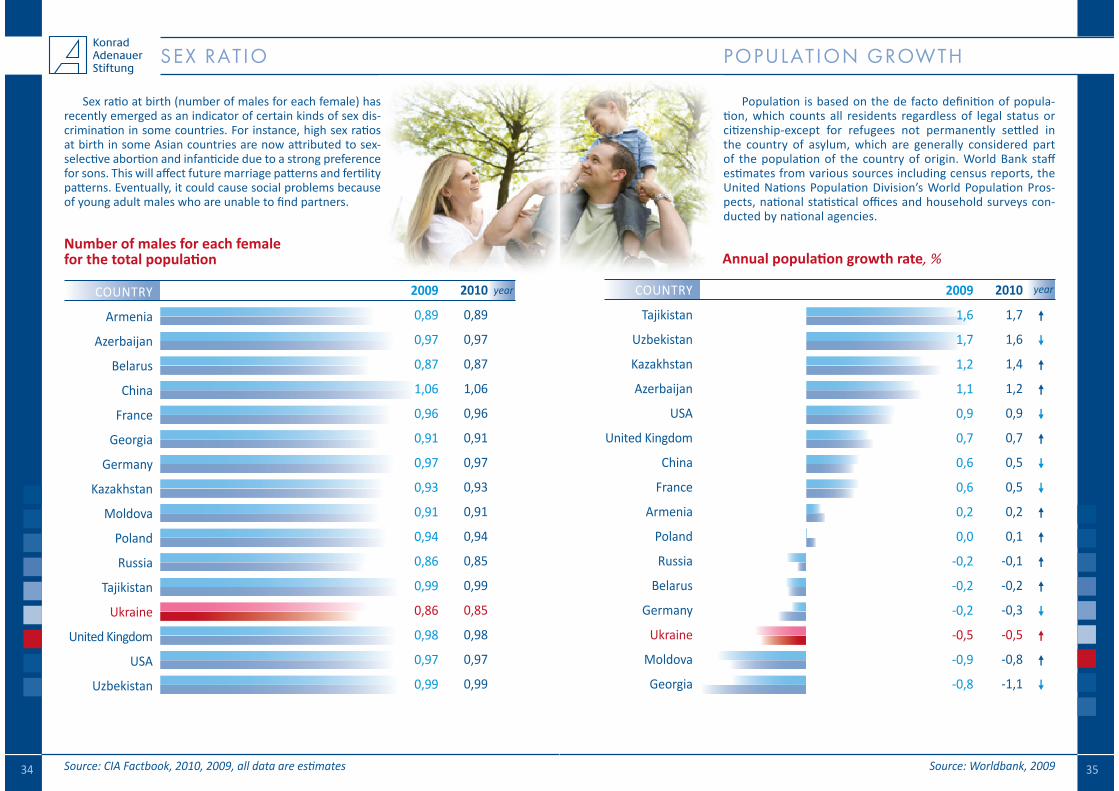
Sex ratio at birth (number of males for each female) has recently emerged as an indicator of certain kinds of sex dis-crimination in some countries. For instance, high sex ratios at birth in some Asian countries are now attributed to sex-selective abortion and infanticide due to a strong preference for sons. This will affect future marriage patterns and fertility patterns. Eventually, it could cause social problems because of young adult males who are unable to find partners.
sex RaTIO
Number of males for each female for the total population
Source: CIA Factbook, 2010, 2009, all data are estimates
COUnTRy
Armenia
Azerbaijan
Belarus
China
France
Georgia
Germany
Kazakhstan
Moldova
Poland
Russia
Tajikistan
Ukraine
United Kingdom
USA
Uzbekistan
2009
0,89
0,97
0,87
1,06
0,96
0,91
0,97
0,93
0,91
0,94
0,86
0,99
0,86
0,98
0,97
0,99
2009
1,6
1,7
1,2
1,1
0,9
0,7
0,6
0,6
0,2
0,0
-0,2
-0,2
-0,2
-0,5
-0,9
-0,8
2010
0,89
0,97
0,87
1,06
0,96
0,91
0,97
0,93
0,91
0,94
0,85
0,99
0,85
0,98
0,97
0,99
2010
1,7
1,6
1,4
1,2
0,9
0,7
0,5
0,5
0,2
0,1
-0,1
-0,2
-0,3
-0,5
-0,8
-1,1
Population is based on the de facto definition of popula-tion, which counts all residents regardless of legal status or citizenship-except for refugees not permanently settled in the country of asylum, which are generally considered part of the population of the country of origin. World Bank staff estimates from various sources including census reports, the United nations Population Division’s World Population Pros-pects, national statistical offices and household surveys con-ducted by national agencies.
pOpUlaTION GROwTh
Annual population growth rate, %
Source: Worldbank, 2009
COUnTRy
Tajikistan
Uzbekistan
Kazakhstan
Azerbaijan
USA
United Kingdom
China
France
Armenia
Poland
Russia
Belarus
Germany
Ukraine
Moldova
Georgia
�
�
�
�
�
�
�
�
�
�
�
�
�
�
�
�
36 37
year
year
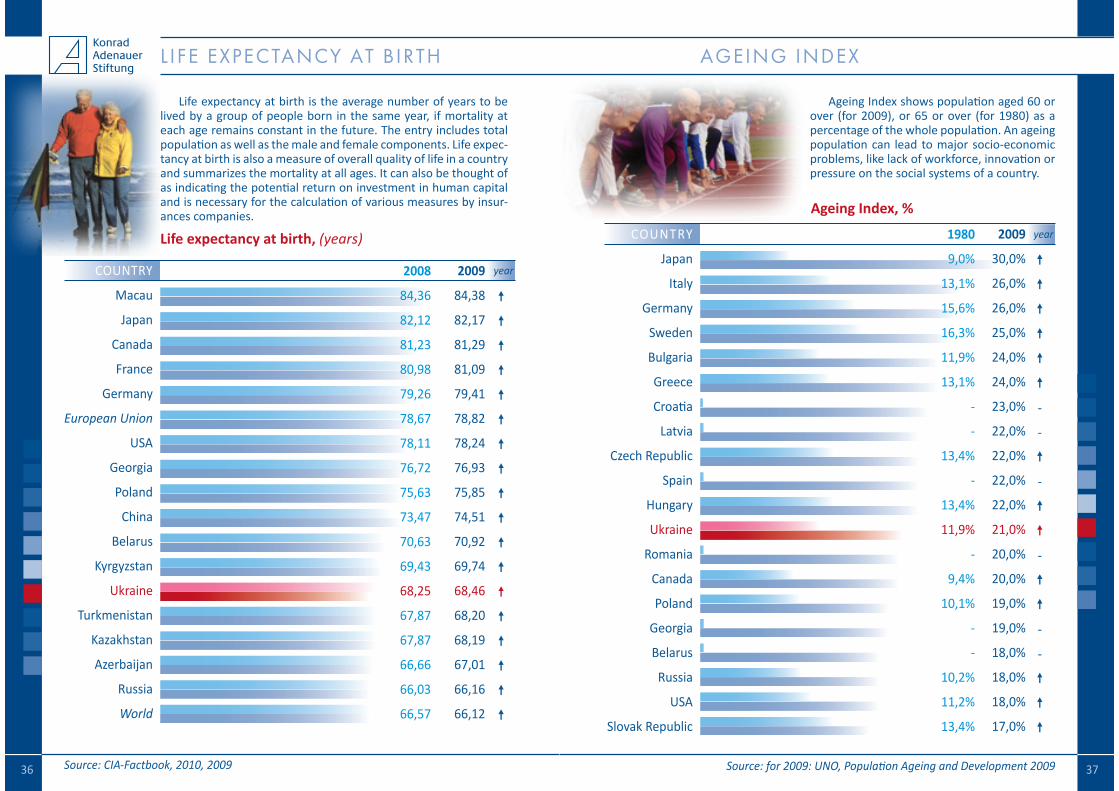
Life expectancy at birth is the average number of years to be lived by a group of people born in the same year, if mortality at each age remains constant in the future. The entry includes total population as well as the male and female components. Life expec-tancy at birth is also a measure of overall quality of life in a country and summarizes the mortality at all ages. It can also be thought of as indicating the potential return on investment in human capital and is necessary for the calculation of various measures by insur-ances companies.
l Ife expeCTaNCy aT bIRTh
Life expectancy at birth, (years)
COUnTRy
Macau
Japan
Canada
France
Germany
European Union
USA
Georgia
Poland
China
Belarus
Kyrgyzstan
Ukraine
Turkmenistan
Kazakhstan
Azerbaijan
Russia
World
Source: CIA-Factbook, 2010, 2009
2008
84,36
82,12
81,23
80,98
79,26
78,67
78,11
76,72
75,63
73,47
70,63
69,43
68,25
67,87
67,87
66,66
66,03
66,57
2009
84,38
82,17
81,29
81,09
79,41
78,82
78,24
76,93
75,85
74,51
70,92
69,74
68,46
68,20
68,19
67,01
66,16
66,12
�
�
�
�
�
�
�
�
�
�
�
�
�
�
�
�
�
�
Ageing Index shows population aged 60 or over (for 2009), or 65 or over (for 1980) as a percentage of the whole population. An ageing population can lead to major socio-economic problems, like lack of workforce, innovation or pressure on the social systems of a country.
aGeING INDex
Ageing Index, %
COUnTRy
Japan
Italy
Germany
Sweden
Bulgaria
Greece
Croatia
Latvia
Czech Republic
Spain
Hungary
Ukraine
Romania
Canada
Poland
Georgia
Belarus
Russia
USA
Slovak Republic
Source: for 2009: UNO, Population Ageing and Development 2009
1980
9,0%
13,1%
15,6%
16,3%
11,9%
13,1%
-
-
13,4%
-
13,4%
11,9%
-
9,4%
10,1%
-
-
10,2%
11,2%
13,4%
2009
30,0%
26,0%
26,0%
25,0%
24,0%
24,0%
23,0%
22,0%
22,0%
22,0%
22,0%
21,0%
20,0%
20,0%
19,0%
19,0%
18,0%
18,0%
18,0%
17,0%
�
�
�
�
�
�
-
-
�
-
�
�
-
�
�
-
-
�
�
�
38 39
year
year
healTh seRvICes
Private Expenditure on Health, (% of total expenditure on health)
Physicians (per 1000 people)
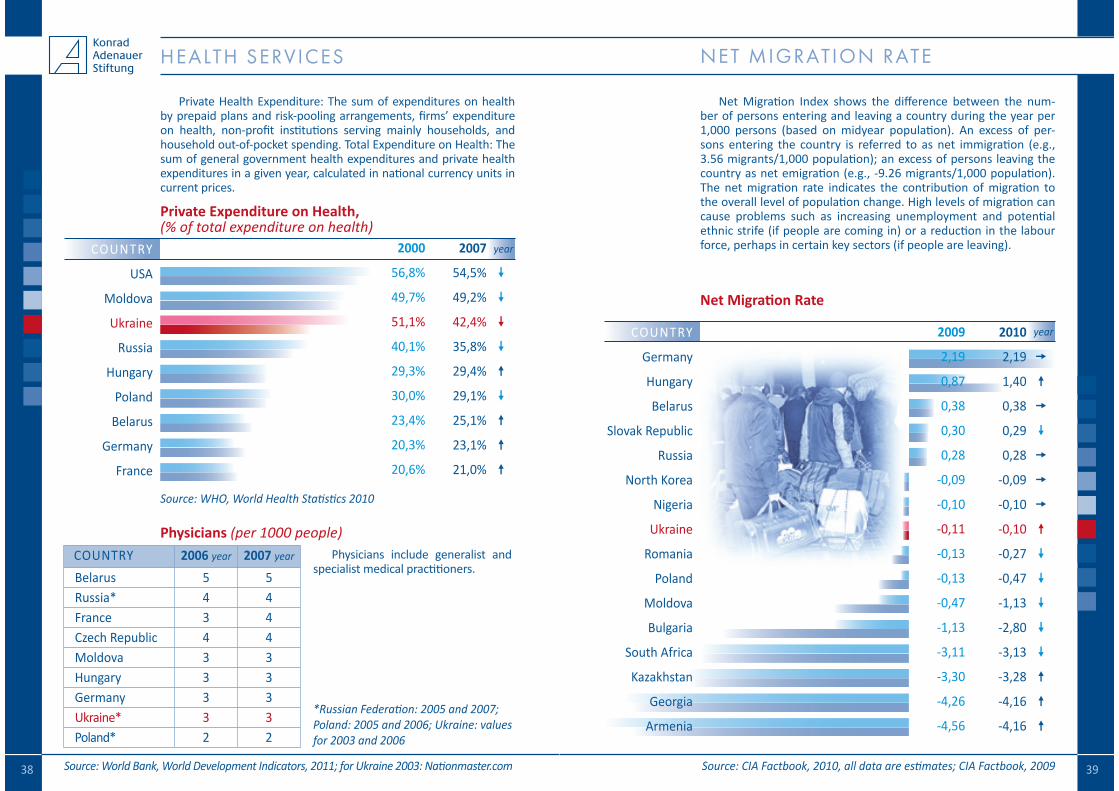
Private Health Expenditure: The sum of expenditures on health by prepaid plans and risk-pooling arrangements, firms’ expenditure on health, non-profit institutions serving mainly households, and household out-of-pocket spending. Total Expenditure on Health: The sum of general government health expenditures and private health expenditures in a given year, calculated in national currency units in current prices.
Physicians include generalist and specialist medical practitioners.
Source: World Bank, World Development Indicators, 2011; for Ukraine 2003: Nationmaster.com
Source: WHO, World Health Statistics 2010
2007
54,5%
49,2%
42,4%
35,8%
29,4%
29,1%
25,1%
23,1%
21,0%
2010
2,19
1,40
0,38
0,29
0,28
-0,09
-0,10
-0,10
-0,27
-0,47
-1,13
-2,80
-3,13
-3,28
-4,16
-4,16
2000
56,8%
49,7%
51,1%
40,1%
29,3%
30,0%
23,4%
20,3%
20,6%
2009
2,19
0,87
0,38
0,30
0,28
-0,09
-0,10
-0,11
-0,13
-0,13
-0,47
-1,13
-3,11
-3,30
-4,26
-4,56
COUnTRy
USA
Moldova
Ukraine
Russia
Hungary
Poland
Belarus
Germany
France
�
�
�
�
�
�
�
�
�
�
�
�
�
�
�
�
�
�
�
�
�
�
�
�
�
COUnTRy 2006 year 2007 year
Belarus 5 5Russia* 4 4France 3 4Czech Republic 4 4Moldova 3 3Hungary 3 3Germany 3 3Ukraine* 3 3Poland* 2 2
*Russian Federation: 2005 and 2007; Poland: 2005 and 2006; Ukraine: values for 2003 and 2006
net Migration Index shows the difference between the num-ber of persons entering and leaving a country during the year per 1,000 persons (based on midyear population). An excess of per-sons entering the country is referred to as net immigration (e.g., 3.56 migrants/1,000 population); an excess of persons leaving the country as net emigration (e.g., -9.26 migrants/1,000 population). The net migration rate indicates the contribution of migration to the overall level of population change. High levels of migration can cause problems such as increasing unemployment and potential ethnic strife (if people are coming in) or a reduction in the labour force, perhaps in certain key sectors (if people are leaving).
NeT mIGRaTION RaTe
Net Migration Rate
COUnTRy
Germany
Hungary
Belarus
Slovak Republic
Russia
North Korea
Nigeria
Ukraine
Romania
Poland
Moldova
Bulgaria
South Africa
Kazakhstan
Georgia
Armenia
Source: CIA Factbook, 2010, all data are estimates; CIA Factbook, 2009
40 41
year
Global Military Expenditure, (in constant 2008 billions of U.S.-Dollars at exchange rates as of 2008)
Source: SIPRI, The SIPRI Military Expenditure Database, 2011
*Poland, Ukraine, Kazakhstan, Slovak Republic 2009: estimates; China, Russian Federation 2000: estimate**Eritrea: value for 2003
GlObal mIl ITaRIzaTION INDex mIl ITaRy expeNDITURe
Global Militarization Index, 2010
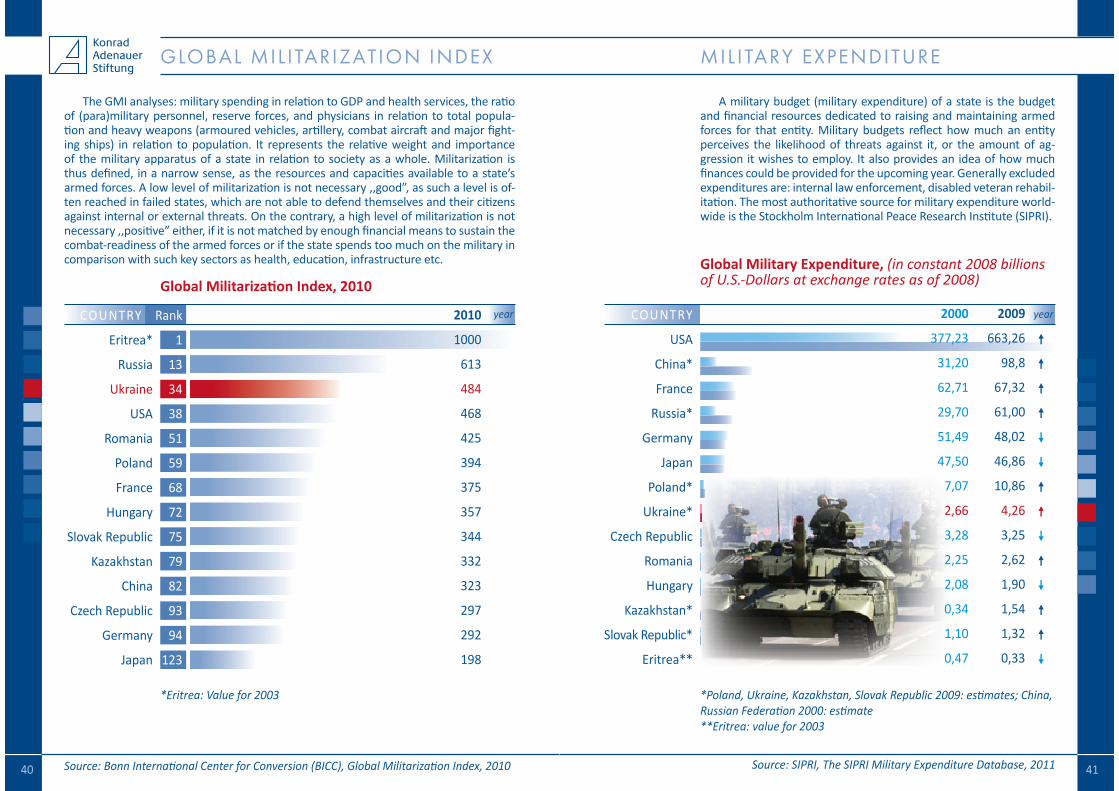
The GMI analyses: military spending in relation to GDP and health services, the ratio of (para)military personnel, reserve forces, and physicians in relation to total popula-tion and heavy weapons (armoured vehicles, artillery, combat aircraft and major fight-ing ships) in relation to population. It represents the relative weight and importance of the military apparatus of a state in relation to society as a whole. Militarization is thus defined, in a narrow sense, as the resources and capacities available to a state’s armed forces. A low level of militarization is not necessary ,,good”, as such a level is of-ten reached in failed states, which are not able to defend themselves and their citizens against internal or external threats. On the contrary, a high level of militarization is not necessary ,,positive” either, if it is not matched by enough financial means to sustain the combat-readiness of the armed forces or if the state spends too much on the military in comparison with such key sectors as health, education, infrastructure etc.
A military budget (military expenditure) of a state is the budget and financial resources dedicated to raising and maintaining armed forces for that entity. Military budgets reflect how much an entity perceives the likelihood of threats against it, or the amount of ag-gression it wishes to employ. It also provides an idea of how much finances could be provided for the upcoming year. Generally excluded expenditures are: internal law enforcement, disabled veteran rehabil-itation. The most authoritative source for military expenditure world-wide is the Stockholm International Peace Research Institute (SIPRI).
Source: Bonn International Center for Conversion (BICC), Global Militarization Index, 2010
COUnTRy
Eritrea*
Russia
Ukraine
USA
Romania
Poland
France
Hungary
Slovak Republic
Kazakhstan
China
Czech Republic
Germany
Japan
Rank
1
13
34
38
51
59
68
72
75
79
82
93
94
123
2010
1000
613
484
468
425
394
375
357
344
332
323
297
292
198
*Eritrea: Value for 2003
year2000
377,23
31,20
62,71
29,70
51,49
47,50
7,07
2,66
3,28
2,25
2,08
0,34
1,10
0,47
2009
663,26
98,8
67,32
61,00
48,02
46,86
10,86
4,26
3,25
2,62
1,90
1,54
1,32
0,33
COUnTRy
USA
China*
France
Russia*
Germany
Japan
Poland*
Ukraine*
Czech Republic
Romania
Hungary
Kazakhstan*
Slovak Republic*
Eritrea**
�
�
�
�
�
�
�
�
�
�
�
�
�
�
42 43
year
expeNDITURe ON R&D
Expenditure on research and development (R&D)
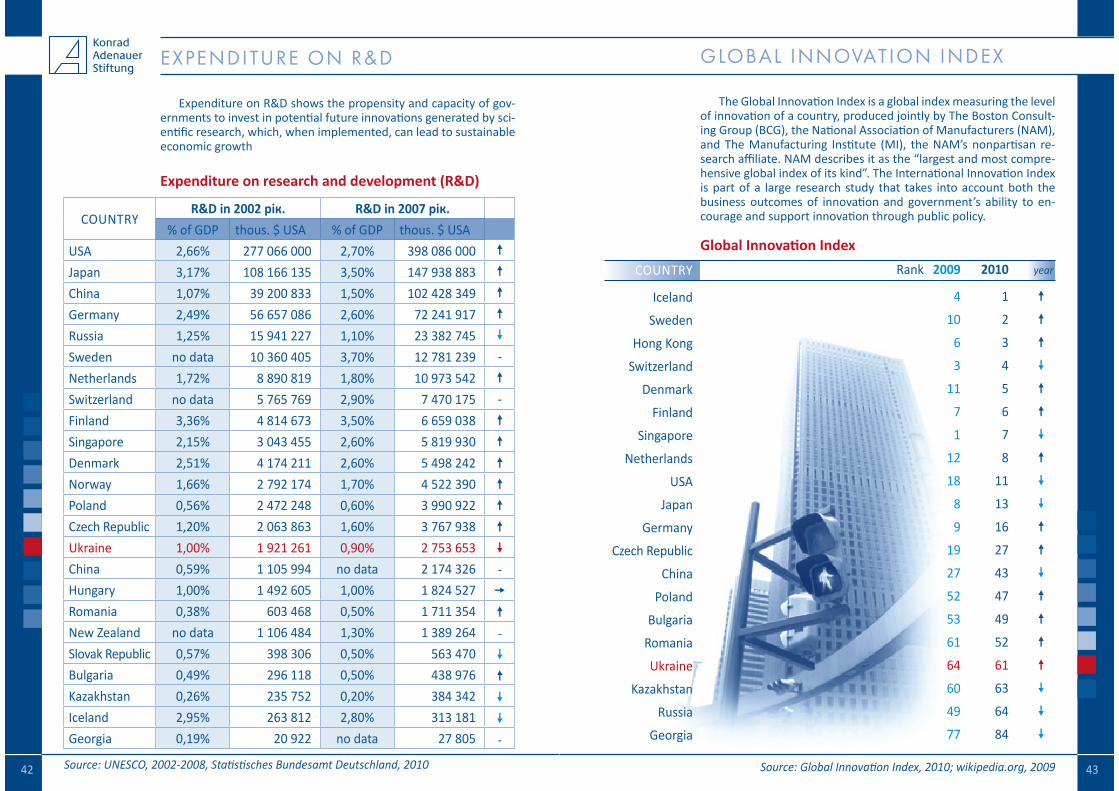
Expenditure on R&D shows the propensity and capacity of gov-ernments to invest in potential future innovations generated by sci-entific research, which, when implemented, can lead to sustainable economic growth
Source: UNESCO, 2002-2008, Statistisches Bundesamt Deutschland, 2010
Rank 2009
4
10
6
3
11
7
1
12
18
8
9
19
27
52
53
61
64
60
49
77
2010
1
2
3
4
5
6
7
8
11
13
16
27
43
47
49
52
61
63
64
84
The Global Innovation Index is a global index measuring the level of innovation of a country, produced jointly by The Boston Consult-ing Group (BCG), the national Association of Manufacturers (nAM), and The Manufacturing Institute (MI), the nAM’s nonpartisan re-search affiliate. nAM describes it as the “largest and most compre-hensive global index of its kind”. The International Innovation Index is part of a large research study that takes into account both the business outcomes of innovation and government’s ability to en-courage and support innovation through public policy.
GlObal INNOvaTION INDex
Global Innovation IndexCOUnTRy
Iceland
Sweden
Hong Kong
Switzerland
Denmark
Finland
Singapore
Netherlands
USA
Japan
Germany
Czech Republic
China
Poland
Bulgaria
Romania
Ukraine
Kazakhstan
Russia
Georgia
Source: Global Innovation Index, 2010; wikipedia.org, 2009
�
�
�
�
�
�
�
�
�
�
�
�
�
�
�
�
�
�
�
�
COUnTRyR&D in 2002 рік. R&D in 2007 рік.
% of GDP thous. $ USA % of GDP thous. $ USA USA 2,66% 277 066 000 2,70% 398 086 000Japan 3,17% 108 166 135 3,50% 147 938 883China 1,07% 39 200 833 1,50% 102 428 349Germany 2,49% 56 657 086 2,60% 72 241 917Russia 1,25% 15 941 227 1,10% 23 382 745Sweden no data 10 360 405 3,70% 12 781 239Netherlands 1,72% 8 890 819 1,80% 10 973 542Switzerland no data 5 765 769 2,90% 7 470 175Finland 3,36% 4 814 673 3,50% 6 659 038Singapore 2,15% 3 043 455 2,60% 5 819 930Denmark 2,51% 4 174 211 2,60% 5 498 242Norway 1,66% 2 792 174 1,70% 4 522 390Poland 0,56% 2 472 248 0,60% 3 990 922Czech Republic 1,20% 2 063 863 1,60% 3 767 938Ukraine 1,00% 1 921 261 0,90% 2 753 653China 0,59% 1 105 994 no data 2 174 326Hungary 1,00% 1 492 605 1,00% 1 824 527Romania 0,38% 603 468 0,50% 1 711 354New Zealand no data 1 106 484 1,30% 1 389 264Slovak Republic 0,57% 398 306 0,50% 563 470Bulgaria 0,49% 296 118 0,50% 438 976Kazakhstan 0,26% 235 752 0,20% 384 342Iceland 2,95% 263 812 2,80% 313 181Georgia 0,19% 20 922 no data 27 805
�
�
�
�
�
-�
-�
�
�
�
�
�
�
-�
�
-�
�
�
�
-
44
year
l Ife saTIsfaCTION
Life satisfaction
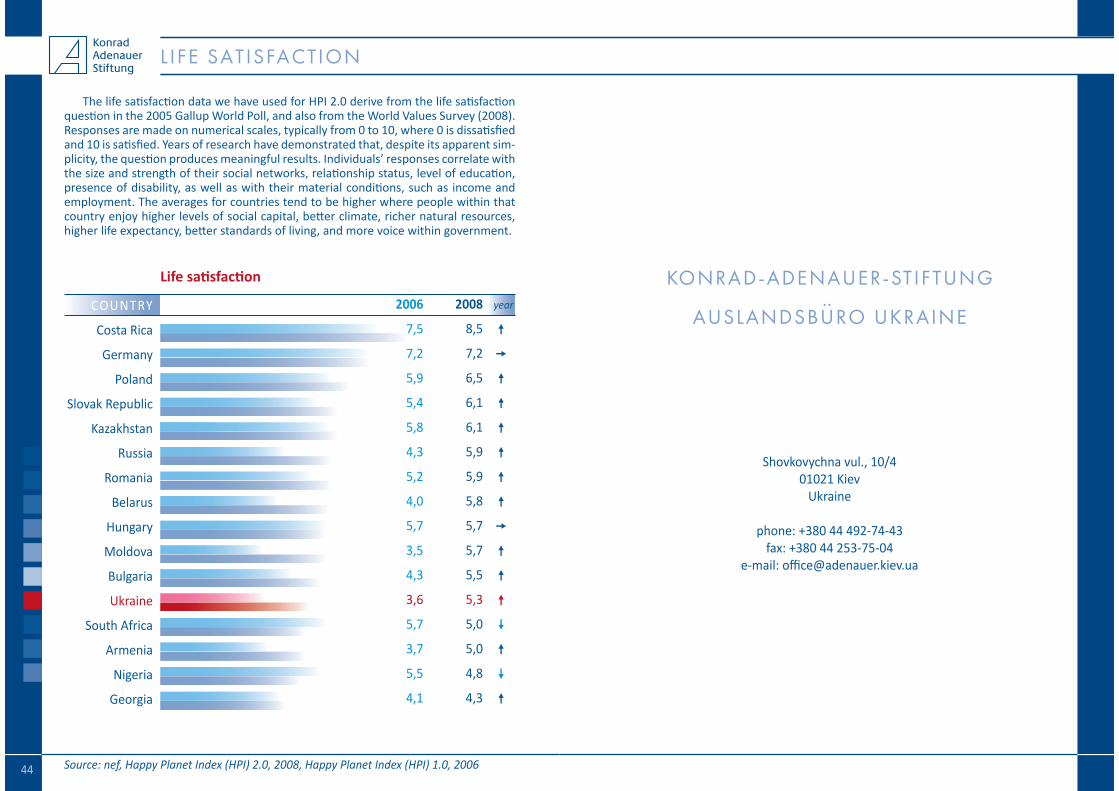
The life satisfaction data we have used for HPI 2.0 derive from the life satisfaction question in the 2005 Gallup World Poll, and also from the World Values Survey (2008). Responses are made on numerical scales, typically from 0 to 10, where 0 is dissatisfied and 10 is satisfied. years of research have demonstrated that, despite its apparent sim-plicity, the question produces meaningful results. Individuals’ responses correlate with the size and strength of their social networks, relationship status, level of education, presence of disability, as well as with their material conditions, such as income and employment. The averages for countries tend to be higher where people within that country enjoy higher levels of social capital, better climate, richer natural resources, higher life expectancy, better standards of living, and more voice within government.
Source: nef, Happy Planet Index (HPI) 2.0, 2008, Happy Planet Index (HPI) 1.0, 2006
2006
7,5
7,2
5,9
5,4
5,8
4,3
5,2
4,0
5,7
3,5
4,3
3,6
5,7
3,7
5,5
4,1
2008
8,5
7,2
6,5
6,1
6,1
5,9
5,9
5,8
5,7
5,7
5,5
5,3
5,0
5,0
4,8
4,3
COUnTRy
Costa Rica
Germany
Poland
Slovak Republic
Kazakhstan
Russia
Romania
Belarus
Hungary
Moldova
Bulgaria
Ukraine
South Africa
Armenia
Nigeria
Georgia
�
�
�
�
�
�
�
�
�
�
�
�
�
�
�
�
KONRaD-aDeNaUeR-sTIfTUNG
aUslaNDsbURO UKRaINe
Shovkovychna vul., 10/4 01021 Kiev
Ukraine
phone: +380 44 492-74-43 fax: +380 44 253-75-04
e-mail: [email protected]