Embed Size (px)
Citation preview

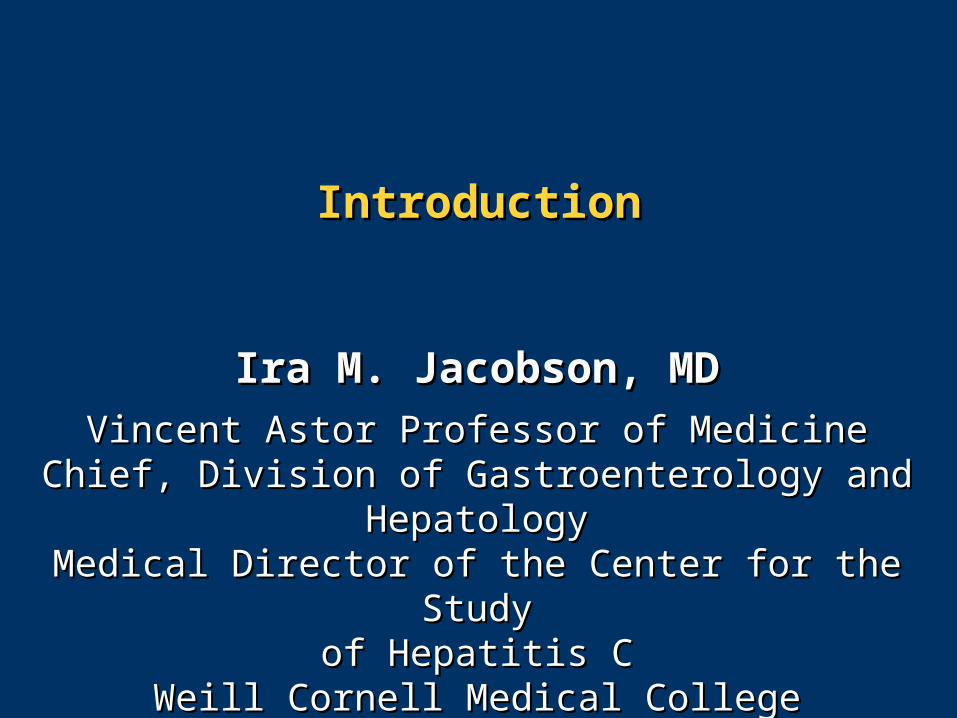
IntroductionIntroduction
Ira M. Jacobson, MDIra M. Jacobson, MD
Vincent Astor Professor of MedicineVincent Astor Professor of MedicineChief, Division of Gastroenterology and HepatologyChief, Division of Gastroenterology and Hepatology
Medical Director of the Center for the StudyMedical Director of the Center for the Studyof Hepatitis Cof Hepatitis C
Weill Cornell Medical CollegeWeill Cornell Medical CollegeNew York, New YorkNew York, New York
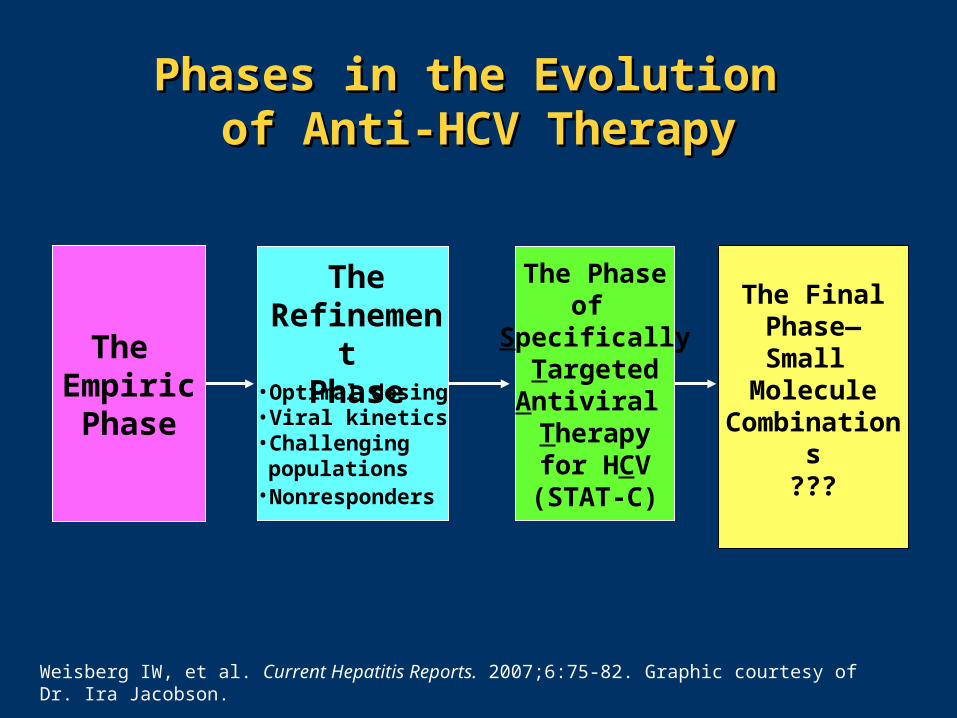
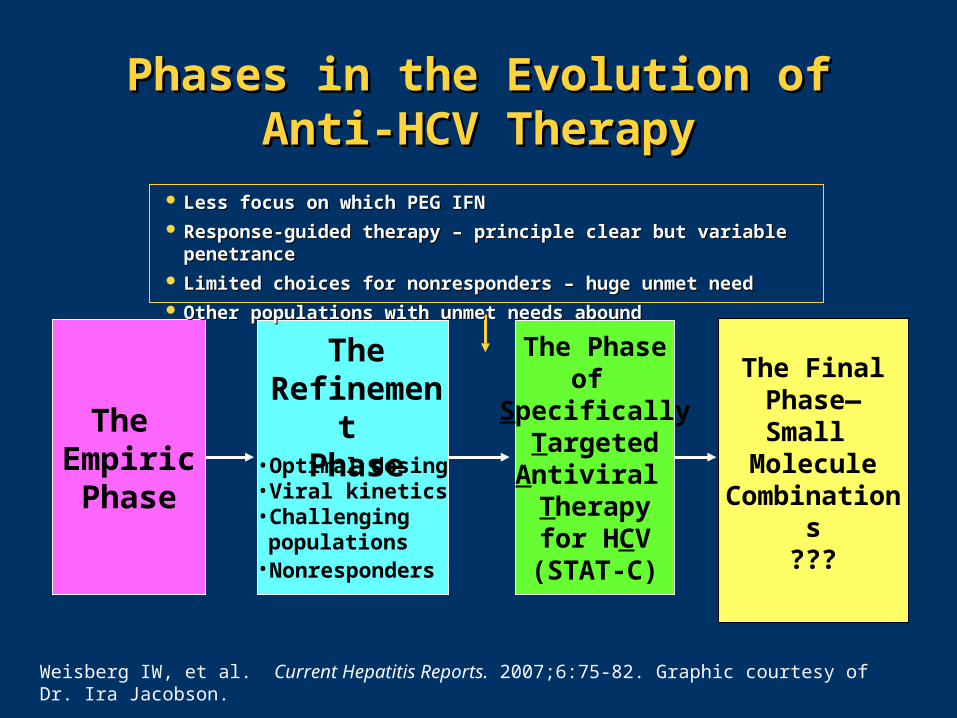
Phases in the Evolution Phases in the Evolution of Anti-HCV Therapyof Anti-HCV Therapy
Weisberg IW, et al. Current Hepatitis Reports. 2007;6:75-82. Graphic courtesy of Dr. Ira Jacobson.
The EmpiricPhase
The Phaseof
SpecificallyTargetedAntiviral Therapyfor HCV
(STAT-C)
The Final Phase—Small
MoleculeCombinations
???
• Optimal dosing• Viral kinetics• Challengingpopulations
• Nonresponders
TheRefinement
Phase
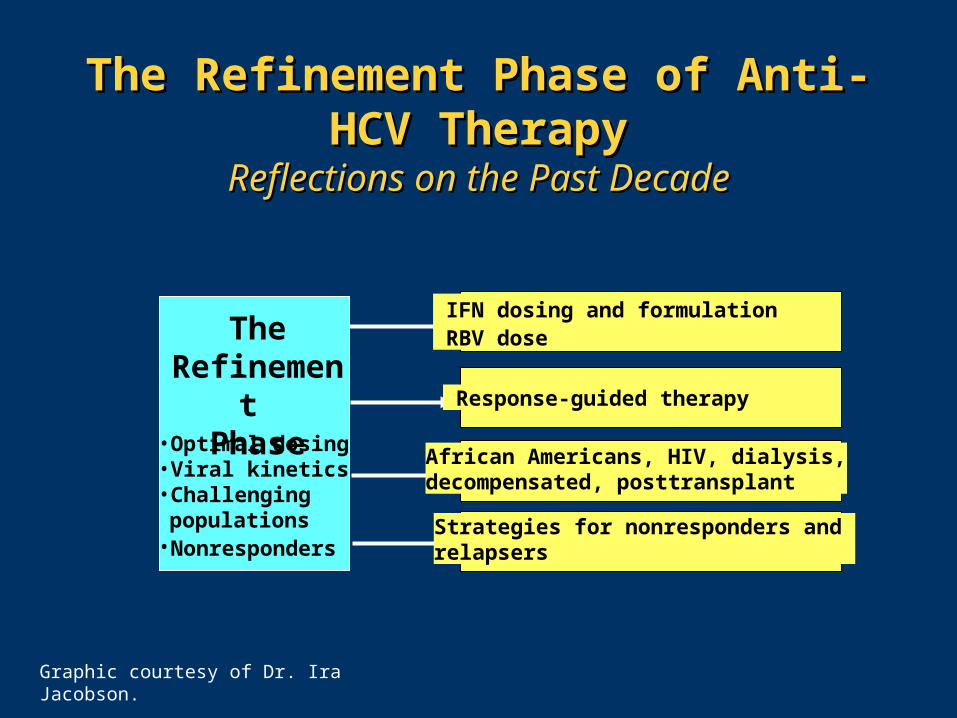
The Refinement Phase of Anti-HCV The Refinement Phase of Anti-HCV TherapyTherapy
Reflections on the Past DecadeReflections on the Past Decade
• Optimal dosing• Viral kinetics• Challengingpopulations
• Nonresponders
TheRefinement
Phase
IFN dosing and formulation RBV dose
Response-guided therapy
African Americans, HIV, dialysis,decompensated, posttransplant
Strategies for nonresponders and relapsers
Graphic courtesy of Dr. Ira Jacobson.
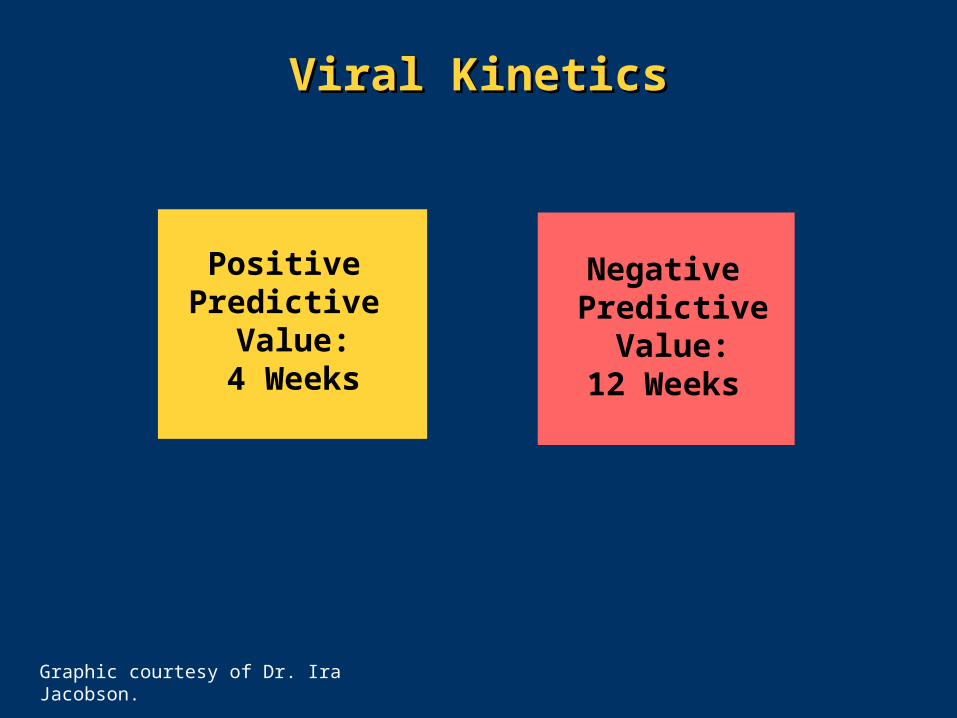
Viral KineticsViral Kinetics
Negative Predictive
Value:12 Weeks
Positive Predictive
Value:4 Weeks
Graphic courtesy of Dr. Ira Jacobson.
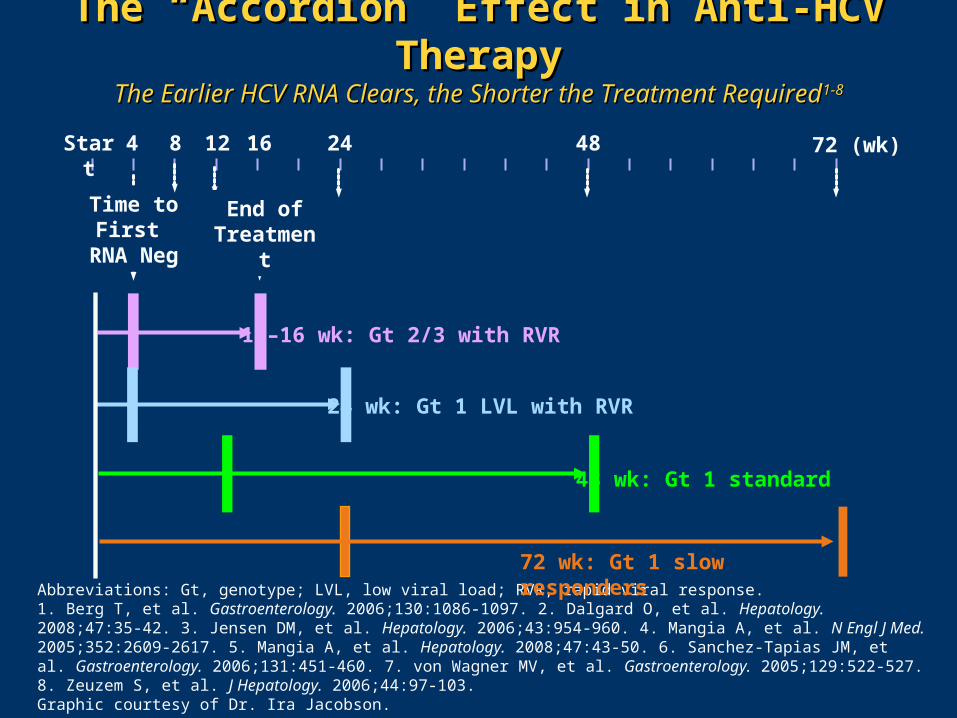
The “Accordion” Effect in Anti-HCV TherapyThe “Accordion” Effect in Anti-HCV TherapyThe Earlier HCV RNA Clears, the Shorter the Treatment RequiredThe Earlier HCV RNA Clears, the Shorter the Treatment Required1-81-8
Abbreviations: Gt, genotype; LVL, low viral load; RVR, rapid viral response.1. Berg T, et al. Gastroenterology. 2006;130:1086-1097. 2. Dalgard O, et al. Hepatology. 2008;47:35-42. 3. Jensen DM, et al. Hepatology. 2006;43:954-960. 4. Mangia A, et al. N Engl J Med. 2005;352:2609-2617. 5. Mangia A, et al. Hepatology. 2008;47:43-50. 6. Sanchez-Tapias JM, et al. Gastroenterology. 2006;131:451-460. 7. von Wagner MV, et al. Gastroenterology. 2005;129:522-527. 8. Zeuzem S, et al. J Hepatology. 2006;44:97-103. Graphic courtesy of Dr. Ira Jacobson.
72 wk: Gt 1 slow responders
48 wk: Gt 1 standard
12–16 wk: Gt 2/3 with RVR
24 wk: Gt 1 LVL with RVR
72 (wk)4 24 48128Start
Time to First
RNA Neg
16
End of Treatment
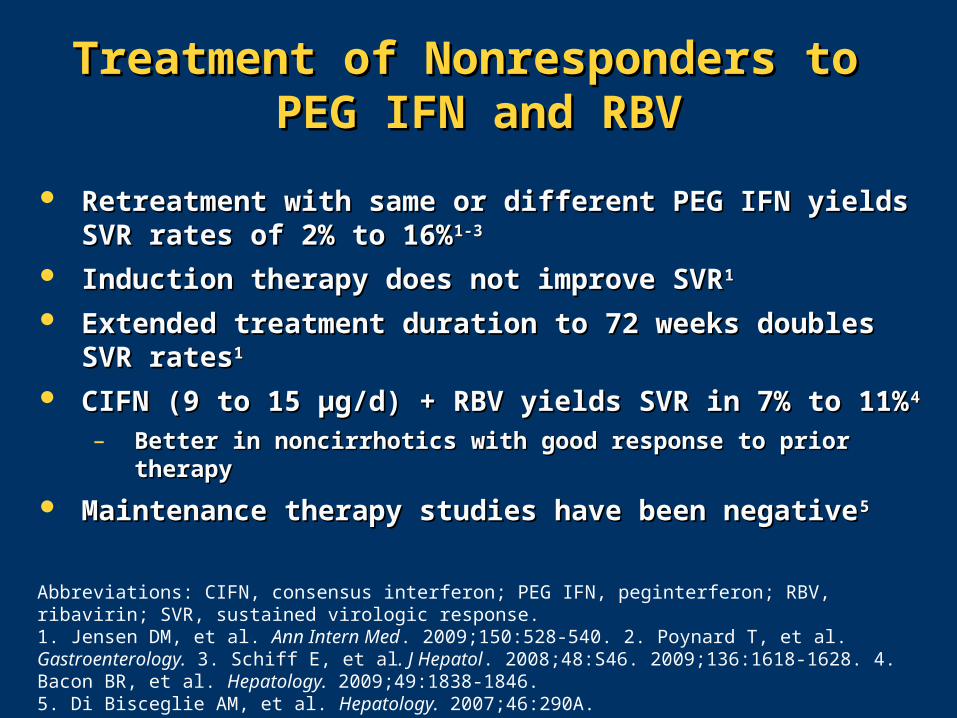
Treatment of Nonresponders to Treatment of Nonresponders to PEG IFN and RBVPEG IFN and RBV
Retreatment with same or different PEG IFN yields Retreatment with same or different PEG IFN yields SVR rates of 2% to 16%SVR rates of 2% to 16%1-31-3
Induction therapy does not improve SVRInduction therapy does not improve SVR11
Extended treatment duration to 72 weeks doubles SVR Extended treatment duration to 72 weeks doubles SVR ratesrates11
CIFN (9 to 15 µg/d) + RBV yields SVR in 7% to 11%CIFN (9 to 15 µg/d) + RBV yields SVR in 7% to 11%44
– Better in noncirrhotics with good response to prior therapyBetter in noncirrhotics with good response to prior therapy
Maintenance therapy studies have been negativeMaintenance therapy studies have been negative55
Abbreviations: CIFN, consensus interferon; PEG IFN, peginterferon; RBV, ribavirin; SVR, sustained virologic response.1. Jensen DM, et al. Ann Intern Med. 2009;150:528-540. 2. Poynard T, et al. Gastroenterology. 3. Schiff E, et al. J Hepatol. 2008;48:S46. 2009;136:1618-1628. 4. Bacon BR, et al. Hepatology. 2009;49:1838-1846. 5. Di Bisceglie AM, et al. Hepatology. 2007;46:290A.
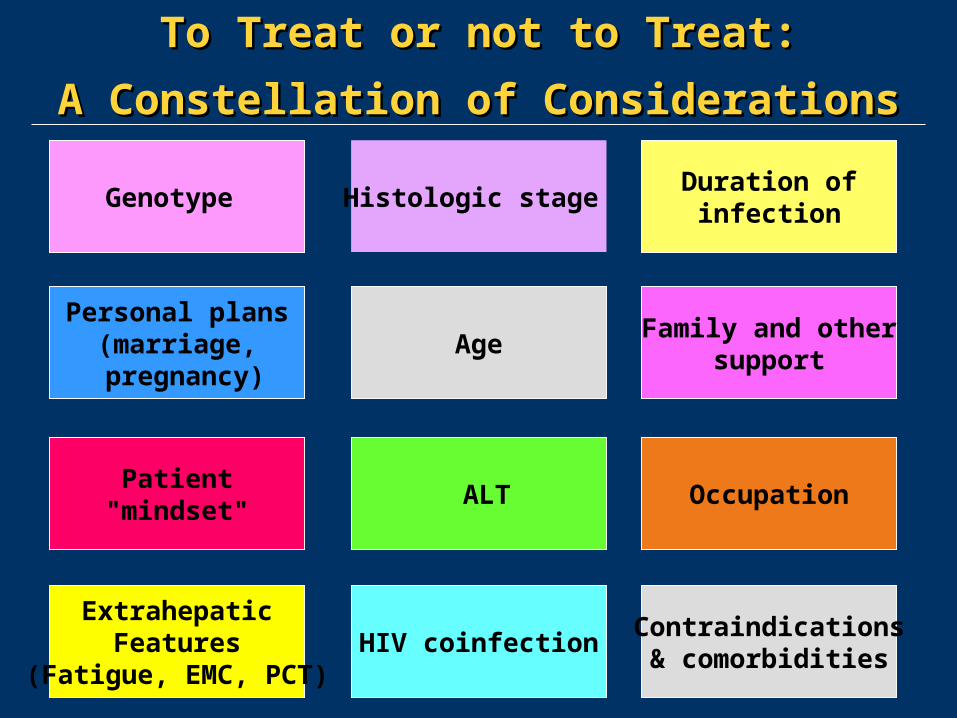
To Treat or not to Treat:To Treat or not to Treat:
A Constellation of ConsiderationsA Constellation of Considerations
Duration ofinfection
Personal plans(marriage,
pregnancy)Age
ALT
HIV coinfectionExtrahepatic
Features(Fatigue, EMC, PCT)
Patient"mindset"
Genotype
Contraindications& comorbidities
Histologic stage
Family and othersupport
Occupation
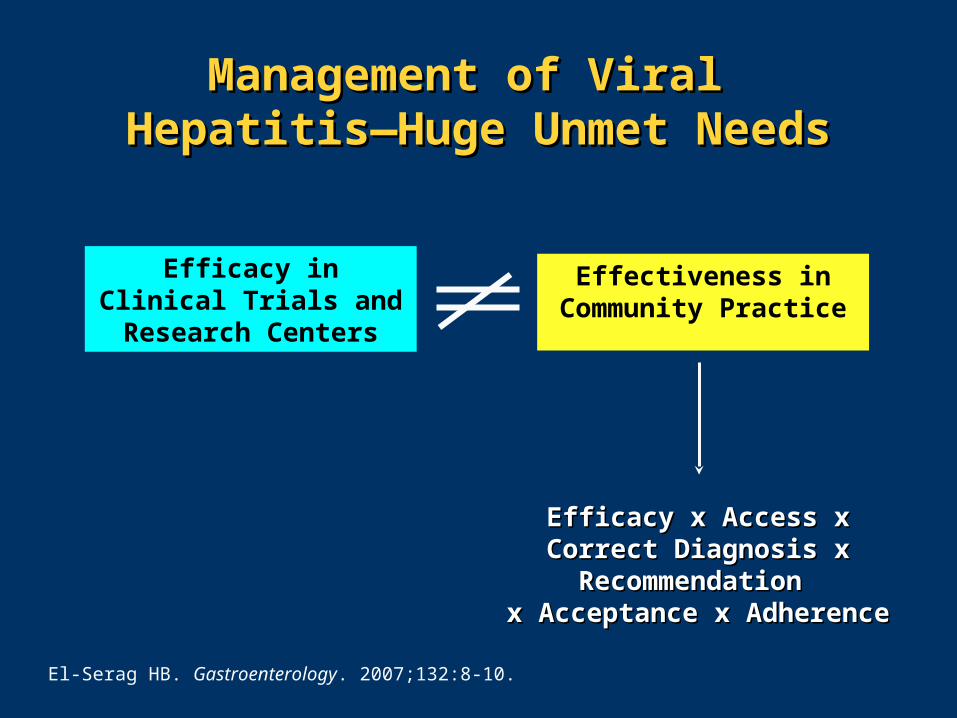
Management of Viral Management of Viral HepatitisHepatitis—H—Huge Unmet Needsuge Unmet Needs
Efficacy x Access x Correct Efficacy x Access x Correct Diagnosis x Recommendation Diagnosis x Recommendation
x Acceptance x Adherencex Acceptance x Adherence
El-Serag HB. Gastroenterology. 2007;132:8-10.
Efficacy in Clinical Trials and Research
Centers
Effectiveness in Community Practice
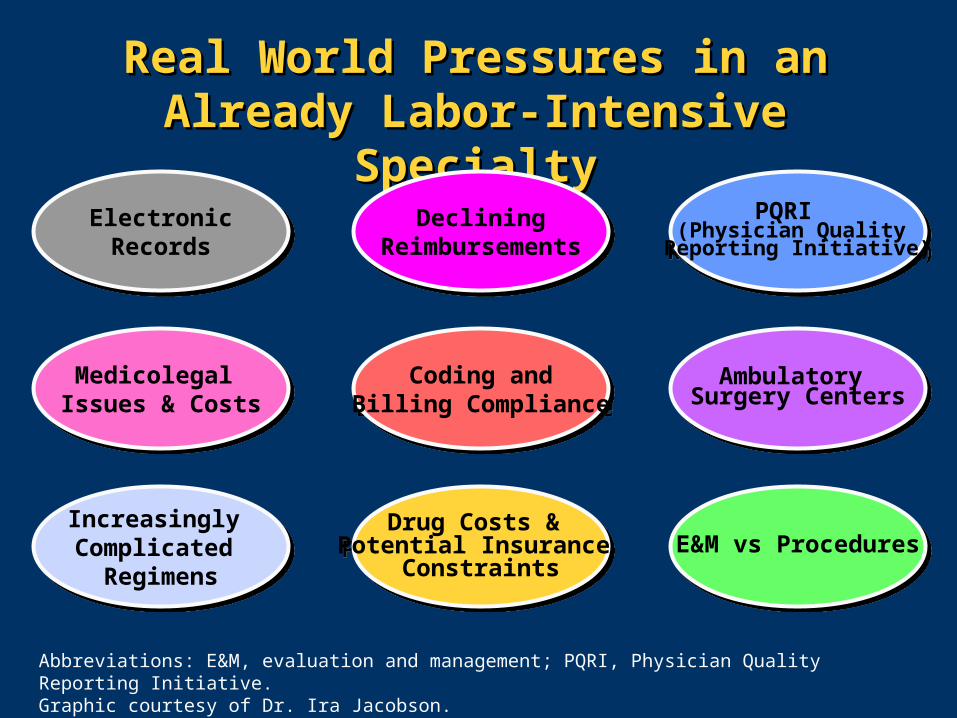
Real World Pressures in an Already Real World Pressures in an Already Labor-Intensive SpecialtyLabor-Intensive Specialty
Abbreviations: E&M, evaluation and management; PQRI, Physician Quality Reporting Initiative.Graphic courtesy of Dr. Ira Jacobson.
E&M vs ProceduresE&M vs Procedures
ElectronicRecords
ElectronicRecords
Increasingly Complicated
Regimens
Increasingly Complicated
Regimens
Coding andBilling Compliance
Coding andBilling Compliance
Medicolegal Issues & CostsMedicolegal
Issues & Costs
PQRI (Physician Quality Reporting Initiative)
PQRI (Physician Quality Reporting Initiative)
Drug Costs & Potential Insurance
Constraints
Drug Costs & Potential Insurance
Constraints
DecliningReimbursements
DecliningReimbursements
Ambulatory Surgery Centers
Ambulatory Surgery Centers


A Day in the Life of a A Day in the Life of a Hepatology PracticeHepatology Practice
…in the Future…in the Future
Rosemarie Nelson, MSRosemarie Nelson, MS
PrincipalPrincipalMGMA Health Care Consulting GroupMGMA Health Care Consulting Group
Englewood, ColoradoEnglewood, Colorado
13
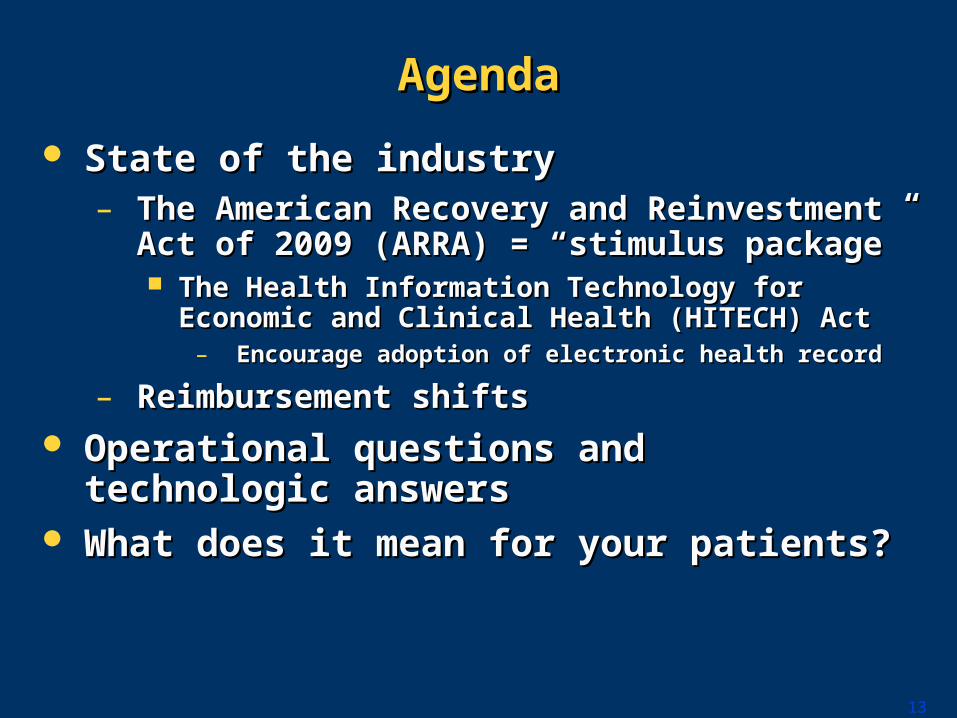
AgendaAgenda
State of the industryState of the industry– The American Recovery and Reinvestment The American Recovery and Reinvestment
Act of 2009 (ARRA) = “stimulus package”Act of 2009 (ARRA) = “stimulus package” The Health Information Technology for The Health Information Technology for
Economic and Clinical Health (HITECH) ActEconomic and Clinical Health (HITECH) Act– Encourage adoption of electronic health recordEncourage adoption of electronic health record
– Reimbursement shiftsReimbursement shifts
Operational questions and technologic Operational questions and technologic answersanswers
What does it mean for your patients?What does it mean for your patients?
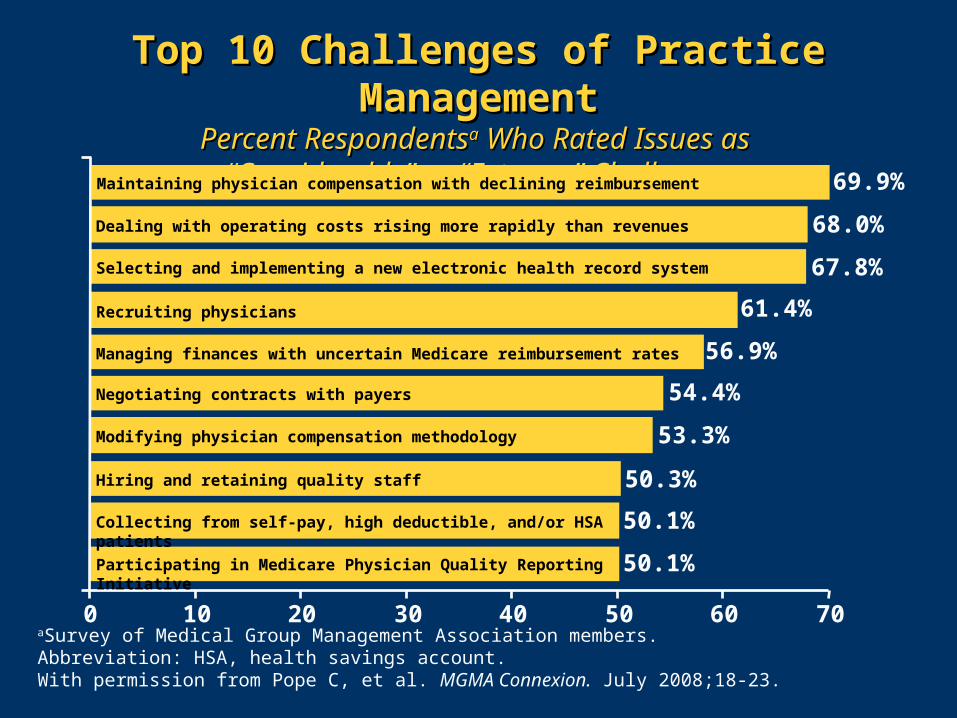
50.1%
50.1%
50.3%
53.3%
54.4%
56.9%
61.4%
67.8%
68.0%
69.9%
0 20 30 40 50 60 70
Top 10 Challenges of Practice ManagementTop 10 Challenges of Practice ManagementPercent RespondentsPercent Respondentsaa Who Rated Issues as Who Rated Issues as
“Considerable” or “Extreme” Challenges“Considerable” or “Extreme” Challenges
Maintaining physician compensation with declining reimbursement
Dealing with operating costs rising more rapidly than revenues
Selecting and implementing a new electronic health record system
Recruiting physicians
Managing finances with uncertain Medicare reimbursement rates
Negotiating contracts with payers
Modifying physician compensation methodology
Hiring and retaining quality staff
Collecting from self-pay, high deductible, and/or HSA patients
Participating in Medicare Physician Quality Reporting Initiative
aSurvey of Medical Group Management Association members.Abbreviation: HSA, health savings account.With permission from Pope C, et al. MGMA Connexion. July 2008;18-23.
10
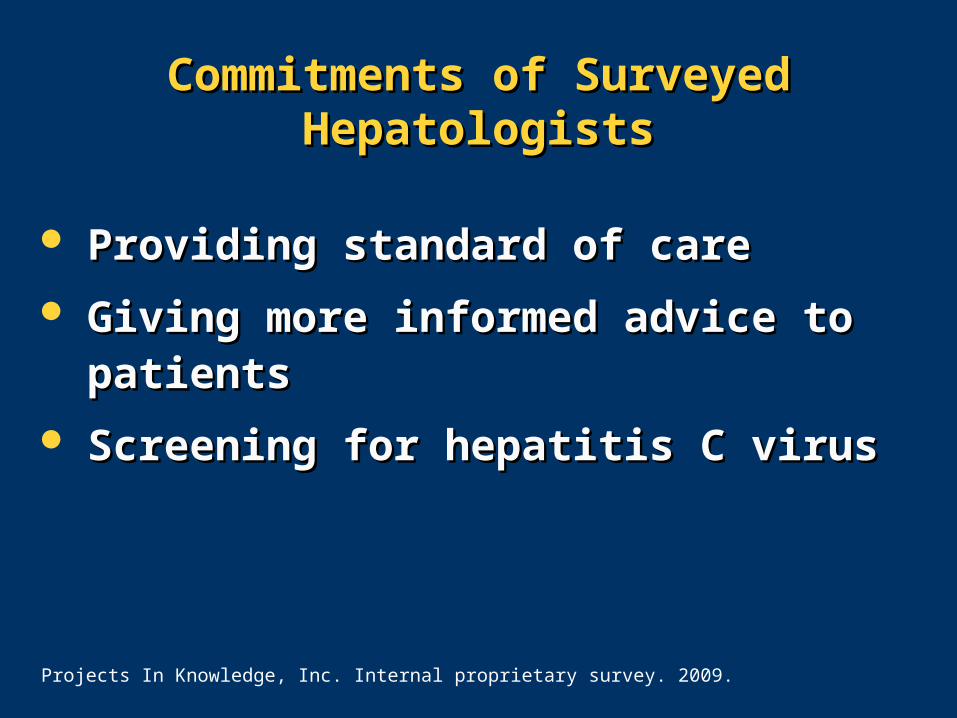
Providing standard of careProviding standard of care
Giving more informed advice to patientsGiving more informed advice to patients
Screening for hepatitis C virusScreening for hepatitis C virus
Commitments of Surveyed Commitments of Surveyed HepatologistsHepatologists
Projects In Knowledge, Inc. Internal proprietary survey. 2009.
16
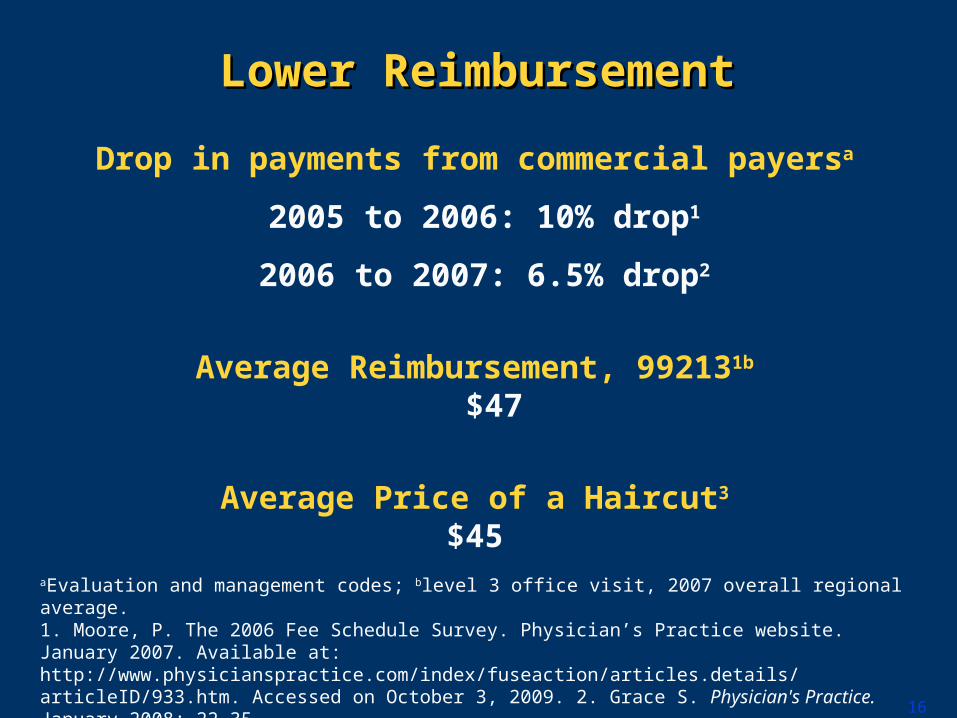
aEvaluation and management codes; blevel 3 office visit, 2007 overall regional average.1. Moore, P. The 2006 Fee Schedule Survey. Physician’s Practice website. January 2007. Available at: http://www.physicianspractice.com/index/fuseaction/articles.details/articleID/933.htm. Accessed on October 3, 2009. 2. Grace S. Physician's Practice. January 2008; 22-35. 3. Nelson R. Phone interview with Professional Beauty Association, November 2008.
Lower ReimbursementLower Reimbursement
Drop in payments from commercial payersa
2005 to 2006: 10% drop1
2006 to 2007: 6.5% drop2
Average Reimbursement, 992131b
$47
Average Price of a Haircut3
$45
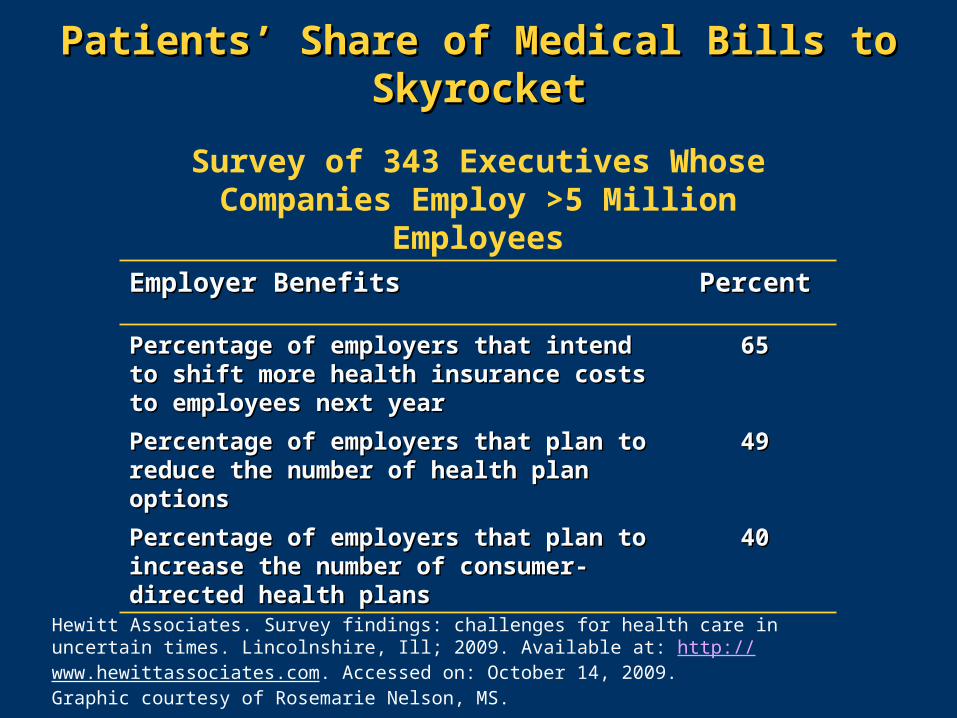
Survey of 343 Executives Whose Companies Employ >5 Million Employees
Employer BenefitsEmployer Benefits PercentPercent
Percentage of employers that intend to shift Percentage of employers that intend to shift more health insurance costs to employees more health insurance costs to employees next yearnext year
6565
Percentage of employers that plan to reduce Percentage of employers that plan to reduce the number of health plan optionsthe number of health plan options
4949
Percentage of employers that plan to increase Percentage of employers that plan to increase the number of consumer-directed health plansthe number of consumer-directed health plans
4040
Patients’ Share of Medical Bills to SkyrocketPatients’ Share of Medical Bills to Skyrocket
Hewitt Associates. Survey findings: challenges for health care in uncertain times. Lincolnshire, Ill; 2009. Available at: http://www.hewittassociates.com. Accessed on: October 14, 2009. Graphic courtesy of Rosemarie Nelson, MS.
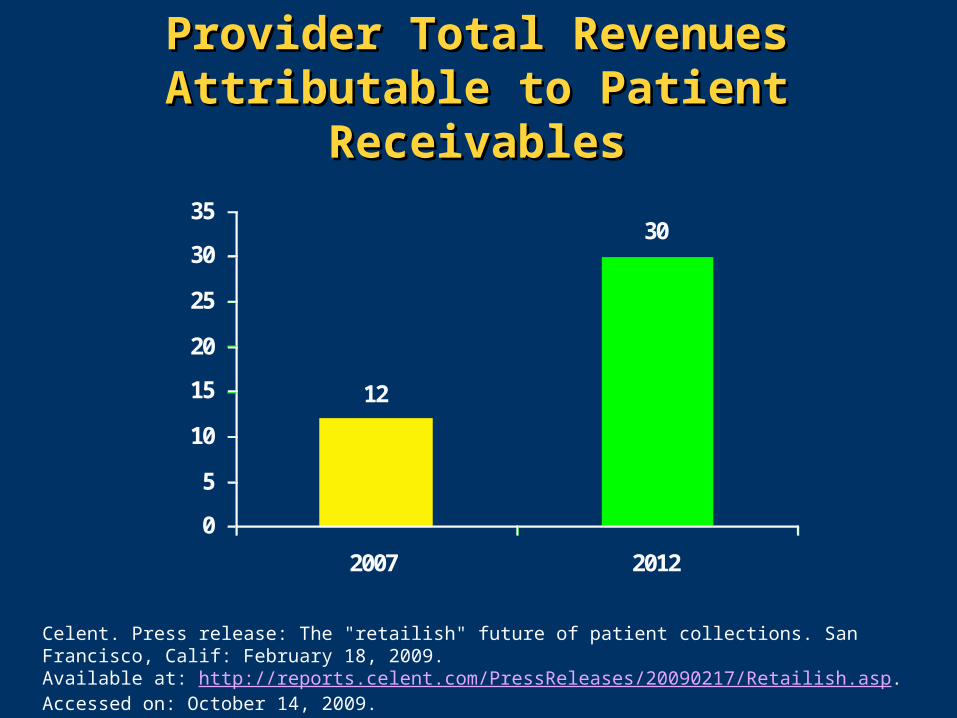
Provider Total Revenues Attributable to Provider Total Revenues Attributable to Patient ReceivablesPatient Receivables
12
30
0
5
10
15
20
25
30
35
2007 2012% Revenue Attributable to Patient
Receivables
Celent. Press release: The "retailish" future of patient collections. San Francisco, Calif: February 18, 2009.Available at: http://reports.celent.com/PressReleases/20090217/Retailish.asp. Accessed on: October 14, 2009.
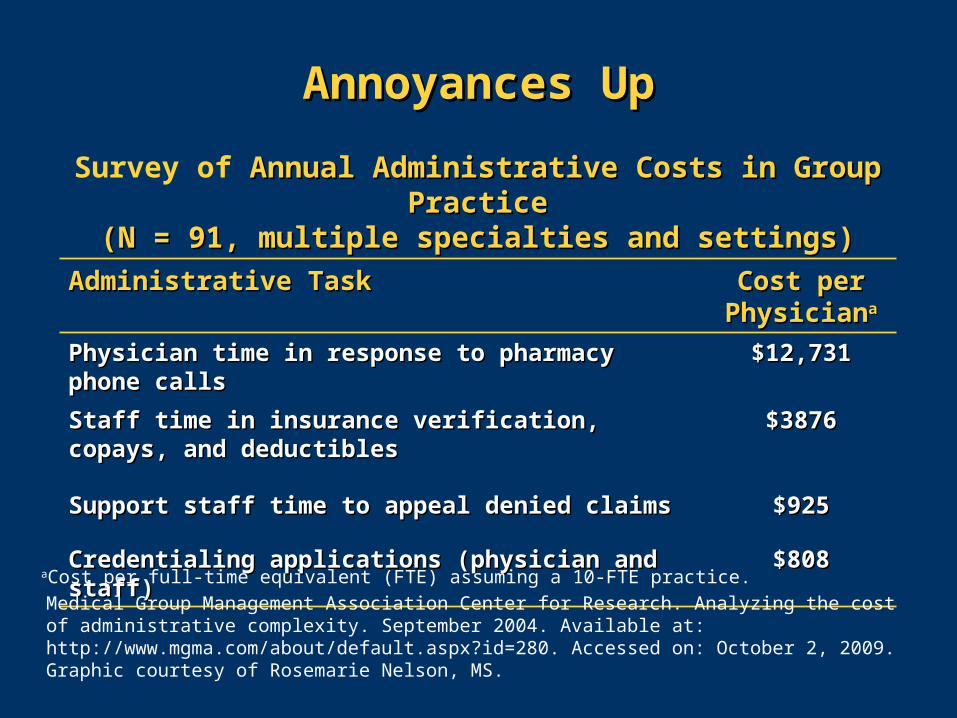
Annoyances UpAnnoyances Up
Survey of Annual Administrative Costs in Group PracticeAnnual Administrative Costs in Group Practice(N = 91, multiple specialties and settings)(N = 91, multiple specialties and settings)
Administrative TaskAdministrative Task Cost per Cost per PhysicianPhysicianaa
Physician time in response to pharmacy phone callsPhysician time in response to pharmacy phone calls $12,731$12,731
Staff time in insurance verification, copays, and Staff time in insurance verification, copays, and deductiblesdeductibles
$3876$3876
Support staff time to appeal denied claimsSupport staff time to appeal denied claims $925$925
Credentialing applications (physician and staff)Credentialing applications (physician and staff) $808$808
Medical Group Management Association Center for Research. Analyzing the cost of administrative complexity. September 2004. Available at: http://www.mgma.com/about/default.aspx?id=280. Accessed on: October 2, 2009. Graphic courtesy of Rosemarie Nelson, MS.
aCost per full-time equivalent (FTE) assuming a 10-FTE practice.
Casalino LP, et al. Health Affairs. 2009;28:533-543.
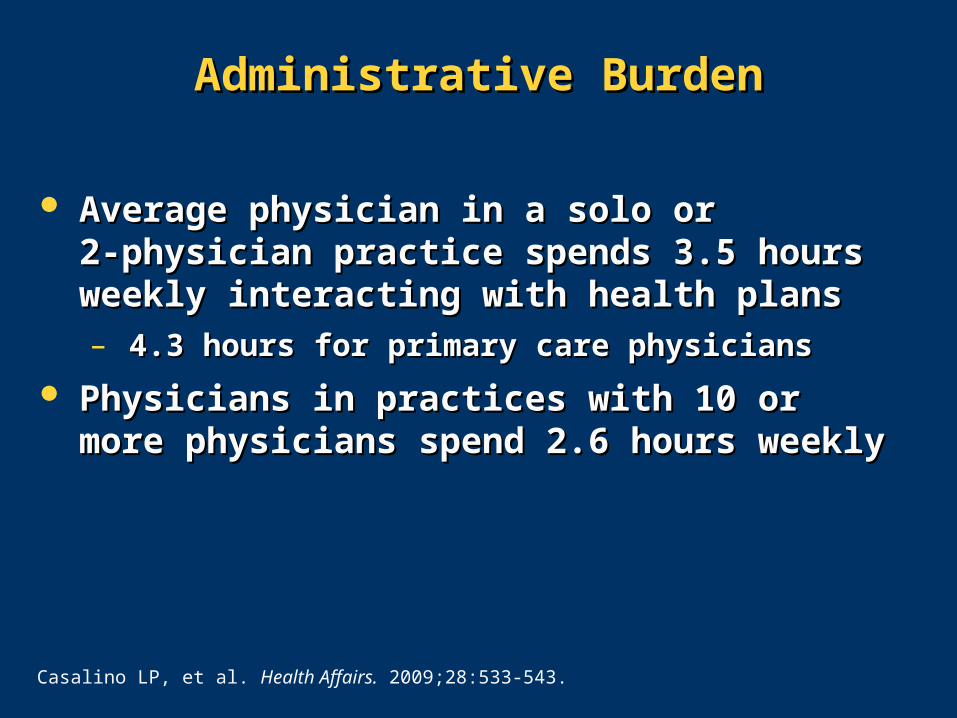
Administrative BurdenAdministrative Burden
Average physician in a solo or Average physician in a solo or 2-physician practice spends 3.5 hours 2-physician practice spends 3.5 hours weekly interacting with health plansweekly interacting with health plans– 4.3 hours for primary care physicians4.3 hours for primary care physicians
Physicians in practices with 10 or more Physicians in practices with 10 or more physicians spend 2.6 hours weeklyphysicians spend 2.6 hours weekly
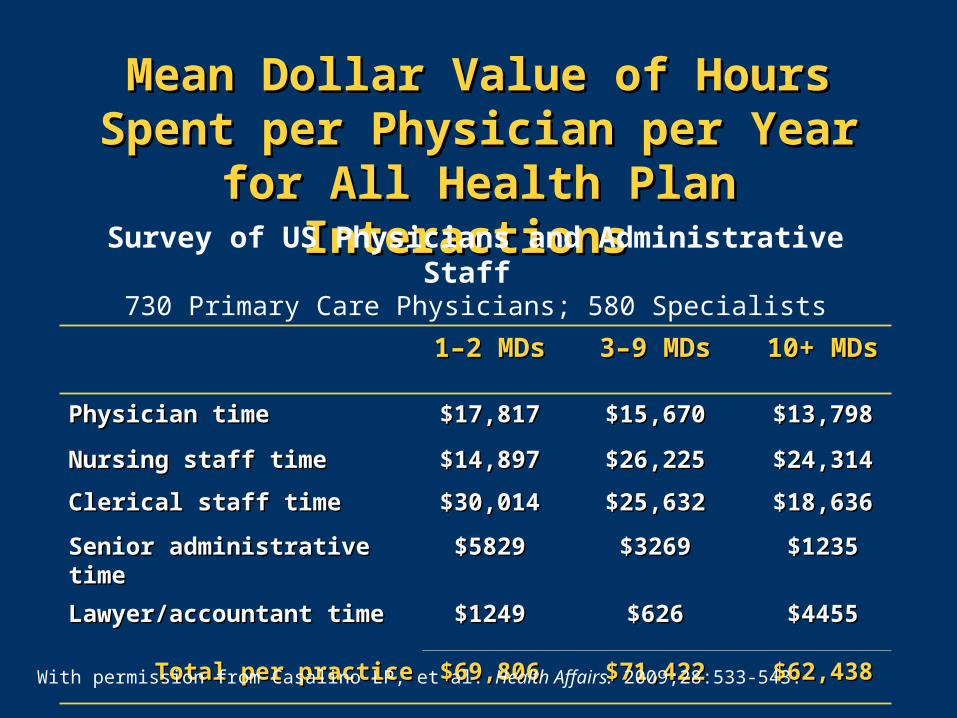
Mean Dollar Value of Hours Spent per Mean Dollar Value of Hours Spent per Physician per Year for All Health Plan Physician per Year for All Health Plan
Interactions Interactions Survey of US Physicians and Administrative Staff
730 Primary Care Physicians; 580 Specialists
1–2 MDs1–2 MDs 3–9 MDs3–9 MDs 10+ MDs10+ MDs
Physician timePhysician time $17,817$17,817 $15,670$15,670 $13,798$13,798
Nursing staff timeNursing staff time $14,897$14,897 $26,225$26,225 $24,314$24,314
Clerical staff timeClerical staff time $30,014$30,014 $25,632$25,632 $18,636$18,636
Senior administrative timeSenior administrative time $5829$5829 $3269$3269 $1235$1235
Lawyer/accountant timeLawyer/accountant time $1249$1249 $626$626 $4455$4455
Total per practiceTotal per practice $69,806$69,806 $71,422$71,422 $62,438$62,438
With permission from Casalino LP, et al. Health Affairs. 2009;28:533-543.
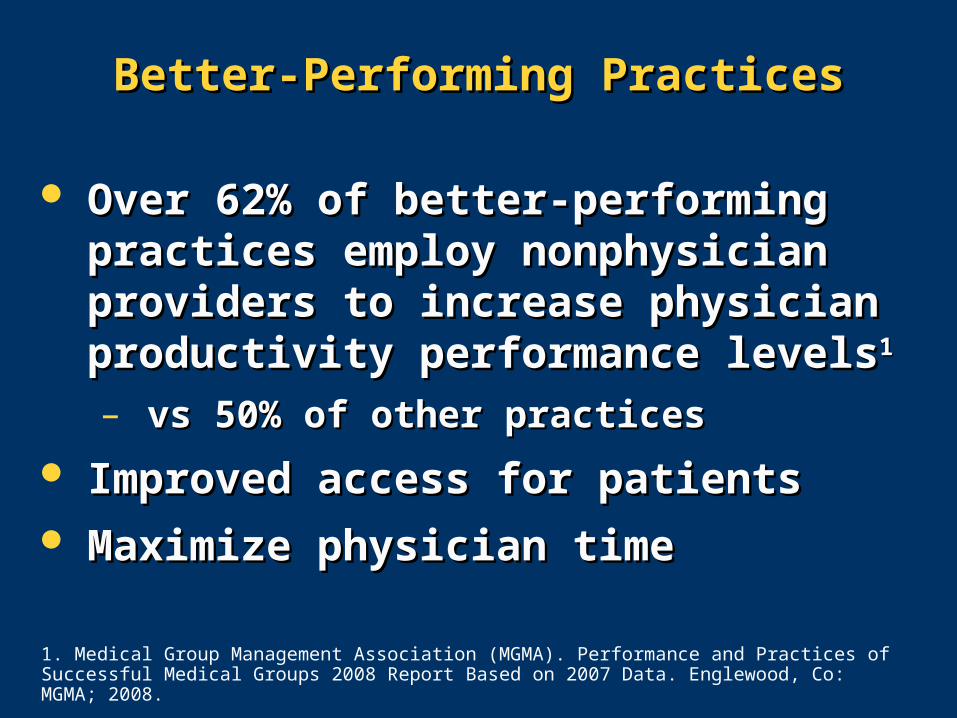
Better-Performing PracticesBetter-Performing Practices
Over 62% of better-performing practices Over 62% of better-performing practices employ nonphysician providers to employ nonphysician providers to increase physician productivity increase physician productivity performance levelsperformance levels11
– vs 50% of other practicesvs 50% of other practices
Improved access for patientsImproved access for patients Maximize physician timeMaximize physician time
1. Medical Group Management Association (MGMA). Performance and Practices of Successful Medical Groups 2008 Report Based on 2007 Data. Englewood, Co: MGMA; 2008.
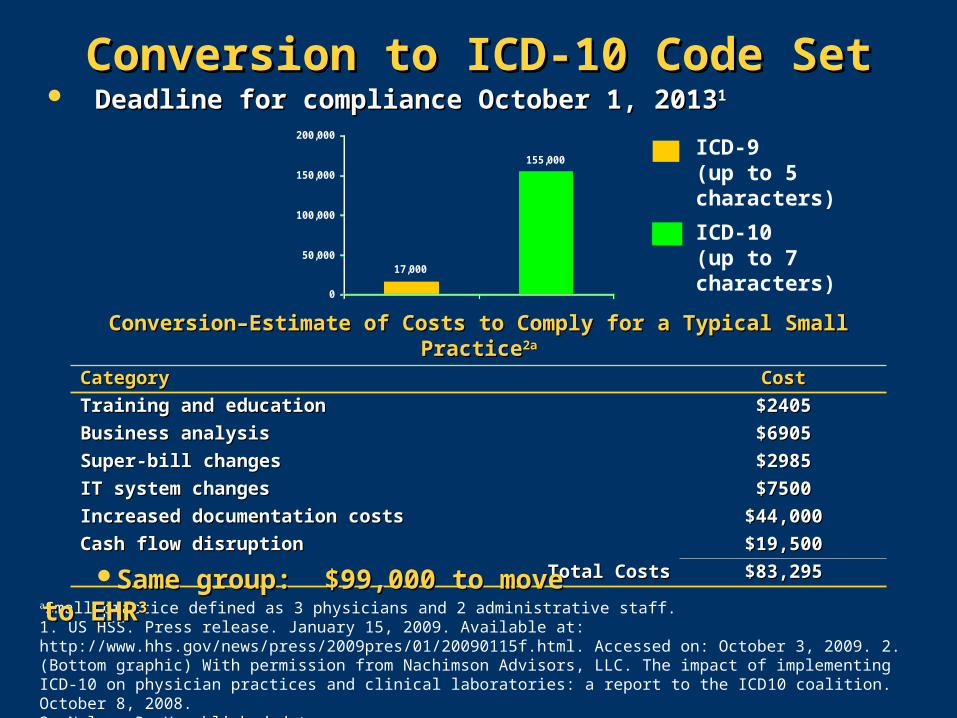
Conversion to ICD-10 Code SetConversion to ICD-10 Code Set Deadline for compliance October 1, 2013Deadline for compliance October 1, 201311
155,000
17,000
0
50,000
100,000
150,000
200,000
Total Diagnostic and Procedure
Codes
ICD-9(up to 5 characters)
ICD-10(up to 7 characters)
aSmall practice defined as 3 physicians and 2 administrative staff.1. US HSS. Press release. January 15, 2009. Available at: http://www.hhs.gov/news/press/2009pres/01/20090115f.html. Accessed on: October 3, 2009. 2. (Bottom graphic) With permission from Nachimson Advisors, LLC. The impact of implementing ICD‐10 on physician practices and clinical laboratories: a report to the ICD 10 coalition. October 8, 2008.3. Nelson R. Unpublished data.
Conversion–Estimate of Costs to Comply for a Typical Small PracticeConversion–Estimate of Costs to Comply for a Typical Small Practice2a2a
CategoryCategory CostCost
Training and educationTraining and education $2405$2405
Business analysis Business analysis $6905$6905
Super-bill changesSuper-bill changes $2985$2985
IT system changesIT system changes $7500$7500
Increased documentation costsIncreased documentation costs $44,000$44,000
Cash flow disruptionCash flow disruption $19,500$19,500
Total CostsTotal Costs $83,295$83,295
Same group: $99,000 to move to EHRSame group: $99,000 to move to EHR33
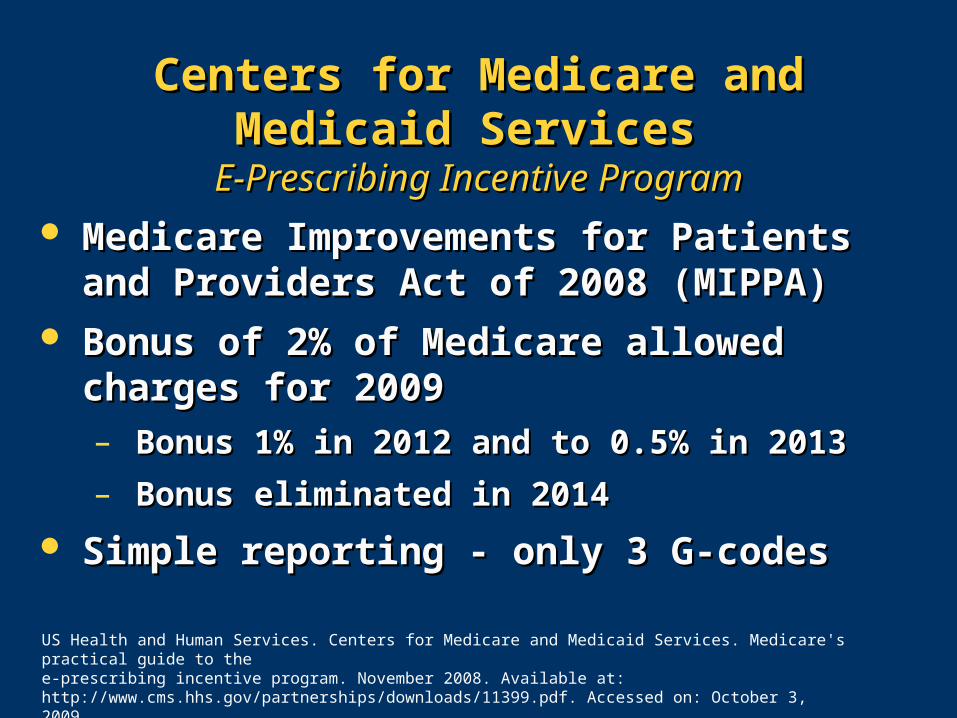
Centers for Medicare and Medicaid Centers for Medicare and Medicaid Services Services
E-Prescribing Incentive ProgramE-Prescribing Incentive Program
Medicare Improvements for Patients Medicare Improvements for Patients and Providers Act of 2008 (MIPPA)and Providers Act of 2008 (MIPPA)
Bonus of 2% of Medicare allowed Bonus of 2% of Medicare allowed charges for 2009charges for 2009– Bonus 1% in 2012 and to 0.5% in 2013Bonus 1% in 2012 and to 0.5% in 2013
– Bonus eliminated in 2014Bonus eliminated in 2014
Simple reporting Simple reporting -- only 3 G-codes only 3 G-codesUS Health and Human Services. Centers for Medicare and Medicaid Services. Medicare's practical guide to the e-prescribing incentive program. November 2008. Available at: http://www.cms.hhs.gov/partnerships/downloads/11399.pdf. Accessed on: October 3, 2009.
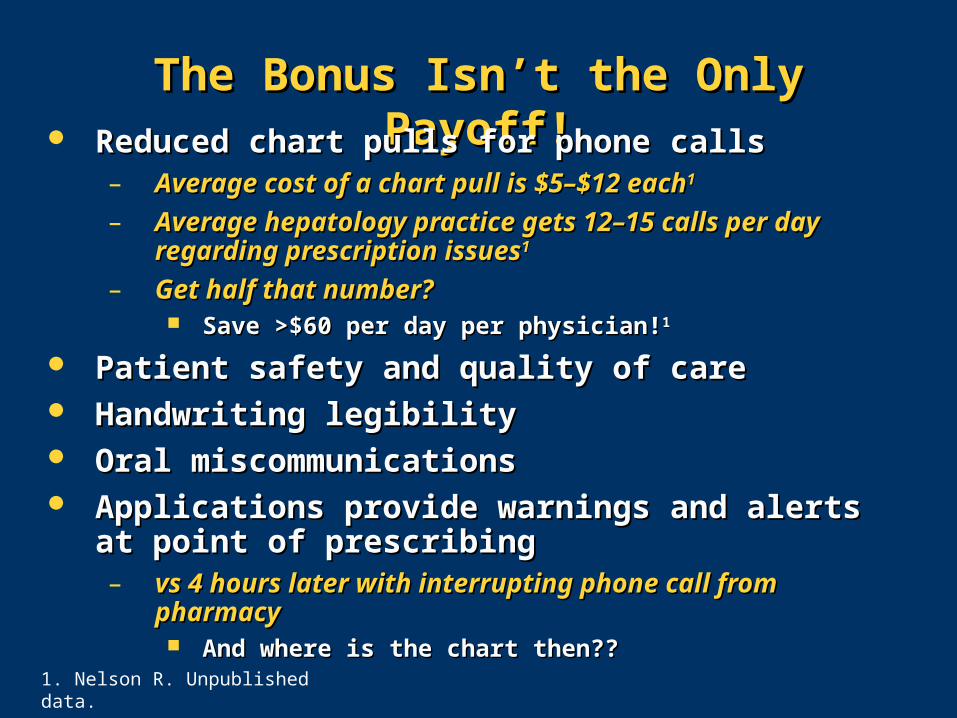
The Bonus Isn’t the Only Payoff!The Bonus Isn’t the Only Payoff! Reduced chart pulls for phone callsReduced chart pulls for phone calls
– Average cost of a chart pull is $5–$12 eachAverage cost of a chart pull is $5–$12 each11
– Average hepatology practice gets 12–15 calls per day Average hepatology practice gets 12–15 calls per day regarding prescription issuesregarding prescription issues11
– Get half that number?Get half that number? Save >$60 per day per physician!Save >$60 per day per physician!11
Patient safety and quality of carePatient safety and quality of care Handwriting legibilityHandwriting legibility Oral miscommunicationsOral miscommunications Applications provide warnings and alerts at point of Applications provide warnings and alerts at point of
prescribingprescribing– vs 4 hours later with interrupting phone call from vs 4 hours later with interrupting phone call from
pharmacypharmacy And where is the chart then??And where is the chart then??
1. Nelson R. Unpublished data.
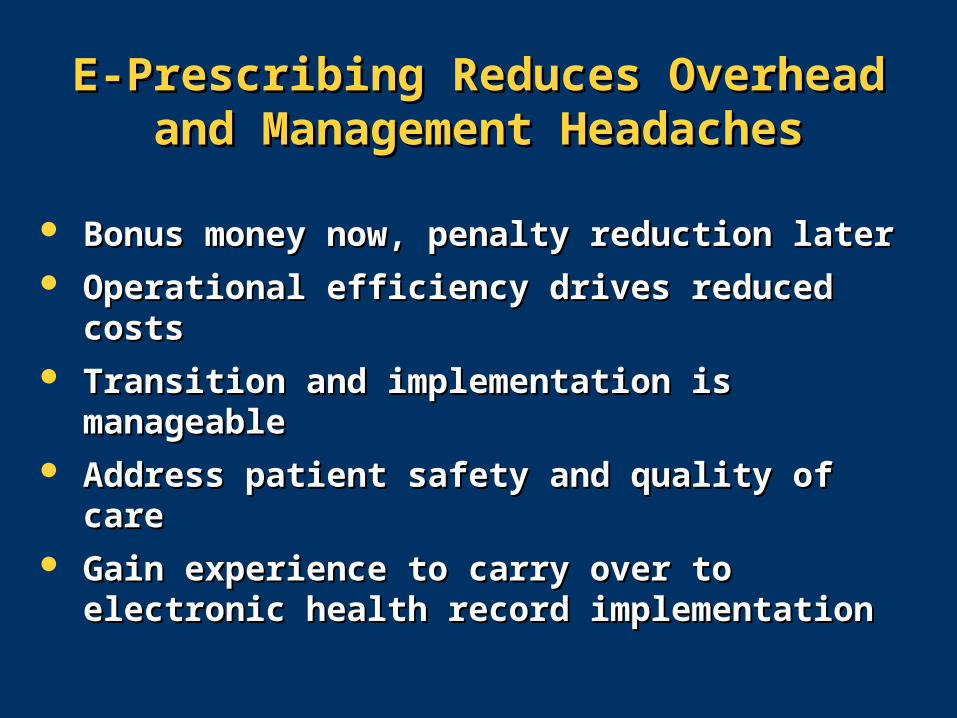
E-Prescribing Reduces Overhead and E-Prescribing Reduces Overhead and Management HeadachesManagement Headaches
Bonus money now, penalty reduction laterBonus money now, penalty reduction later Operational efficiency drives reduced costsOperational efficiency drives reduced costs Transition and implementation is manageableTransition and implementation is manageable Address patient safety and quality of careAddress patient safety and quality of care Gain experience to carry over to electronic Gain experience to carry over to electronic
health record implementationhealth record implementation
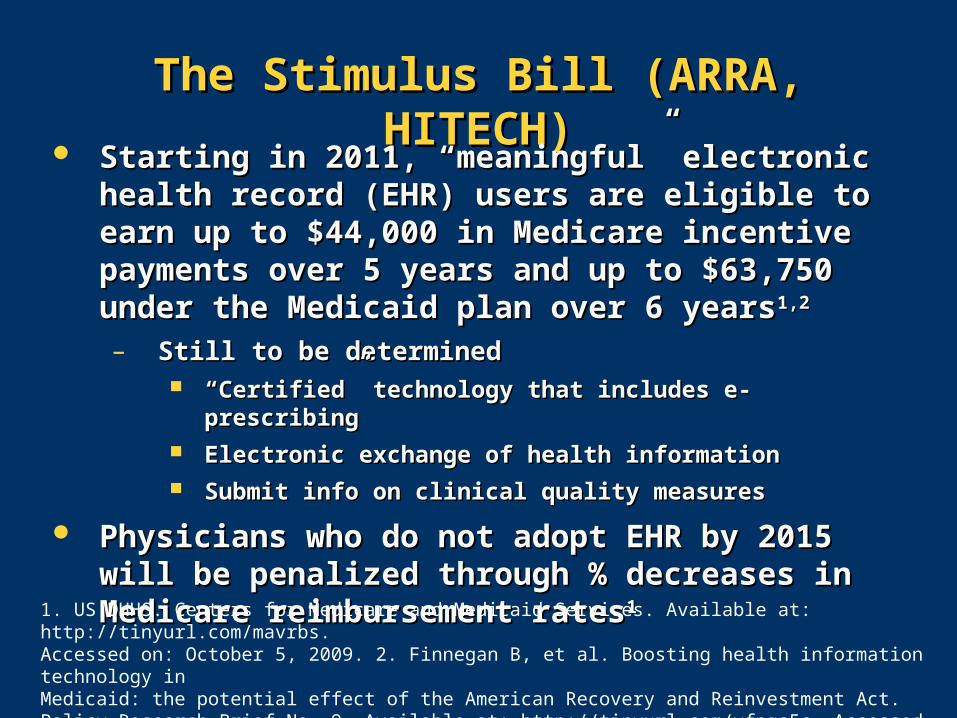
The Stimulus Bill (ARRA, HITECH)The Stimulus Bill (ARRA, HITECH)
Starting in 2011, “meaningful” electronic health Starting in 2011, “meaningful” electronic health record (EHR) users are eligible to earn up to $44,000 record (EHR) users are eligible to earn up to $44,000 in Medicare incentive payments over 5 years and up in Medicare incentive payments over 5 years and up to $63,750 under the Medicaid plan over 6 yearsto $63,750 under the Medicaid plan over 6 years1,21,2
– Still to be determinedStill to be determined ““Certified” technology that includes e-prescribingCertified” technology that includes e-prescribing Electronic exchange of health information Electronic exchange of health information Submit info on clinical quality measuresSubmit info on clinical quality measures
Physicians who do not adopt EHR by 2015 will be Physicians who do not adopt EHR by 2015 will be penalized through % decreases in Medicare penalized through % decreases in Medicare reimbursement ratesreimbursement rates11
1. US DHHS. Centers for Medicare and Medicaid Services. Available at: http://tinyurl.com/mavrbs.Accessed on: October 5, 2009. 2. Finnegan B, et al. Boosting health information technology in Medicaid: the potential effect of the American Recovery and Reinvestment Act. Policy Research Brief No. 9. Available at: http://tinyurl.com/yfpqs5c. Accessed on: October 8, 2009.
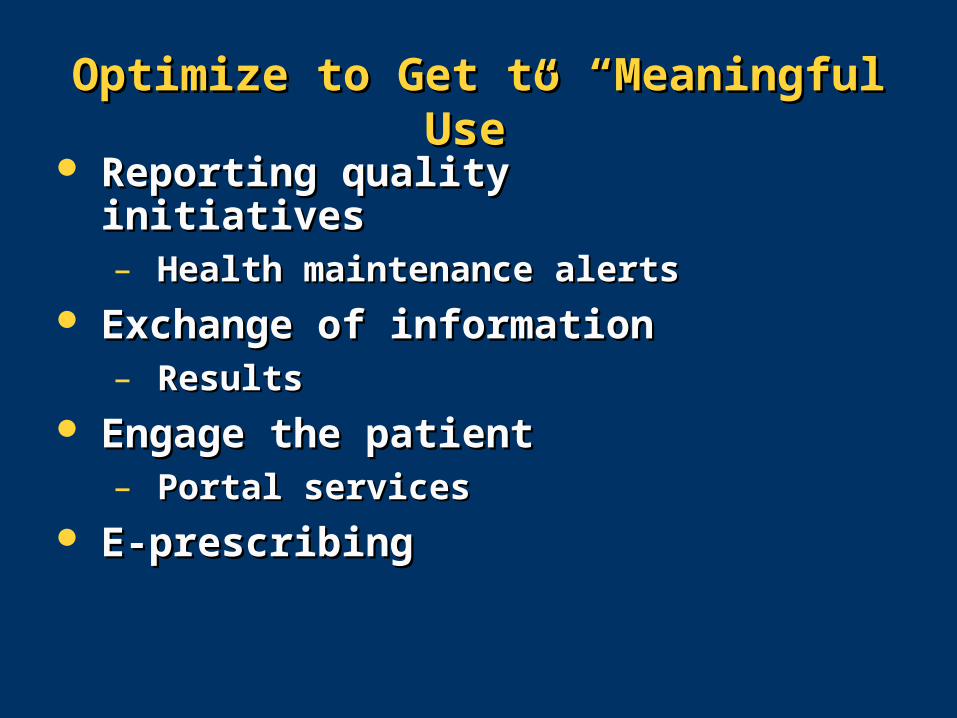
Reporting quality initiativesReporting quality initiatives– Health maintenance alertsHealth maintenance alerts
Exchange of informationExchange of information– ResultsResults
Engage the patientEngage the patient– Portal servicesPortal services
E-prescribingE-prescribing
Optimize to Get to “Meaningful Use”Optimize to Get to “Meaningful Use”

Gather information (past medical, social, Gather information (past medical, social, and family history)and family history)
Manage requestsManage requests– AppointmentsAppointments
– Prescription re-issuesPrescription re-issues
– ““Old” telephone triage questionsOld” telephone triage questions
Deliver lab/test results Deliver lab/test results Generate revenue by recallGenerate revenue by recall
– Follow-up and health maintenance remindersFollow-up and health maintenance reminders
Get nurses off the phones with FAQsGet nurses off the phones with FAQs
Business of Medicine Is Business of Medicine Is Communications–Patient PortalCommunications–Patient Portal
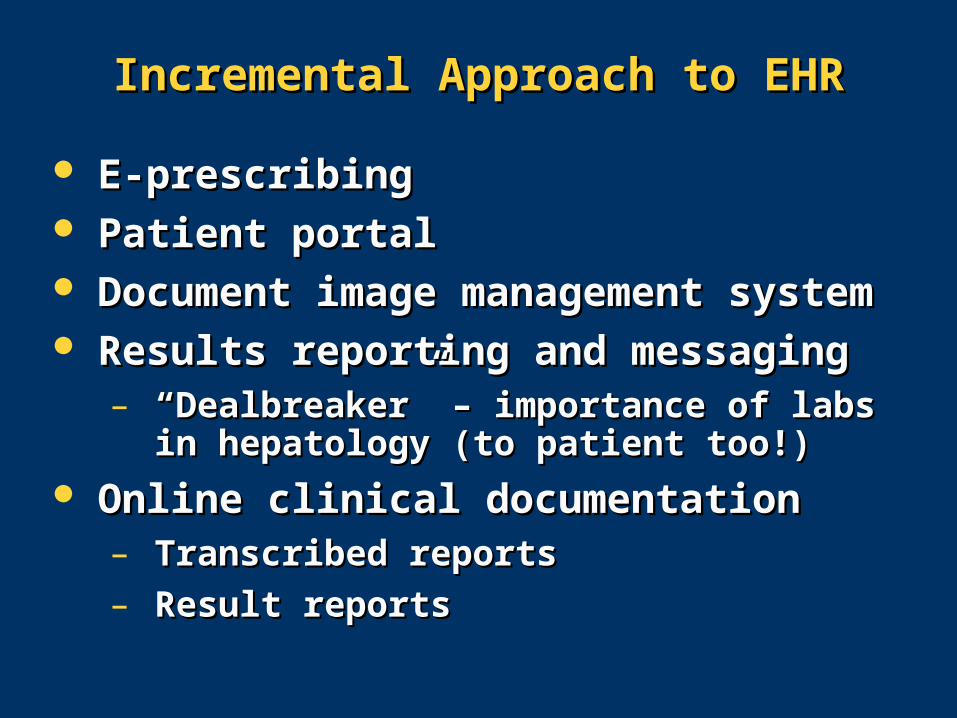
Incremental Approach to EHRIncremental Approach to EHR
E-prescribing E-prescribing Patient portalPatient portal Document image management systemDocument image management system Results reporting and messaging Results reporting and messaging
– ““Dealbreaker” – importance of labs in Dealbreaker” – importance of labs in hepatology (to patient too!)hepatology (to patient too!)
Online clinical documentationOnline clinical documentation– Transcribed reportsTranscribed reports
– Result reportsResult reports
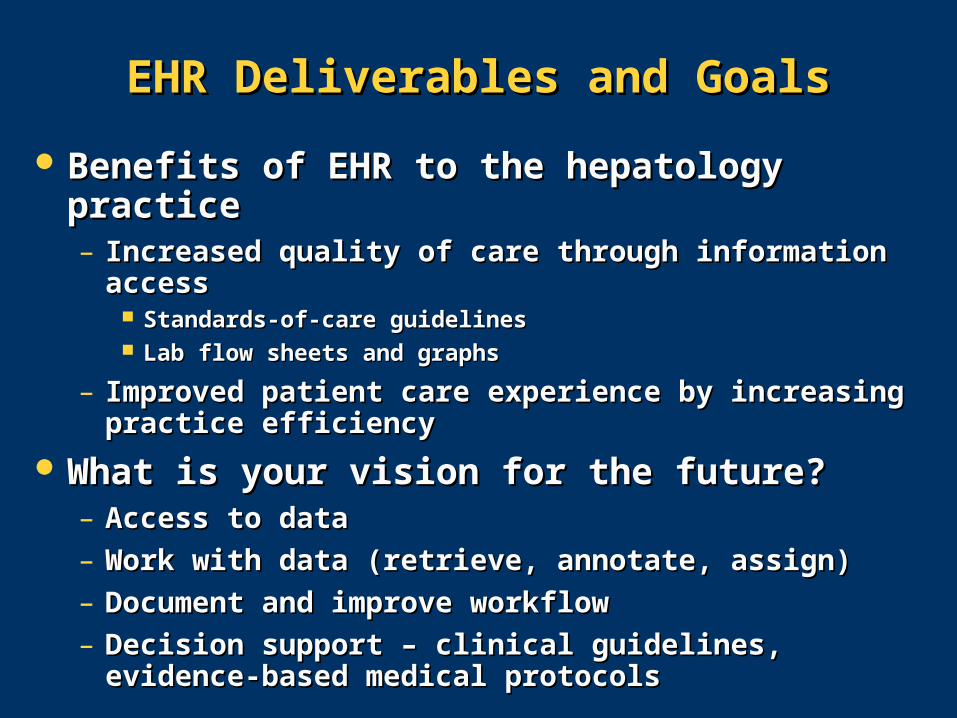
EHR Deliverables and GoalsEHR Deliverables and Goals
Benefits of EHR to the hepatology practiceBenefits of EHR to the hepatology practice– Increased quality of care through information accessIncreased quality of care through information access
Standards-of-care guidelinesStandards-of-care guidelines Lab flow sheets and graphsLab flow sheets and graphs
– Improved patient care experience by increasing Improved patient care experience by increasing practice efficiencypractice efficiency
What is your vision for the future?What is your vision for the future?– Access to dataAccess to data
– Work with data (retrieve, annotate, assign)Work with data (retrieve, annotate, assign)
– Document and improve workflowDocument and improve workflow
– Decision support – clinical guidelines, evidence-Decision support – clinical guidelines, evidence-based medical protocolsbased medical protocols
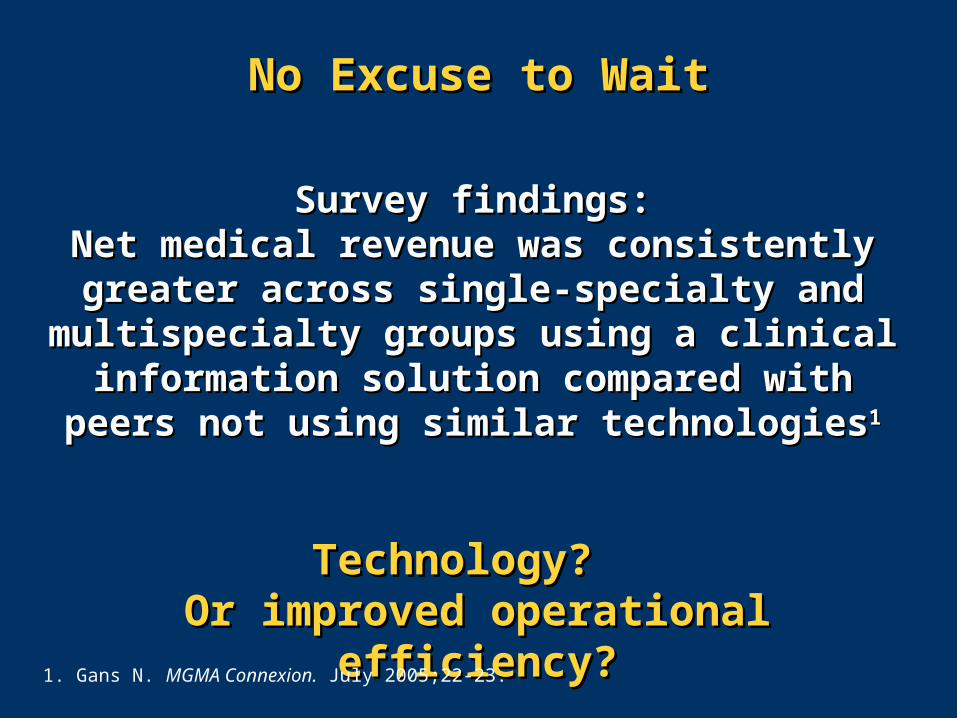
No Excuse to WaitNo Excuse to Wait
Survey findings:Survey findings:Net medical revenue was consistently greater Net medical revenue was consistently greater
across single-specialty and multispecialty across single-specialty and multispecialty groups using a clinical information solution groups using a clinical information solution
compared with peers not using similar compared with peers not using similar technologiestechnologies11
Technology? Technology? Or improved operational efficiency?Or improved operational efficiency?
1. Gans N. MGMA Connexion. July 2005;22-23.

Status QuoStatus Quo
If we keep doing what we’ve always done, If we keep doing what we’ve always done, we’ll keep getting what we always gotwe’ll keep getting what we always got
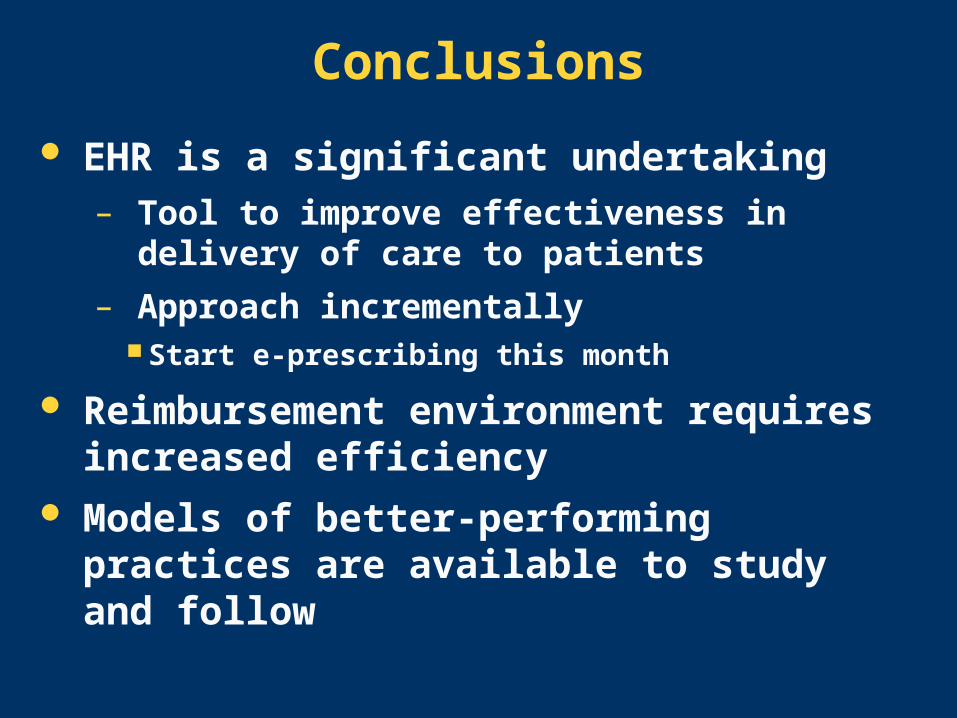
Conclusions
EHR is a significant undertaking– Tool to improve effectiveness in delivery
of care to patients
– Approach incrementally Start e-prescribing this month
Reimbursement environment requires increased efficiency
Models of better-performing practices are available to study and follow


Good, Better, and BestPractices in Good, Better, and BestPractices in HCV Management TodayHCV Management Today
Bruce R. Bacon, MDBruce R. Bacon, MD
James F. King MD Endowed Chair in GastroenterologyJames F. King MD Endowed Chair in GastroenterologyProfessor of Internal MedicineProfessor of Internal Medicine
Director, Division of Gastroenterology and HepatologyDirector, Division of Gastroenterology and HepatologySaint Louis University School of MedicineSaint Louis University School of Medicine
St. Louis, MissouriSt. Louis, Missouri
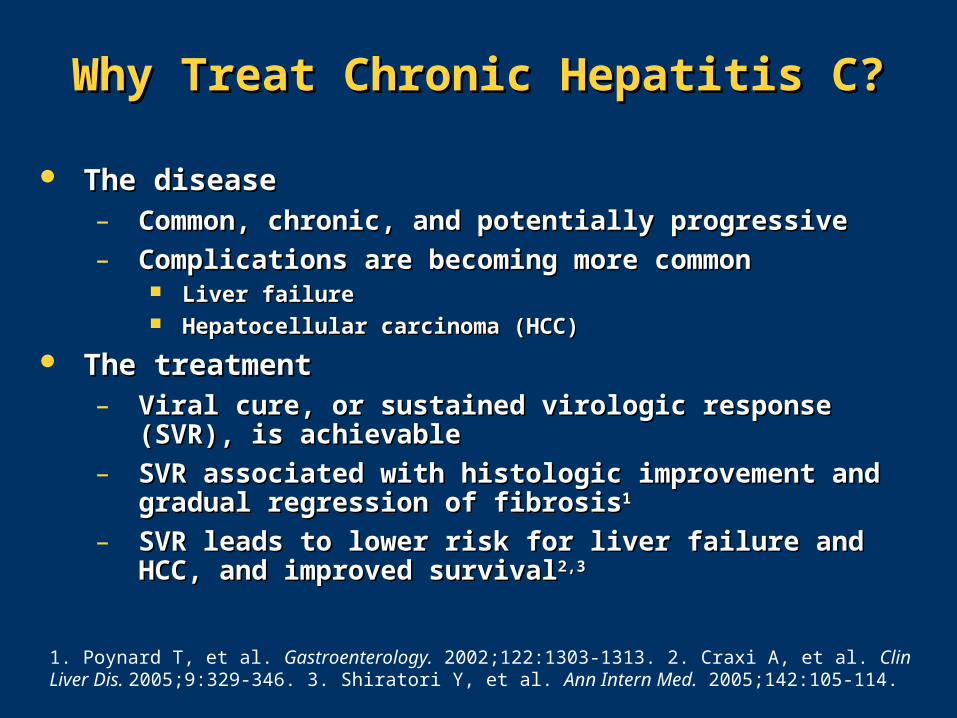
Why Treat Chronic Hepatitis C?Why Treat Chronic Hepatitis C?
The diseaseThe disease– Common, chronic, and potentially progressiveCommon, chronic, and potentially progressive
– Complications are becoming more commonComplications are becoming more common Liver failureLiver failure Hepatocellular carcinoma (HCC)Hepatocellular carcinoma (HCC)
The treatmentThe treatment– Viral cure, or sustained virologic response (SVR), is Viral cure, or sustained virologic response (SVR), is
achievableachievable
– SVR associated with histologic improvement and gradual SVR associated with histologic improvement and gradual regression of fibrosisregression of fibrosis11
– SVR leads to lower risk for liver failure and HCC, and SVR leads to lower risk for liver failure and HCC, and improved survivalimproved survival2,32,3
1. Poynard T, et al. Gastroenterology. 2002;122:1303-1313. 2. Craxi A, et al. Clin Liver Dis. 2005;9:329-346. 3. Shiratori Y, et al. Ann Intern Med. 2005;142:105-114.
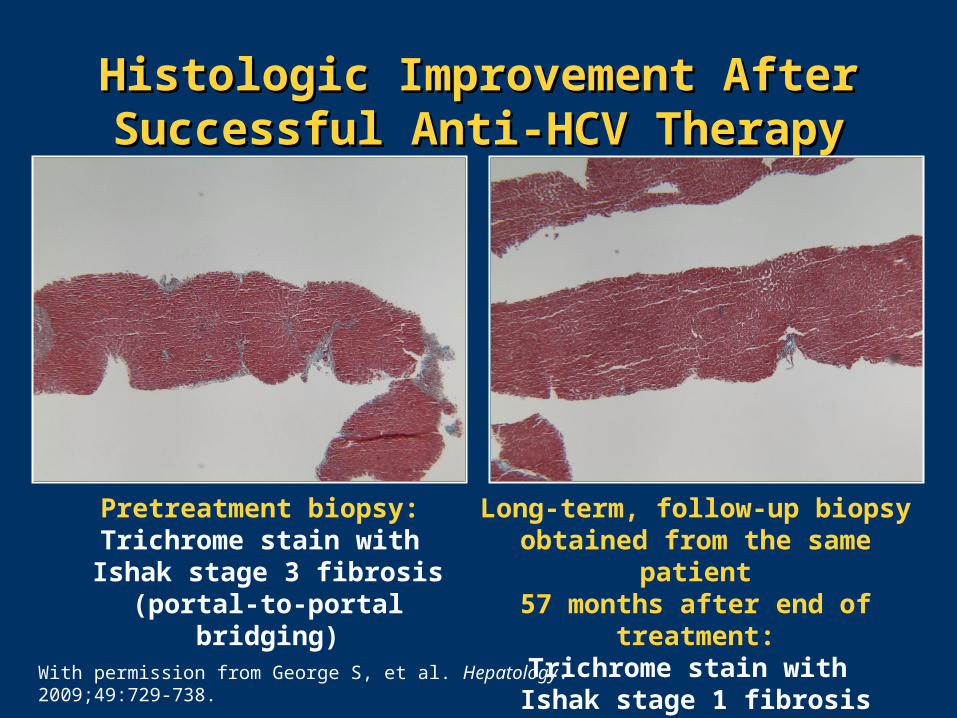
Histologic Improvement After Histologic Improvement After Successful Anti-HCV TherapySuccessful Anti-HCV Therapy
Long-term, follow-up biopsy obtained from the same patient
57 months after end of treatment:Trichrome stain with Ishak stage 1 fibrosis
Pretreatment biopsy: Trichrome stain with Ishak stage 3 fibrosis
(portal-to-portal bridging)
With permission from George S, et al. Hepatology. 2009;49:729-738.
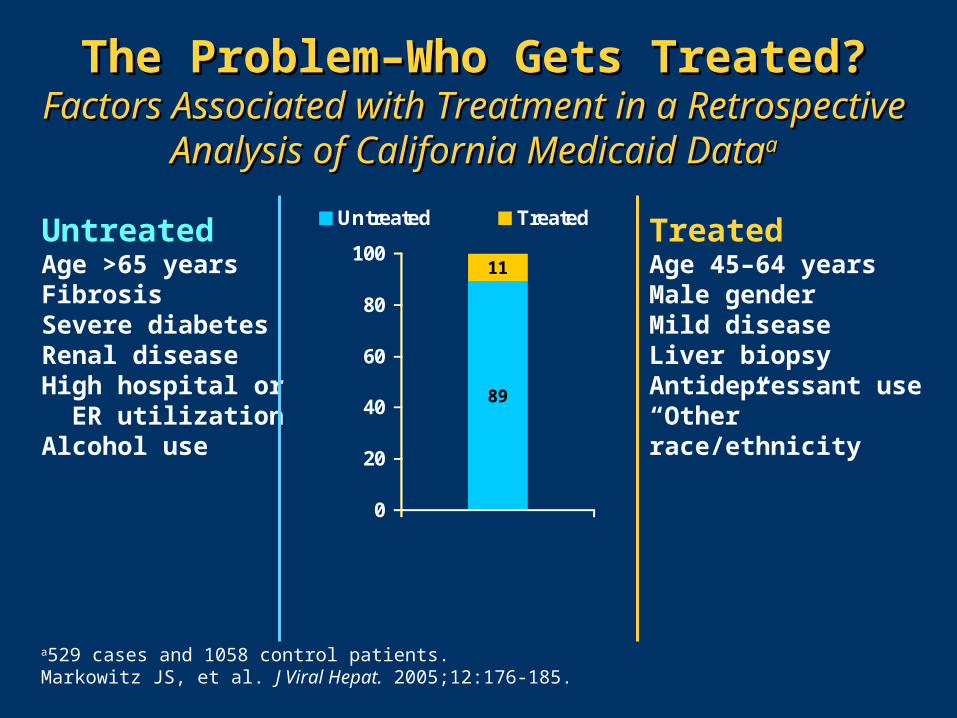
The Problem–Who Gets Treated?The Problem–Who Gets Treated?Factors Associated with Treatment in a Factors Associated with Treatment in a
Retrospective Analysis of California Medicaid DataRetrospective Analysis of California Medicaid Dataaa
a529 cases and 1058 control patients. Markowitz JS, et al. J Viral Hepat. 2005;12:176-185.
TreatedAge 45–64 yearsMale genderMild diseaseLiver biopsyAntidepressant use“Other” race/ethnicity
UntreatedAge >65 yearsFibrosisSevere diabetesRenal diseaseHigh hospital or ER utilizationAlcohol use
11
89
0
20
40
60
80
100
Proportion of HCV-Infected
Patients (%)
Untreated Treated
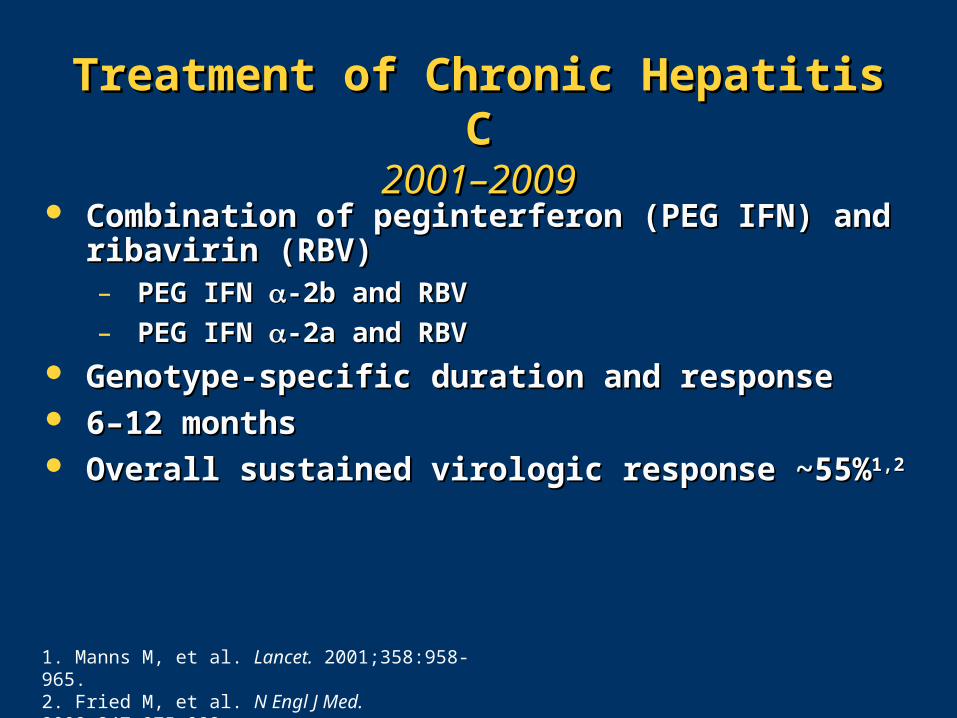
Treatment of Chronic Hepatitis CTreatment of Chronic Hepatitis C2001–20092001–2009
Combination of peginterferon (PEG IFN) and Combination of peginterferon (PEG IFN) and ribavirin (RBV)ribavirin (RBV)– PEG IFN PEG IFN -2b and RBV-2b and RBV
– PEG IFN PEG IFN -2a and RBV-2a and RBV
Genotype-specific duration and responseGenotype-specific duration and response 6–12 months 6–12 months Overall sustained virologic response ~55%Overall sustained virologic response ~55%1,21,2
1. Manns M, et al. Lancet. 2001;358:958-965. 2. Fried M, et al. N Engl J Med. 2002;347:975-982.
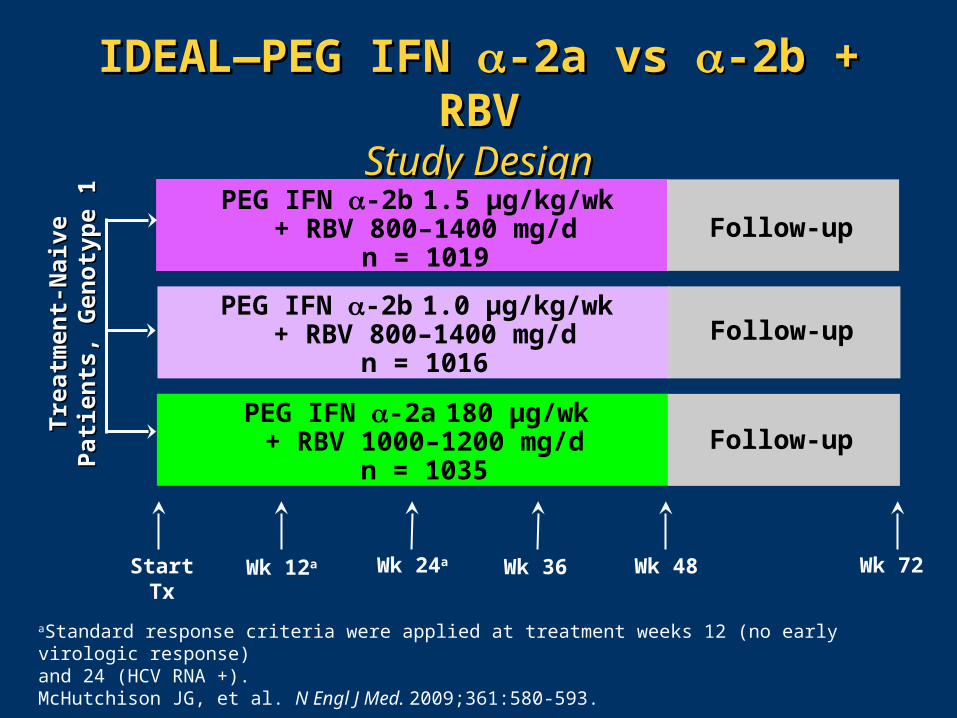
IDEALIDEAL—P—PEG IFN EG IFN -2a vs -2a vs -2b + RBV-2b + RBVStudy DesignStudy Design
Start Tx Wk 12a Wk 24a Wk 36 Wk 48
PEG IFN -2b 1.5 μg/kg/wk + RBV 800–1400 mg/d
n = 1019
PEG IFN -2b 1.0 μg/kg/wk + RBV 800–1400 mg/d
n = 1016Follow-up
Follow-up
PEG IFN -2a 180 μg/wk + RBV 1000–1200 mg/d
n = 1035Follow-up
Tre
atm
ent-
Nai
ve P
atie
nts
, T
reat
men
t-N
aive
Pat
ien
ts,
Gen
oty
pe
1G
eno
typ
e 1
aStandard response criteria were applied at treatment weeks 12 (no early virologic response) and 24 (HCV RNA +). McHutchison JG, et al. N Engl J Med. 2009;361:580-593.
Wk 72
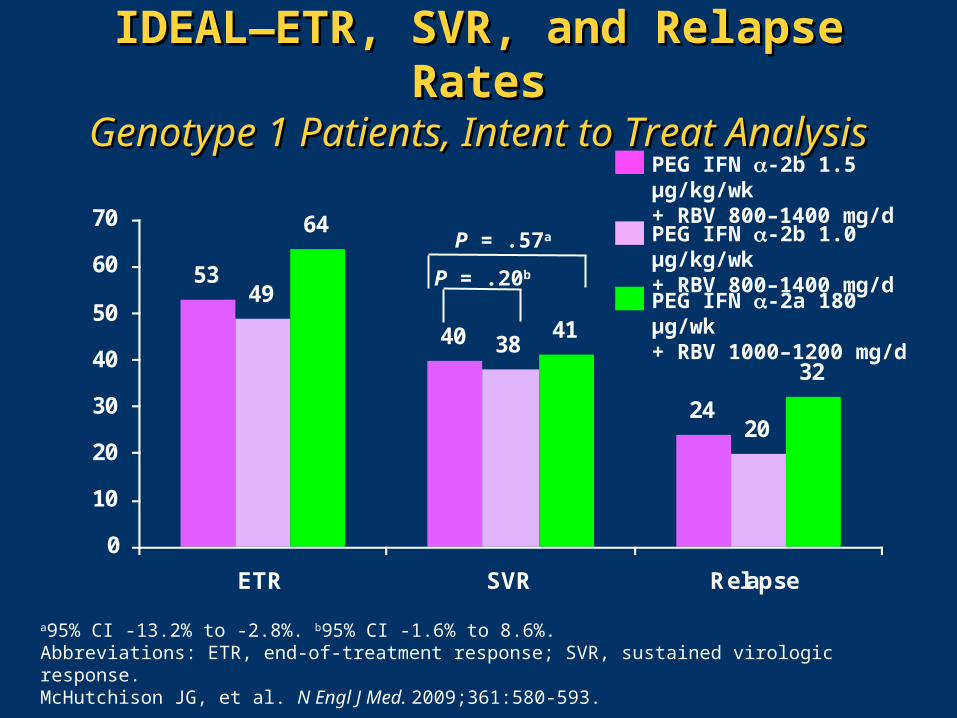
53
40
24
49
38
20
64
41
32
0
10
20
30
40
50
60
70
ETR SVR Relapse
Percent
P = .57a
P = .20b
PEG IFN -2b 1.5 µg/kg/wk + RBV 800–1400 mg/d
PEG IFN -2b 1.0 µg/kg/wk + RBV 800–1400 mg/d
PEG IFN -2a 180 µg/wk + RBV 1000–1200 mg/d
a95% CI -13.2% to -2.8%. b95% CI -1.6% to 8.6%. Abbreviations: ETR, end-of-treatment response; SVR, sustained virologic response.McHutchison JG, et al. N Engl J Med. 2009;361:580-593.
IDEALIDEAL——ETR, SVR, and Relapse RatesETR, SVR, and Relapse RatesGenotype 1 Patients, Intent to Treat AnalysisGenotype 1 Patients, Intent to Treat Analysis

IDEALIDEAL—A—Adverse Events, Dose dverse Events, Dose Modification, and Treatment Modification, and Treatment
DiscontinuationDiscontinuationPEG IFN -2b
1.5 + RBV n = 1019
PEG IFN -2b 1.0 + RBVn = 1016
PEG IFN -2a 180 + RBV
n = 1035
Deaths (all/treatment-related) 5/1 (no.) 1/0 (no.) 6/1 (no.)
Serious adverse events (AEs) (all/treatment-related)
9%/4% 9%/4% 12%/4%
Discontinued due to AEs 13% 10% 13%
Dose modification due to AEs 43% 33% 43%
Psychiatric disorders 1.9% 1.2% 1.4%
Hematologic parameters
Neutrophil count (<750/mm3/<500/mm3)
22%/3% 14%/2% 27%/6%
Hemoglobin (<10 g/dL/<8.5 g/dL)
31%/3% 25%/2% 30%/4%
Erythropoietin use 16% 14% 17%
With permission from McHutchison JG, et al. N Engl J Med. 2009;361:580-593.
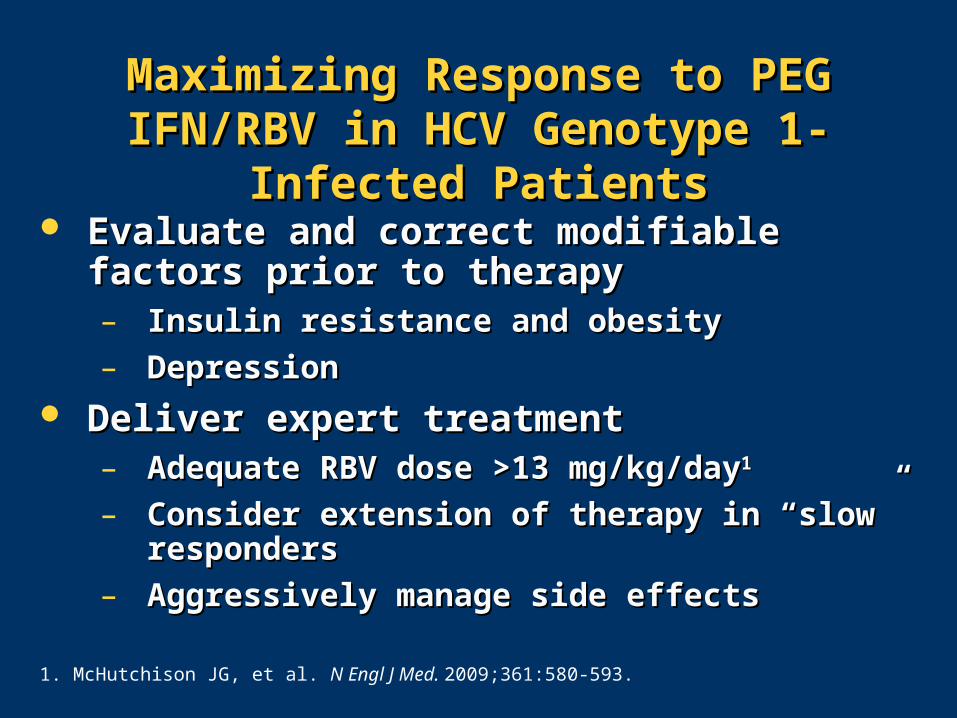
Maximizing Response to PEG IFN/RBV Maximizing Response to PEG IFN/RBV in HCV Genotype 1-Infected Patientsin HCV Genotype 1-Infected Patients
Evaluate and correct modifiable factors prior Evaluate and correct modifiable factors prior to therapyto therapy– Insulin resistance and obesityInsulin resistance and obesity
– DepressionDepression
Deliver expert treatmentDeliver expert treatment– Adequate RBV dose >13 mg/kg/dayAdequate RBV dose >13 mg/kg/day11
– Consider extension of therapy in Consider extension of therapy in “s“slow” low” respondersresponders
– Aggressively manage side effects Aggressively manage side effects
1. McHutchison JG, et al. N Engl J Med. 2009;361:580-593.
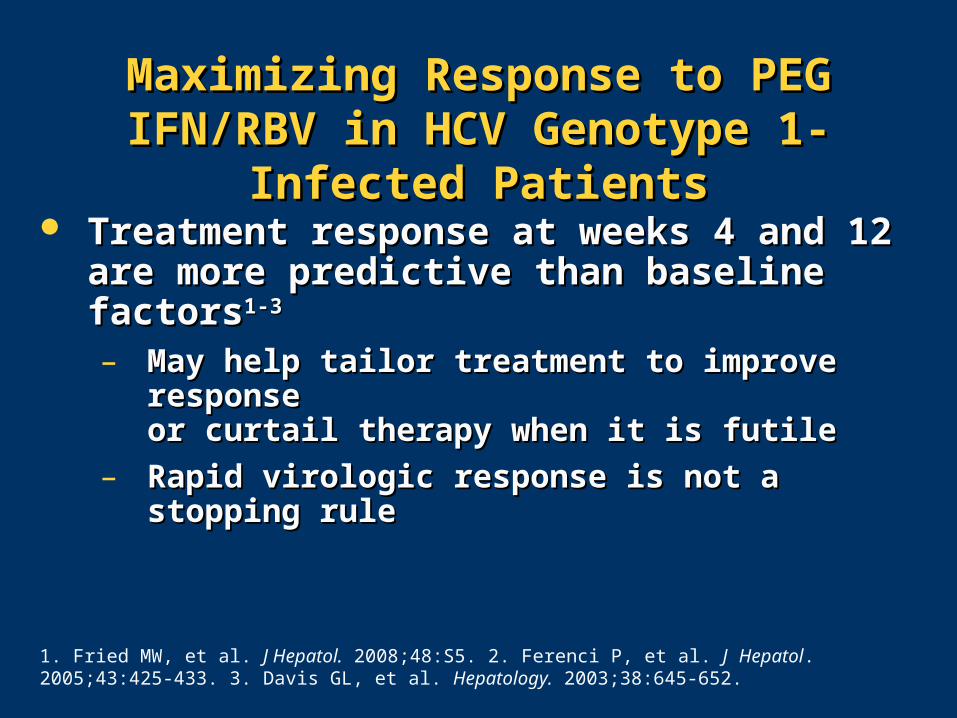
Maximizing Response to PEG IFN/RBV Maximizing Response to PEG IFN/RBV in HCV Genotype 1-Infected Patientsin HCV Genotype 1-Infected Patients
Treatment response at weeks 4 and 12 are Treatment response at weeks 4 and 12 are more predictive than baseline factorsmore predictive than baseline factors1-31-3
– May help tailor treatment to improve response May help tailor treatment to improve response or curtail therapy when it is futileor curtail therapy when it is futile
– Rapid virologic response is not a stopping ruleRapid virologic response is not a stopping rule
1. Fried MW, et al. J Hepatol. 2008;48:S5. 2. Ferenci P, et al. J Hepatol. 2005;43:425-433. 3. Davis GL, et al. Hepatology. 2003;38:645-652.
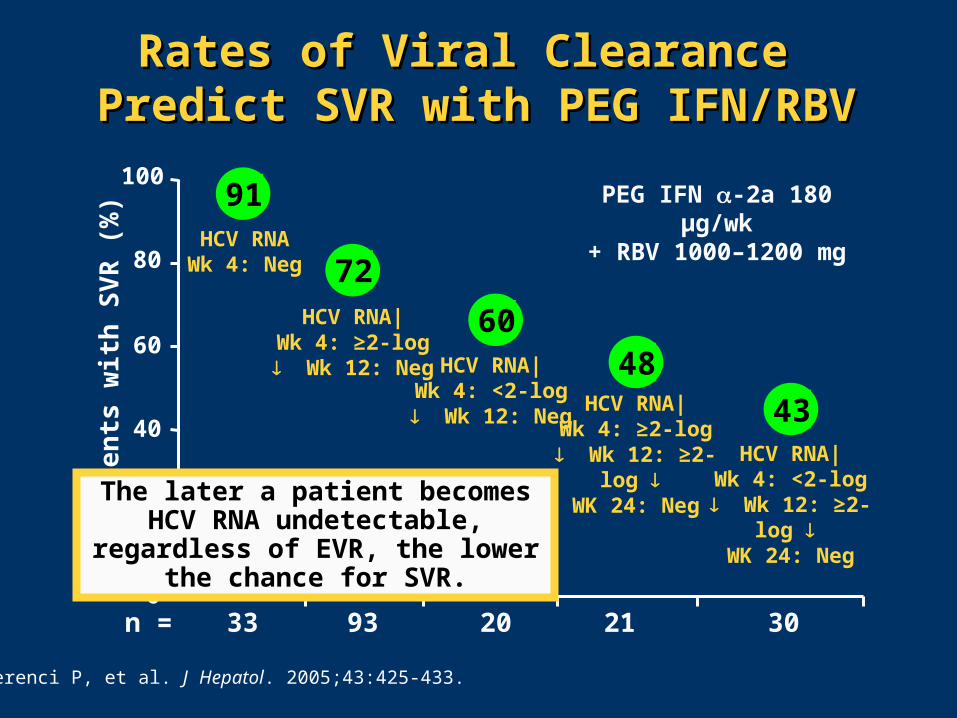
Ferenci P, et al. J Hepatol. 2005;43:425-433.
Rates of Viral Clearance Rates of Viral Clearance Predict SVR with PEG IFN/RBVPredict SVR with PEG IFN/RBV
PEG IFN -2a 180 µg/wk+ RBV 1000–1200 mg
Pa
tie
nts
wit
h S
VR
(%
)
91
72
60
0
20
40
60
80
100
HCV RNAWk 4: Neg
HCV RNA|Wk 4: ≥2-log
Wk 12: Neg HCV RNA|Wk 4: <2-log
Wk 12: NegHCV RNA|
Wk 4: ≥2-log Wk 12: ≥2-log
WK 24: NegHCV RNA|
Wk 4: <2-log Wk 12: ≥2-log
WK 24: Neg
48
n = 33 93 20 21 30
43
The later a patient becomes HCV RNA undetectable, regardless of
EVR, the lower the chance for SVR.
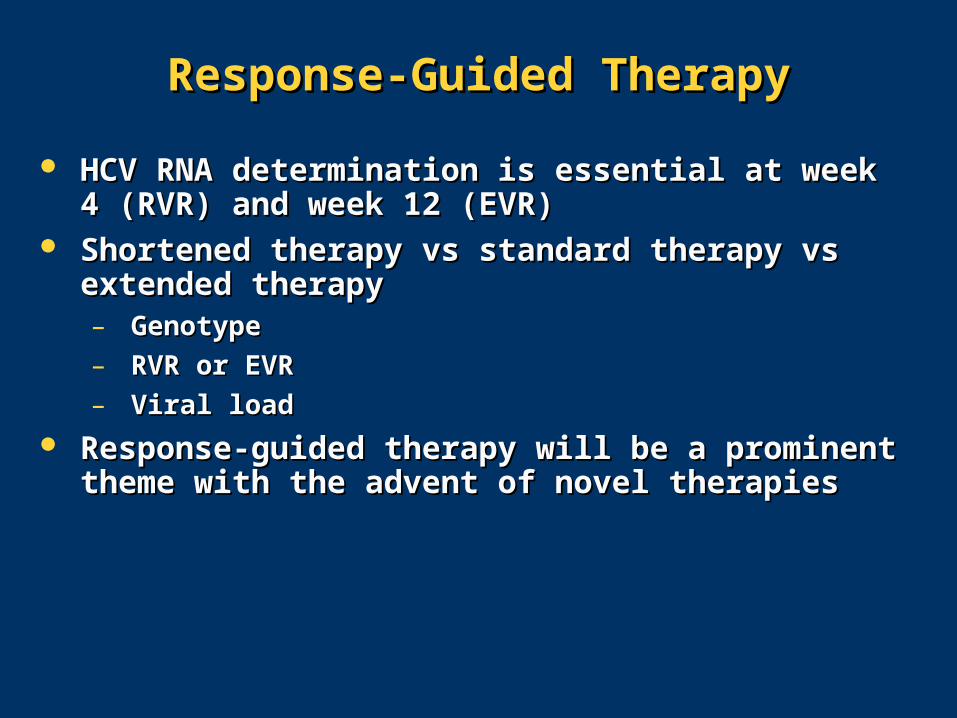
Response-Guided TherapyResponse-Guided Therapy
HCV RNA determination is essential at week 4 HCV RNA determination is essential at week 4 (RVR) and week 12 (EVR)(RVR) and week 12 (EVR)
Shortened therapy vs standard therapy vs extended Shortened therapy vs standard therapy vs extended therapytherapy– GenotypeGenotype
– RVR or EVRRVR or EVR
– Viral loadViral load
Response-guided therapy will be a prominent Response-guided therapy will be a prominent theme with the advent of novel therapiestheme with the advent of novel therapies
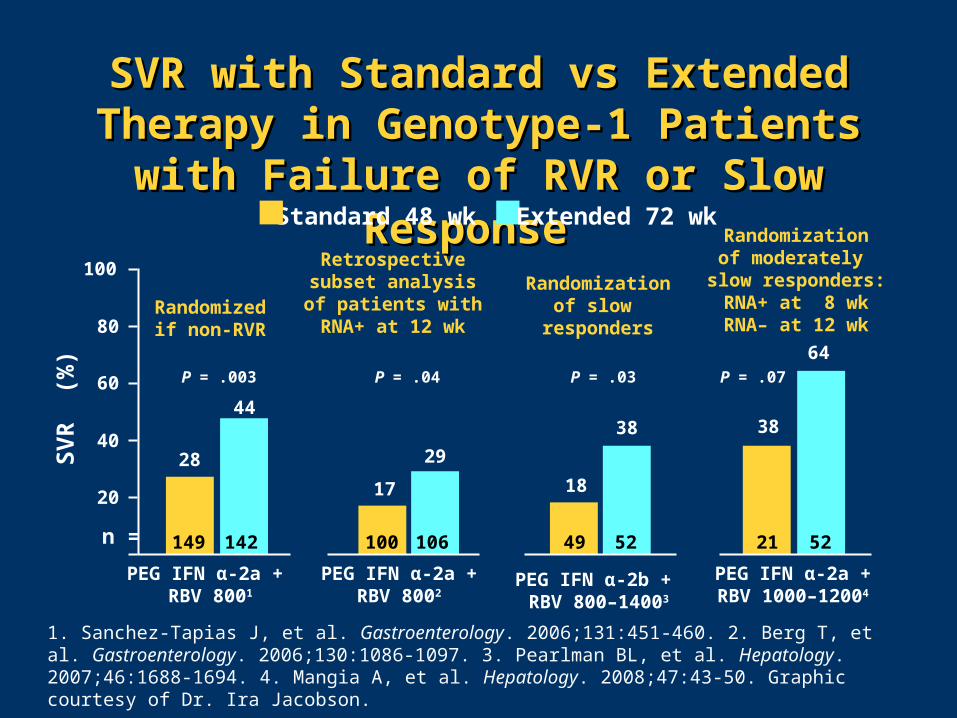
SVR with Standard vs Extended Therapy SVR with Standard vs Extended Therapy in Genotype-1 Patients with Failure of in Genotype-1 Patients with Failure of
RVR or Slow ResponseRVR or Slow Response
1. Sanchez-Tapias J, et al. Gastroenterology. 2006;131:451-460. 2. Berg T, et al. Gastroenterology. 2006;130:1086-1097. 3. Pearlman BL, et al. Hepatology. 2007;46:1688-1694. 4. Mangia A, et al. Hepatology. 2008;47:43-50. Graphic courtesy of Dr. Ira Jacobson.
Standard 48 wk Extended 72 wk
PEG IFN α-2a + RBV 8001
PEG IFN α-2a + RBV 8002
PEG IFN α-2b + RBV 800–14003
SV
R
(%)
28
44
17
29
18
38 38
64
PEG IFN α-2a + RBV 1000–12004
20
40
60
80
100
n = 149 100 49 21142 106 52 52
P = .07P = .03P = .04P = .003
Randomizedif non-RVR
Retrospectivesubset analysisof patients withRNA+ at 12 wk
Randomizationof slow
responders
Randomizationof moderately
slow responders:RNA+ at 8 wkRNA– at 12 wk

SVR in Genotype 2/3 Patients with RVRSVR in Genotype 2/3 Patients with RVR
1. von Wagner M, et al. Gastroenterology. 2005;129:522-527. 2. Mangia A , et al. N Engl J Med. 2005;352:2609-2617. 3. Shiffman ML, et al. N Engl J Med. 2007;357:124-134. 4. Dalgard O, et al. Hepatology. 2008;47:35-42. Graphic courtesy of Dr. Ira Jacobson.
Short (12–16 wk) Standard (24 wk)
7985
81
9182 80
8591
PEG IFN α-2a +RBV 8003
PEG IFN α-2a + RBV 800–12001
PEG IFN α-2b +RBV 1000–12002
PEG IFN α-2b +RBV 800–14004
20
40
60
80
100
SV
R (
%)
n = 7171 213 732 14870 731 150
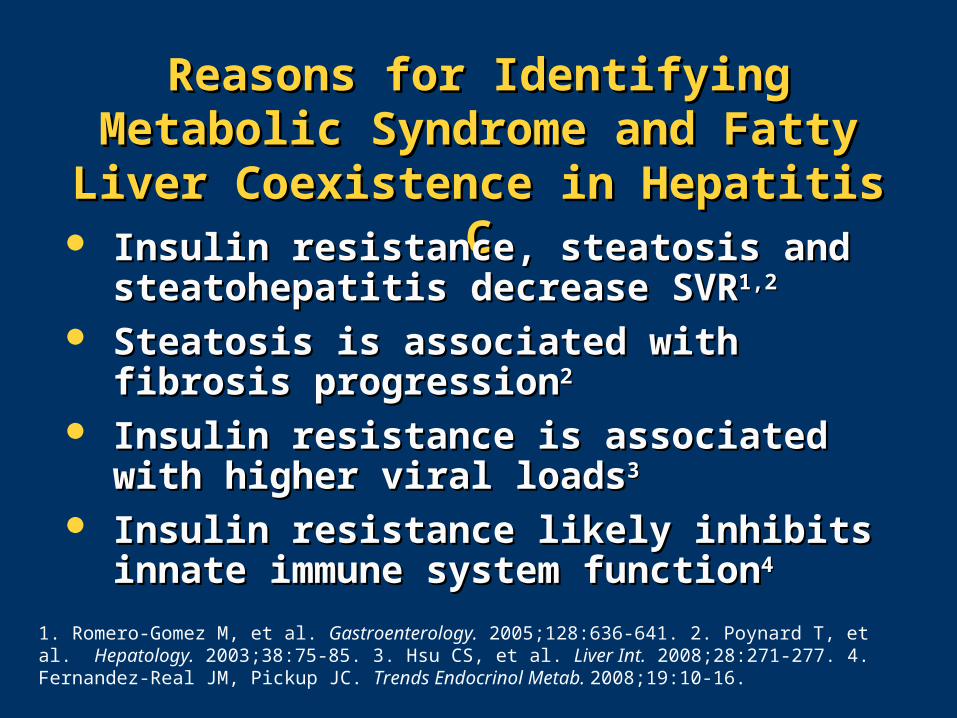
Reasons for Identifying Metabolic Reasons for Identifying Metabolic Syndrome and Fatty Liver Coexistence Syndrome and Fatty Liver Coexistence
in Hepatitis Cin Hepatitis C Insulin resistance, steatosis and Insulin resistance, steatosis and
steatohepatitis decrease SVRsteatohepatitis decrease SVR1,21,2
Steatosis is associated with fibrosis Steatosis is associated with fibrosis progressionprogression22
Insulin resistance is associated with higher Insulin resistance is associated with higher viral loadsviral loads33
Insulin resistance likely inhibits innate Insulin resistance likely inhibits innate immune system functionimmune system function44
1. Romero-Gomez M, et al. Gastroenterology. 2005;128:636-641. 2. Poynard T, et al. Hepatology. 2003;38:75-85. 3. Hsu CS, et al. Liver Int. 2008;28:271-277. 4. Fernandez-Real JM, Pickup JC. Trends Endocrinol Metab. 2008;19:10-16.
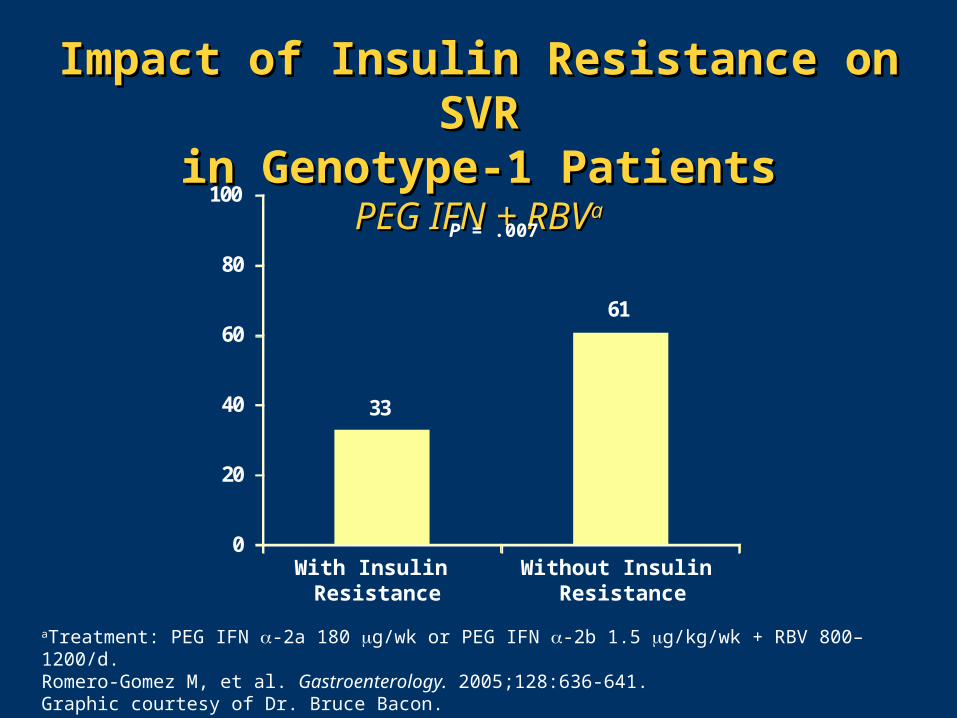
Impact of Insulin Resistance on SVRImpact of Insulin Resistance on SVRin Genotype-1 Patientsin Genotype-1 Patients
PEG IFN + RBVPEG IFN + RBVaa
aTreatment: PEG IFN -2a 180 g/wk or PEG IFN -2b 1.5 g/kg/wk + RBV 800–1200/d. Romero-Gomez M, et al. Gastroenterology. 2005;128:636-641. Graphic courtesy of Dr. Bruce Bacon.
P = .007
With Insulin Resistance
Without Insulin Resistance
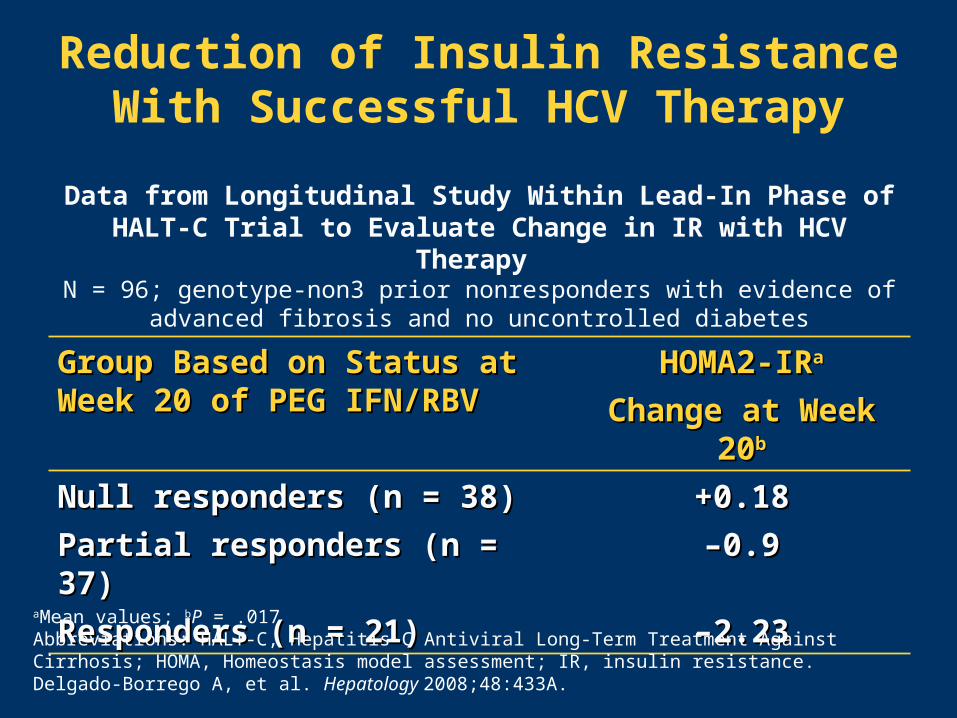
Reduction of Insulin Resistance With Successful HCV Therapy
Data from Longitudinal Study Within Lead-In Phase of HALT-C Trial to Evaluate Change in IR with HCV Therapy
N = 96; genotype-non3 prior nonresponders with evidence of advanced fibrosis and no uncontrolled diabetes
Group Based on Status at Group Based on Status at Week 20 of PEG IFN/RBVWeek 20 of PEG IFN/RBV
HOMA2-IRHOMA2-IRaa
Change at Week 20Change at Week 20bb
Null responders (n = 38)Null responders (n = 38) +0.18+0.18
Partial responders (n = 37)Partial responders (n = 37) ––0.90.9
Responders (n = 21)Responders (n = 21) ––2.232.23
aMean values; bP = .017Abbreviations: HALT-C, Hepatitis C Antiviral Long-Term Treatment Against Cirrhosis; HOMA, Homeostasis model assessment; IR, insulin resistance.Delgado-Borrego A, et al. Hepatology 2008;48:433A.
60 M
b
Chromosome 19
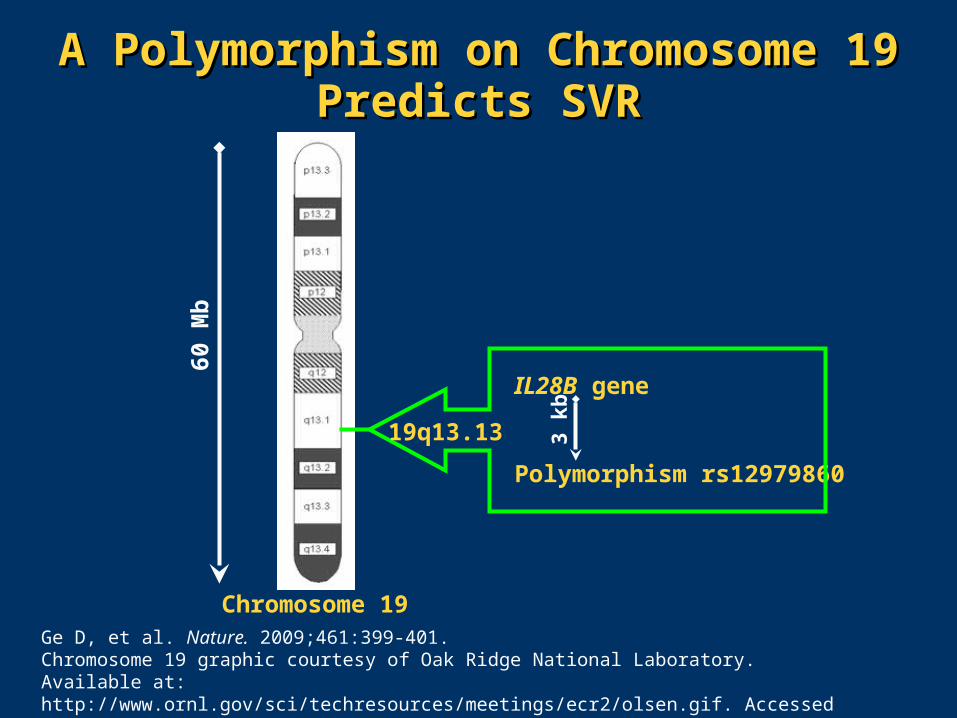
A Polymorphism on Chromosome 19 A Polymorphism on Chromosome 19 Predicts SVRPredicts SVR
Polymorphism rs12979860
IL28B gene
3 kb
19q13.13
Ge D, et al. Nature. 2009;461:399-401. Chromosome 19 graphic courtesy of Oak Ridge National Laboratory. Available at: http://www.ornl.gov/sci/techresources/meetings/ecr2/olsen.gif. Accessed on: October 21, 2009.
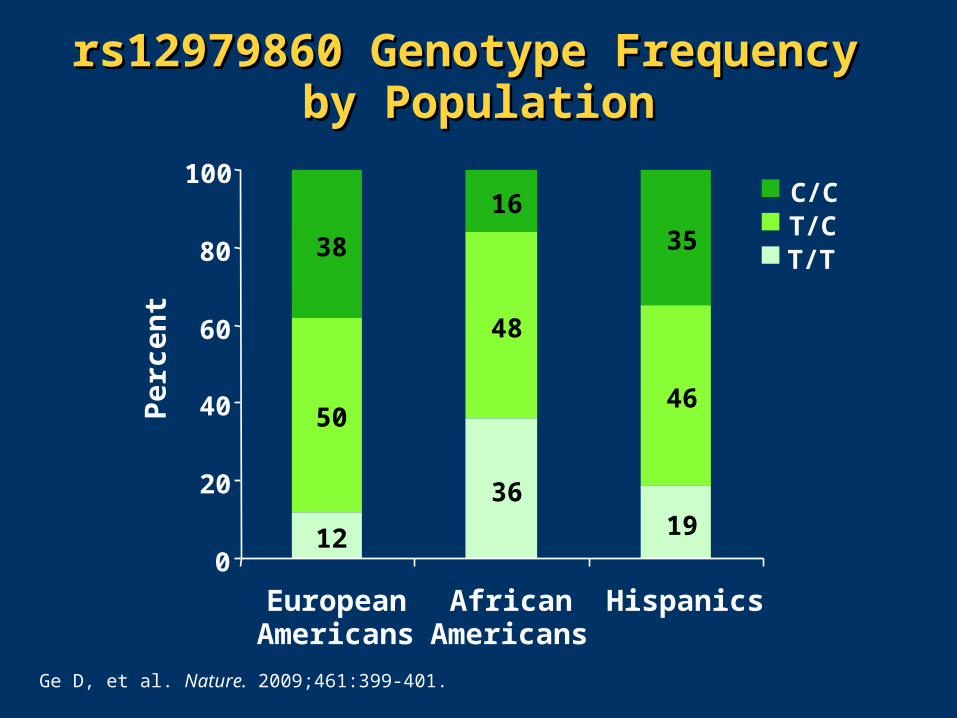
Americans Americans
12
3619
50
48
46
38
1635
0
20
40
60
80
100
European African Hispanics
Per
cen
tC/CT/CT/T
rs12979860 Genotype Frequency rs12979860 Genotype Frequency by Populationby Population
Ge D, et al. Nature. 2009;461:399-401.
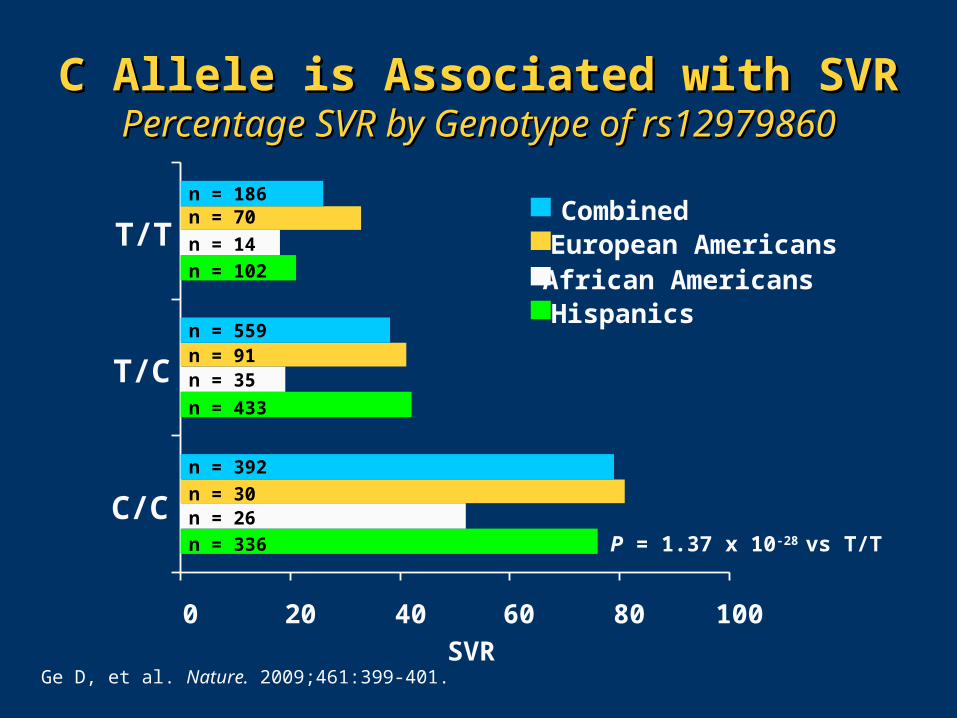
C Allele is Associated with SVRC Allele is Associated with SVRPercentage SVR by Genotype of rs12979860Percentage SVR by Genotype of rs12979860
0 20 40 60 80 100
C/C
T/C
T/T
SVR
CombinedEuropean AmericansAfrican AmericansHispanics
n = 70
n = 14
n = 102
n = 91n = 35
n = 433
n = 186
n = 559
n = 392
n = 30n = 26
n = 336 P = 1.37 x 10⁻²⁸ vs T/T
Ge D, et al. Nature. 2009;461:399-401.
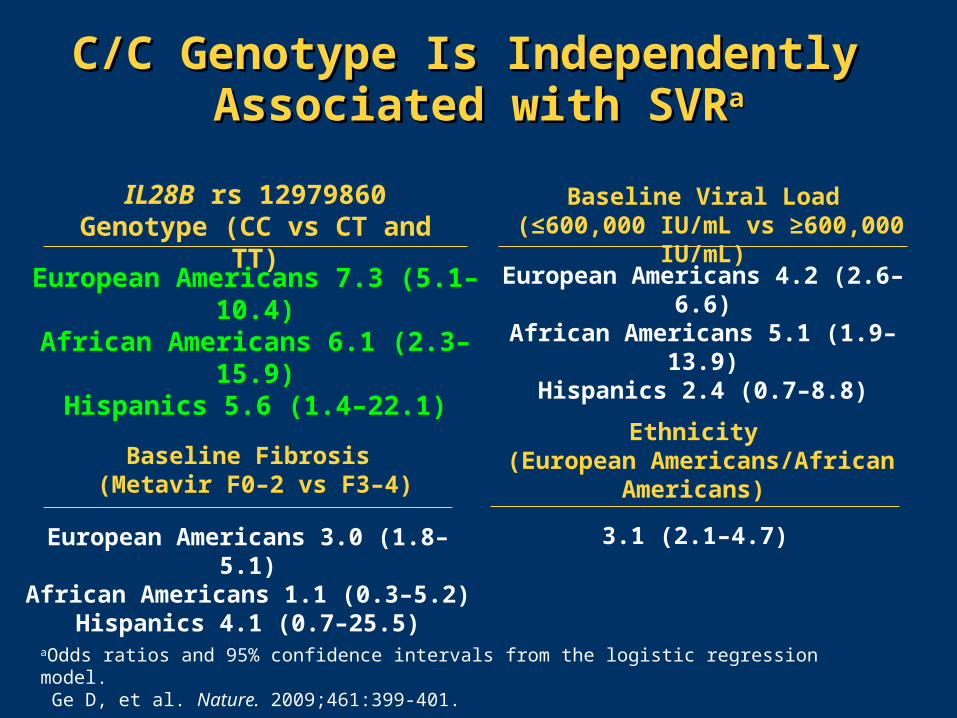
IL28B rs 12979860 Genotype (CC vs CT and TT)
European Americans 7.3 (5.1–10.4)African Americans 6.1 (2.3–15.9)
Hispanics 5.6 (1.4–22.1)
Baseline Viral Load (≤600,000 IU/mL vs ≥600,000 IU/mL)
European Americans 4.2 (2.6–6.6)African Americans 5.1 (1.9–13.9)
Hispanics 2.4 (0.7–8.8)
Baseline Fibrosis (Metavir F0–2 vs F3–4)
European Americans 3.0 (1.8–5.1)African Americans 1.1 (0.3–5.2)
Hispanics 4.1 (0.7–25.5)
Ethnicity (European Americans/African
Americans)
3.1 (2.1–4.7)
C/C Genotype Is Independently C/C Genotype Is Independently Associated with SVRAssociated with SVRaa
aOdds ratios and 95% confidence intervals from the logistic regression model. Ge D, et al. Nature. 2009;461:399-401.
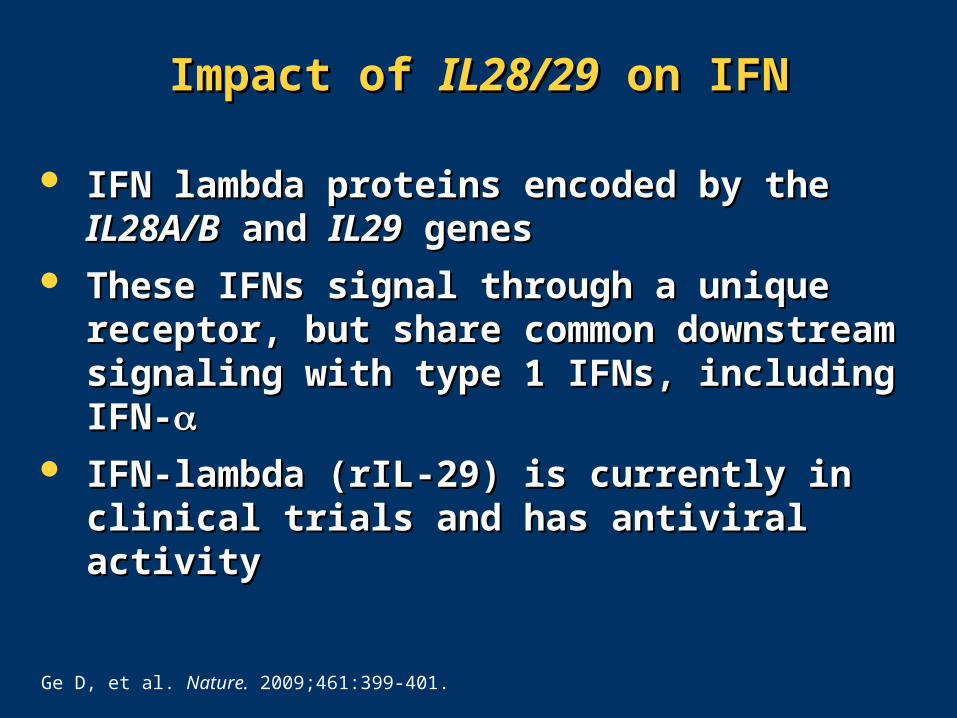
IFN lambda proteins encoded by the IFN lambda proteins encoded by the IL28A/BIL28A/B and and IL29IL29 genes genes
These IFNs signal through a unique receptor, These IFNs signal through a unique receptor, but share common downstream signaling with but share common downstream signaling with type 1 IFNs, including IFN-type 1 IFNs, including IFN-
IFN-lambda (rIL-29) is currently in clinical IFN-lambda (rIL-29) is currently in clinical trials and has antiviral activitytrials and has antiviral activity
Ge D, et al. Nature. 2009;461:399-401.
Impact of Impact of IL28/29IL28/29 on IFN on IFN
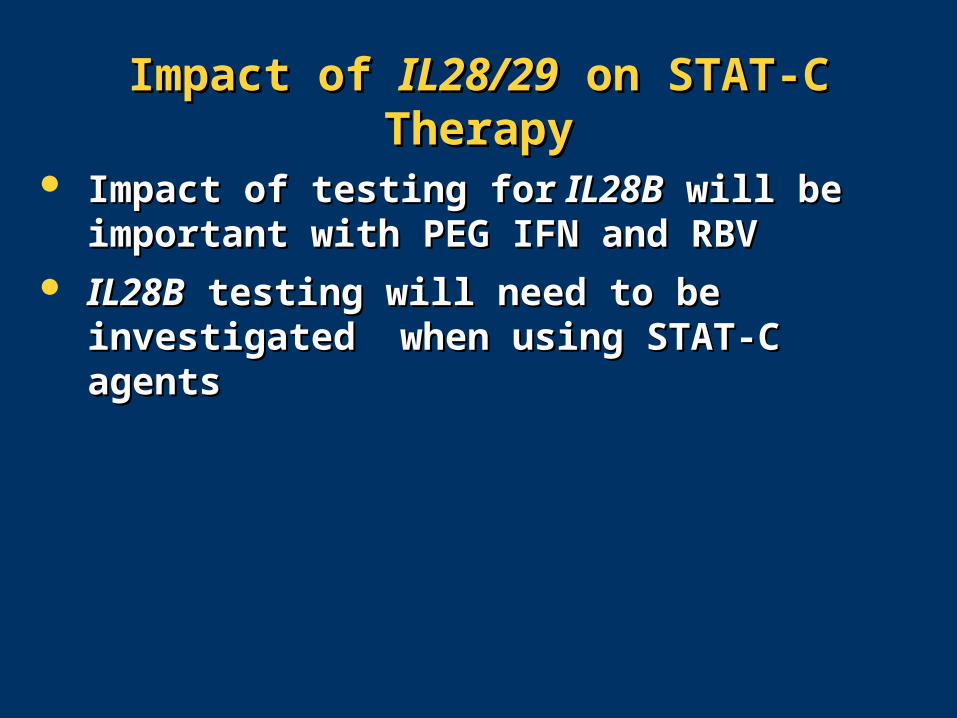
Impact of Impact of IL28/29IL28/29 on STAT-C Therapy on STAT-C Therapy
Impact of testing forImpact of testing for IL28B IL28B will be important will be important with PEG IFN and RBVwith PEG IFN and RBV
IL28BIL28B testing will need to be investigated testing will need to be investigated when using STAT-C agentswhen using STAT-C agents
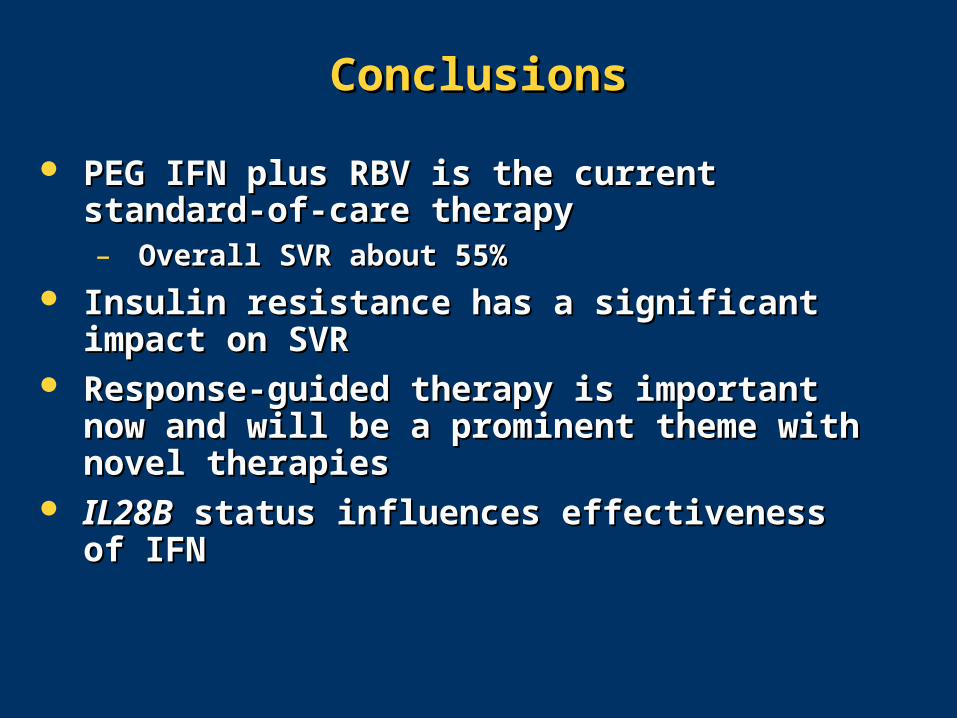
ConclusionsConclusions
PEG IFN plus RBV is the current standard-PEG IFN plus RBV is the current standard-of-care therapyof-care therapy– Overall SVR about 55%Overall SVR about 55%
Insulin resistance has a significant impact Insulin resistance has a significant impact on SVRon SVR
Response-guided therapy is important now Response-guided therapy is important now and will be a prominent theme with novel and will be a prominent theme with novel therapiestherapies
IL28BIL28B status influences effectiveness of IFN status influences effectiveness of IFN


The Future of Anti-HCV Treatment—The Future of Anti-HCV Treatment—Emerging Therapies and Their Emerging Therapies and Their
Integration into the Medical Office of Integration into the Medical Office of the Futurethe Future
Nezam H. Afdhal, MDNezam H. Afdhal, MD
Associate Professor of MedicineAssociate Professor of MedicineHarvard Medical SchoolHarvard Medical School
Chief of HepatologyChief of HepatologyBeth Israel Deaconess Medical CenterBeth Israel Deaconess Medical Center
Boston, MassachusettsBoston, Massachusetts
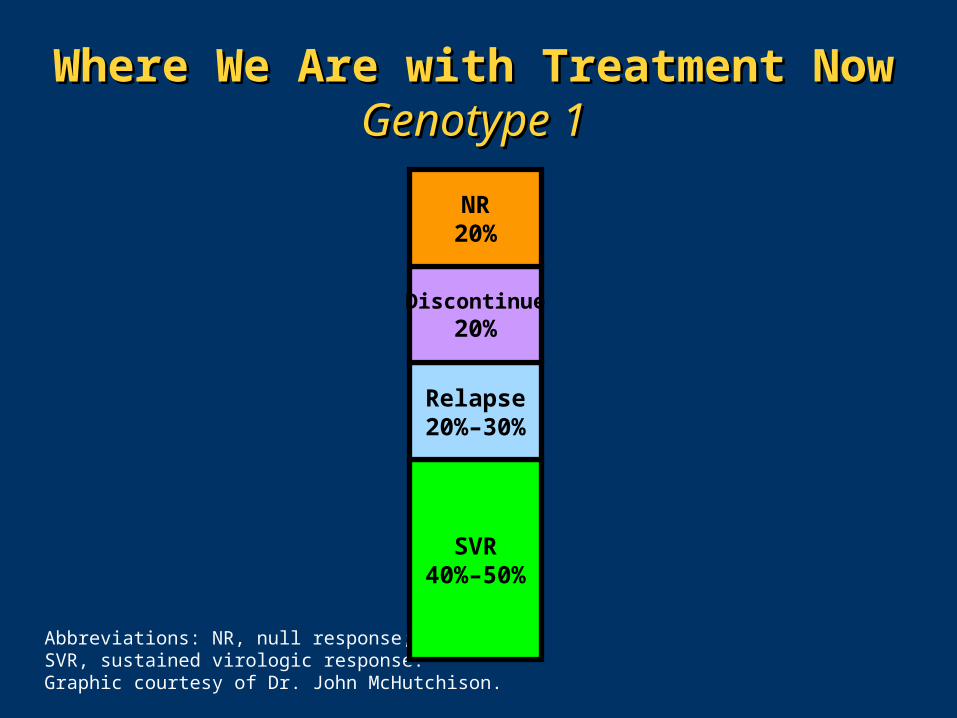
Where We Are with Treatment NowWhere We Are with Treatment NowGenotype 1Genotype 1
Abbreviations: NR, null response;SVR, sustained virologic response.Graphic courtesy of Dr. John McHutchison.
SVR40%–50%
Relapse20%–30%
Discontinue20%
NR20%
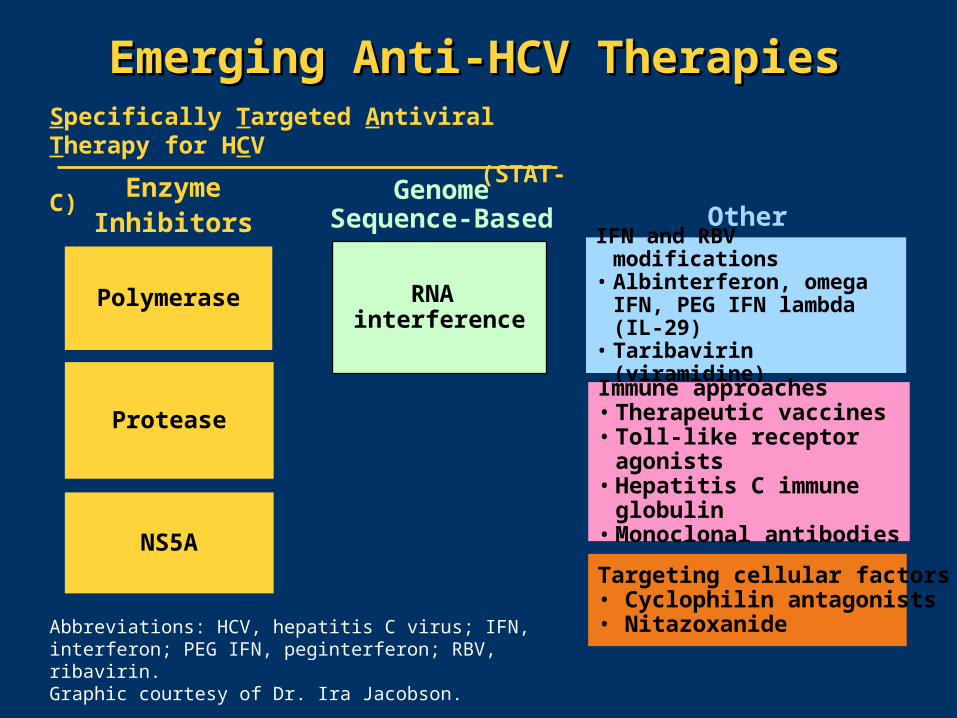
Emerging Anti-HCV TherapiesEmerging Anti-HCV Therapies
Genome Sequence-Based
RNA interference
EnzymeInhibitors
Protease
Polymerase
Other
IFN and RBV modifications• Albinterferon, omega IFN,
PEG IFN lambda (IL-29)• Taribavirin (viramidine)
Immune approaches• Therapeutic vaccines• Toll-like receptor agonists• Hepatitis C immune
globulin• Monoclonal antibodies
Targeting cellular factors• Cyclophilin antagonists• Nitazoxanide
Specifically Targeted Antiviral Therapy for HCV (STAT-C)
NS5A
Abbreviations: HCV, hepatitis C virus; IFN, interferon; PEG IFN, peginterferon; RBV, ribavirin.Graphic courtesy of Dr. Ira Jacobson.
MK7009
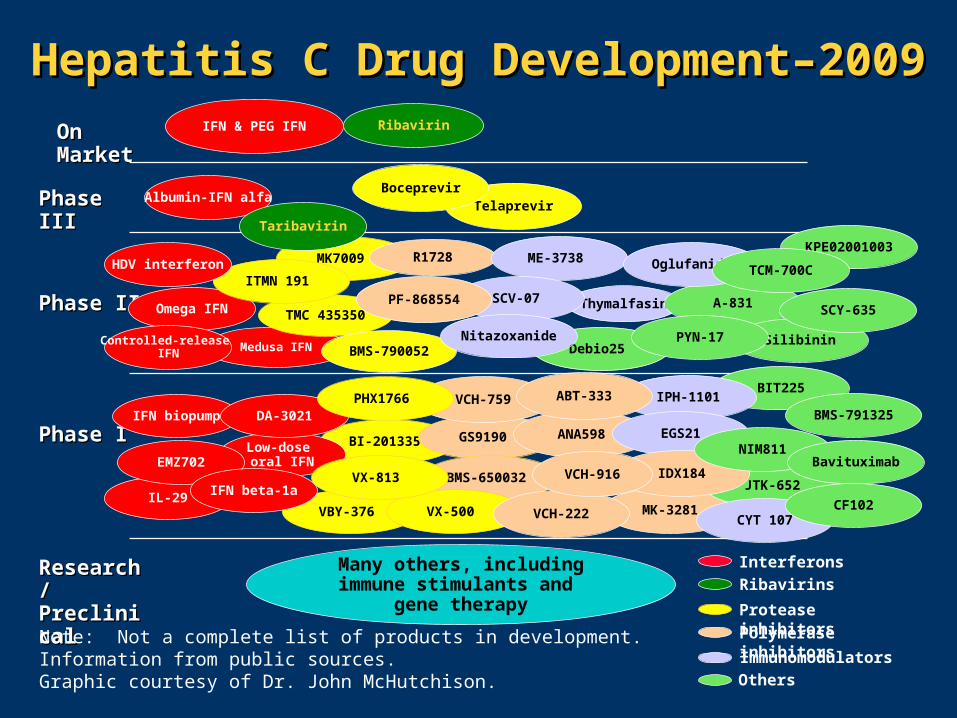
Hepatitis C Drug Development–2009Hepatitis C Drug Development–2009
Phase IIPhase II
On MarketOn Market
Phase IIIPhase III
Phase IPhase I
Research/ Research/ PreclinicalPreclinical
Thymalfasin
Albumin-IFN alfa
IFN & PEG IFN
Many others, includingimmune stimulants and
gene therapy
Ribavirin
Taribavirin
Medusa IFN
A-831
Telaprevir
Debio25
Omega IFN
Boceprevir
R1728
TMC 435350
Note: Not a complete list of products in development.Information from public sources.Graphic courtesy of Dr. John McHutchison.
Silibinin
BI-201335 GS9190
BMS-650032
Interferons
Ribavirins
Immunomodulators
Protease inhibitors
Polymerase inhibitors
BMS-790052
ITMN 191
VBY-376
Others
MK-3281
ANA598
VCH-759
JTK-652
BIT225
BMS-791325
Controlled-release IFN
Low-dose oral IFN
IFN biopump DA-3021
IL-29
ME-3738
SCV-07
Oglufanide
IPH-1101
CYT 107
EGS21
SCY-635
KPE02001003
TCM-700C
PYN-17Nitazoxanide
VX-500
ABT-333PHX1766
IDX184EMZ702
HDV interferon
NIM811Bavituximab
CF102
VX-813
VCH-222
IFN beta-1a
PF-868554
VCH-916
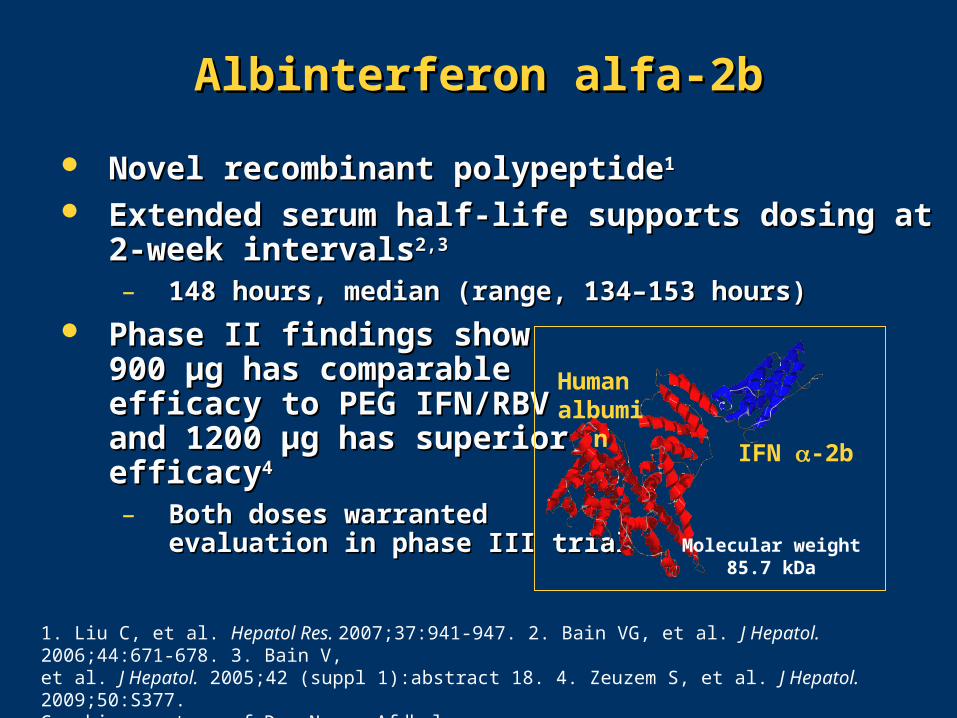
Albinterferon alfa-2bAlbinterferon alfa-2b
Novel recombinant polypeptideNovel recombinant polypeptide11
Extended serum half-life supports dosing at 2-week Extended serum half-life supports dosing at 2-week intervalsintervals2,32,3
– 148 hours, median (range, 134–153 hours)148 hours, median (range, 134–153 hours)
Phase II findings showPhase II findings show900 900 µµg has comparableg has comparableefficacy to PEG IFN/RBVefficacy to PEG IFN/RBVand 1200 and 1200 µµg has superior g has superior efficacyefficacy44
– Both doses warrantedBoth doses warrantedevaluation in phase III trialevaluation in phase III trial
1. Liu C, et al. Hepatol Res. 2007;37:941-947. 2. Bain VG, et al. J Hepatol. 2006;44:671-678. 3. Bain V, et al. J Hepatol. 2005;42 (suppl 1):abstract 18. 4. Zeuzem S, et al. J Hepatol. 2009;50:S377. Graphic courtesy of Dr. Nezam Afdhal.
IFN -2b
Human albumin
Molecular weight 85.7 kDa
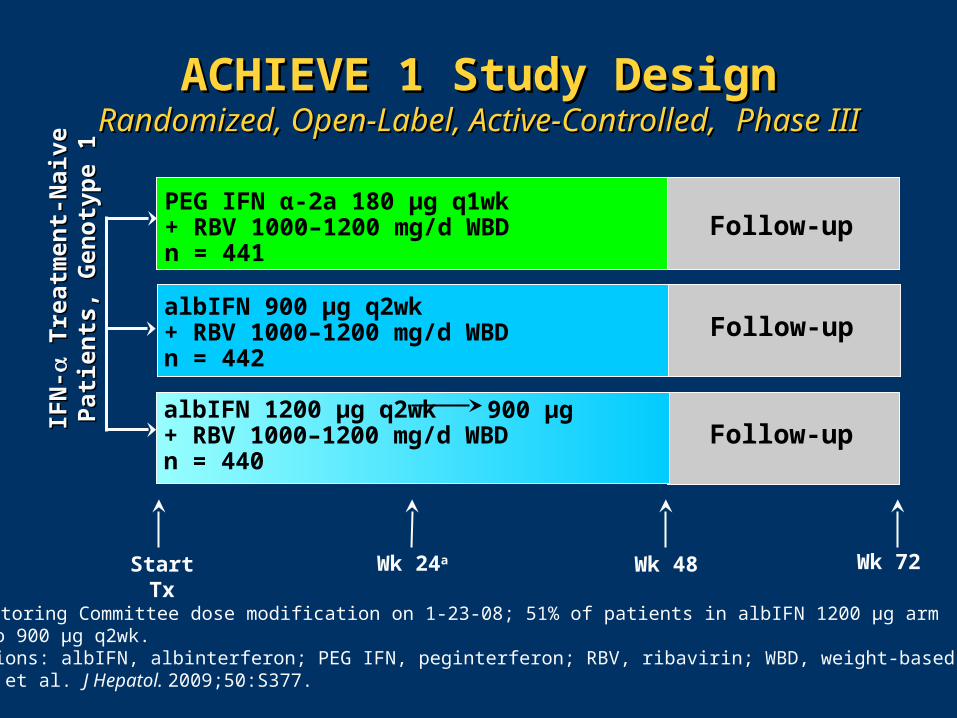
Wk 72Start Tx Wk 48Wk 24a
PEG IFN α-2a 180 µg q1wk+ RBV 1000–1200 mg/d WBDn = 441
albIFN 900 µg q2wk+ RBV 1000–1200 mg/d WBDn = 442
Follow-up
Follow-up
Follow-up
IFN
-IF
N-
Tre
atm
ent-
Nai
ve P
atie
nts
, T
reat
men
t-N
aive
Pat
ien
ts,
Gen
oty
pe
1G
eno
typ
e 1
aData Monitoring Committee dose modification on 1-23-08; 51% of patients in albIFN 1200 µg arm reduced to 900 µg q2wk. Abbreviations: albIFN, albinterferon; PEG IFN, peginterferon; RBV, ribavirin; WBD, weight-based dosing.Zeuzem S, et al. J Hepatol. 2009;50:S377.
ACHIEVE 1 Study DesignACHIEVE 1 Study DesignRandomized, Open-Label, Active-Controlled,Randomized, Open-Label, Active-Controlled, Phase IIIPhase III
albIFN 1200 µg q2wk+ RBV 1000–1200 mg/d WBDn = 440
900 µg
SVRSVR RelapseRelapse
PEG IFN PEG IFN 180 µg 180 µg q1wkq1wk
PEG IFN PEG IFN 180 µg 180 µg q1wkq1wk
albIFN albIFN 900 µg 900 µg q2wkq2wk
albIFN albIFN 1200 µg 1200 µg
q2wkq2wk
albIFN albIFN 900 µg 900 µg q2wkq2wk
albIFN albIFN 1200 µg 1200 µg
q2wkq2wk
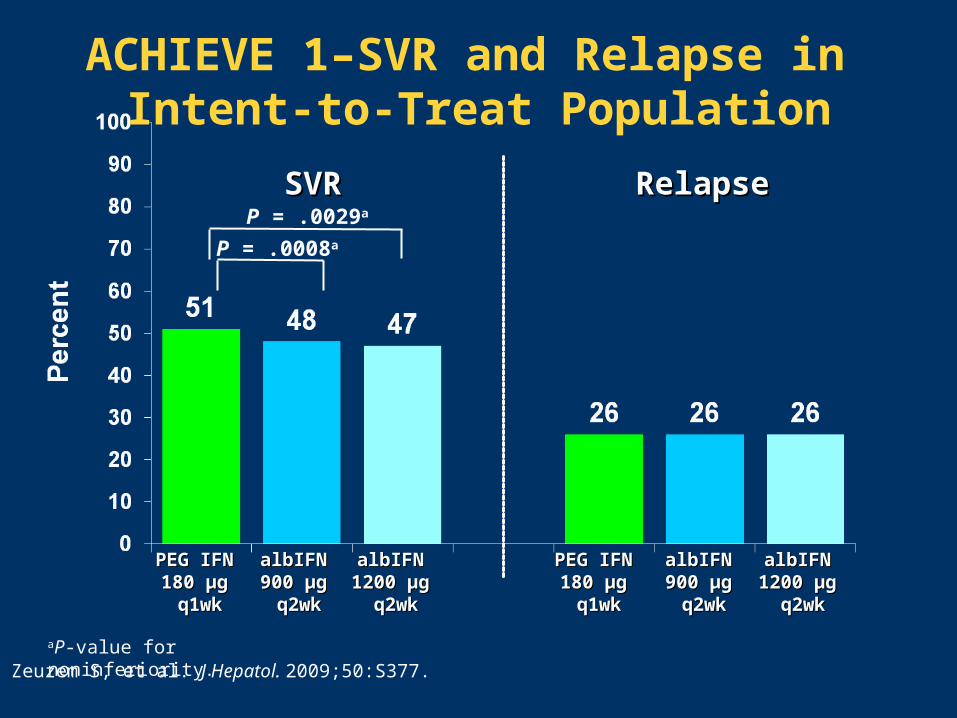
ACHIEVE 1–SVR and Relapse in Intent-to-Treat Population
Zeuzem S, et al. J Hepatol. 2009;50:S377.
P = .0029a
P = .0008a
aP-value for noninferiority.
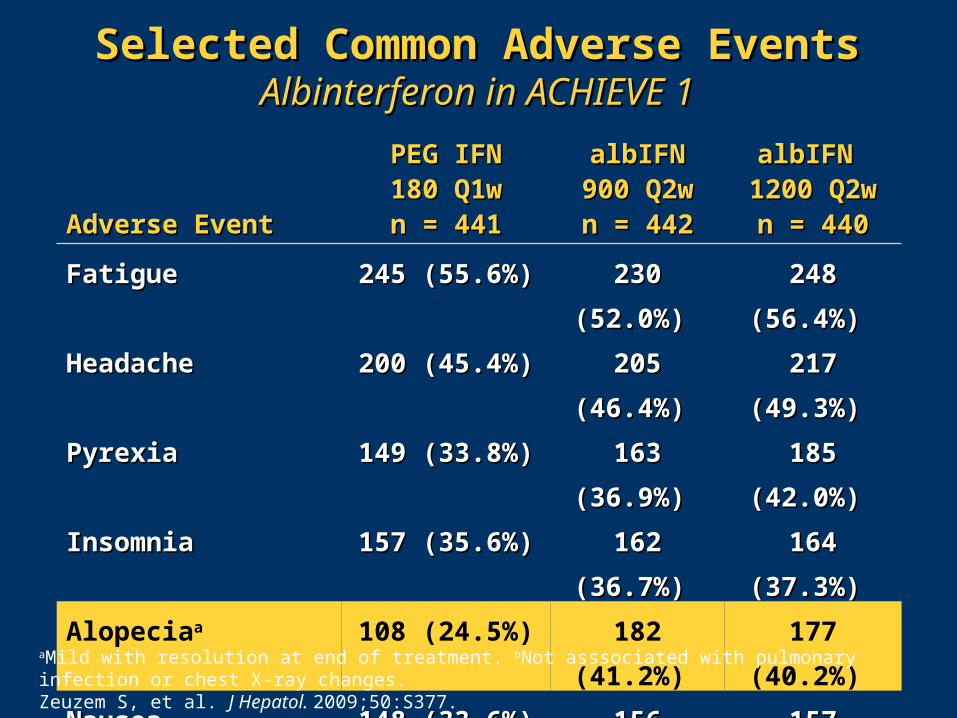
Selected Common Adverse EventsSelected Common Adverse EventsAlbinterferon in ACHIEVE 1Albinterferon in ACHIEVE 1
Adverse Event Adverse Event
PEG IFNPEG IFN180 Q1w180 Q1wn = 441n = 441
albIFNalbIFN900 Q2w900 Q2wn = 442n = 442
albIFN albIFN 1200 Q2w1200 Q2w
n = 440n = 440
Fatigue Fatigue 245 (55.6%) 245 (55.6%) 230 (52.0%) 230 (52.0%) 248 (56.4%) 248 (56.4%)
Headache Headache 200 (45.4%) 200 (45.4%) 205 (46.4%) 205 (46.4%) 217 (49.3%) 217 (49.3%)
Pyrexia Pyrexia 149 (33.8%) 149 (33.8%) 163 (36.9%) 163 (36.9%) 185 (42.0%) 185 (42.0%)
Insomnia Insomnia 157 (35.6%) 157 (35.6%) 162 (36.7%) 162 (36.7%) 164 (37.3%) 164 (37.3%)
Alopeciaa 108 (24.5%) 182 (41.2%) 177 (40.2%)
NauseaNausea 148 (33.6%) 148 (33.6%) 156 (35.3%) 156 (35.3%) 157 (35.7%) 157 (35.7%)
Coughb 113 (25.6%) 166 (37.6%) 175 (39.8%)
Mood altered Mood altered 108 (24.5%) 108 (24.5%) 106 (24.0%) 106 (24.0%) 89 (20.2%) 89 (20.2%)
Depression Depression 84 (19.0%) 84 (19.0%) 86 (19.5%) 86 (19.5%) 93 (21.1%) 93 (21.1%) aMild with resolution at end of treatment. bNot asssociated with pulmonary infection or chest X-ray changes. Zeuzem S, et al. J Hepatol. 2009;50:S377.
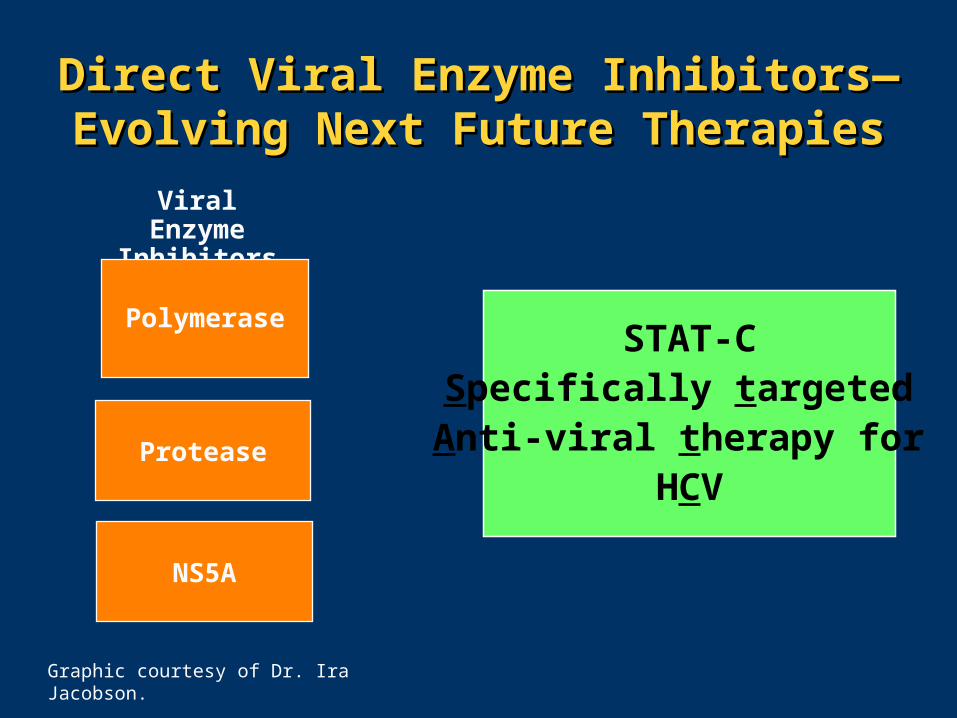
Direct Viral Enzyme InhibitorsDirect Viral Enzyme Inhibitors——EEvolving Next Future Therapiesvolving Next Future Therapies
Viral Enzyme Inhibitors
Protease
PolymeraseSTAT-C
Specifically targeted Anti-viral therapy for
HCV
NS5A
Graphic courtesy of Dr. Ira Jacobson.
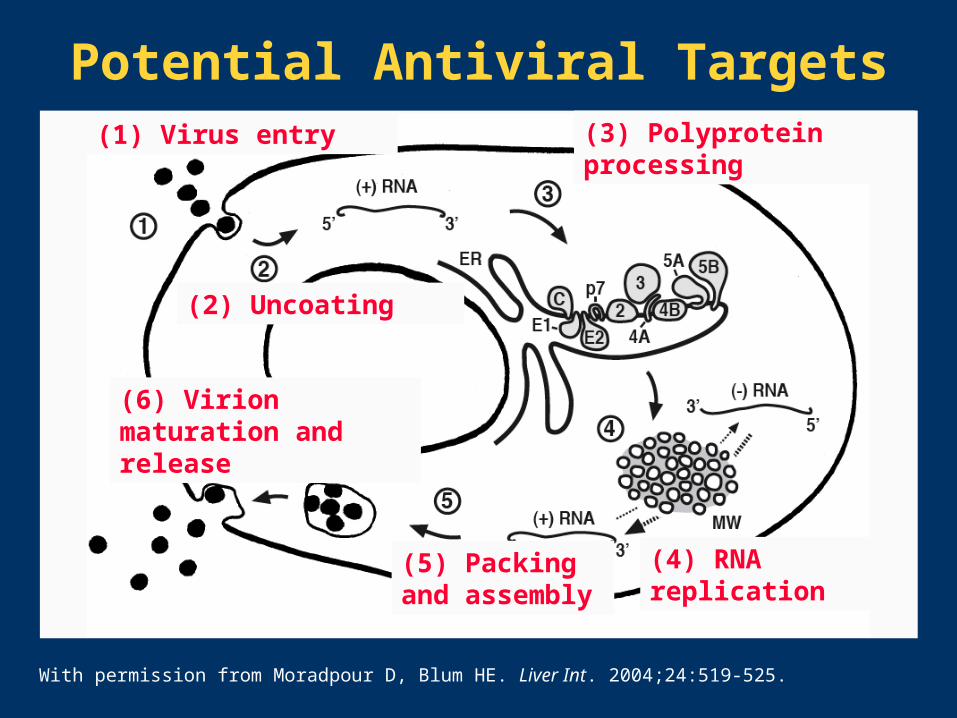
With permission from Moradpour D, Blum HE. Liver Int. 2004;24:519-525.
(1) Virus entry
(2) Uncoating
(3) Polyprotein processing
(4) RNA replication(5) Packing and assembly
(6) Virion maturation and release
Potential Antiviral Targets
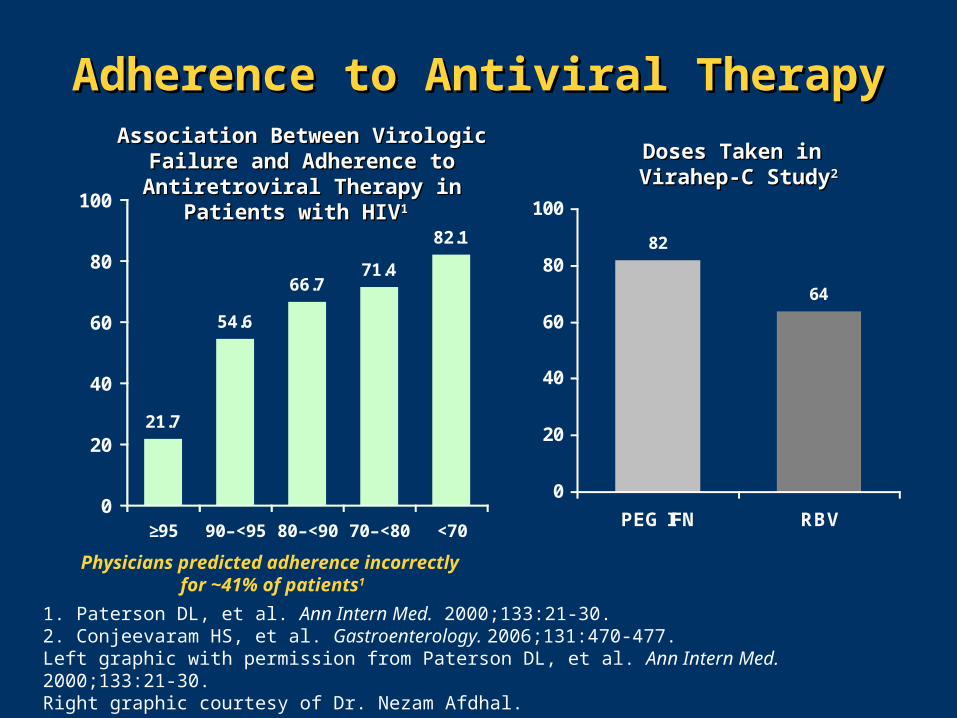
Doses Taken in Doses Taken in Virahep-C StudyVirahep-C Study22
Physicians predicted adherence incorrectly for ~41% of patients1
Association Between Virologic Failure Association Between Virologic Failure and Adherence to Antiretroviral and Adherence to Antiretroviral Therapy in Patients with HIVTherapy in Patients with HIV11
1. Paterson DL, et al. Ann Intern Med. 2000;133:21-30. 2. Conjeevaram HS, et al. Gastroenterology. 2006;131:470-477. Left graphic with permission from Paterson DL, et al. Ann Intern Med. 2000;133:21-30.Right graphic courtesy of Dr. Nezam Afdhal.
21.7
54.6
66.771.4
82.1
0
20
40
60
80
100
≥95 90–<95 80–<90 70–<80 <70
Patients with Virologic Failure (%)
82
64
0
20
40
60
80
100
PEG IFN RBVPatients with >80% Doses Taken (%)
Adherence to Antiviral TherapyAdherence to Antiviral Therapy
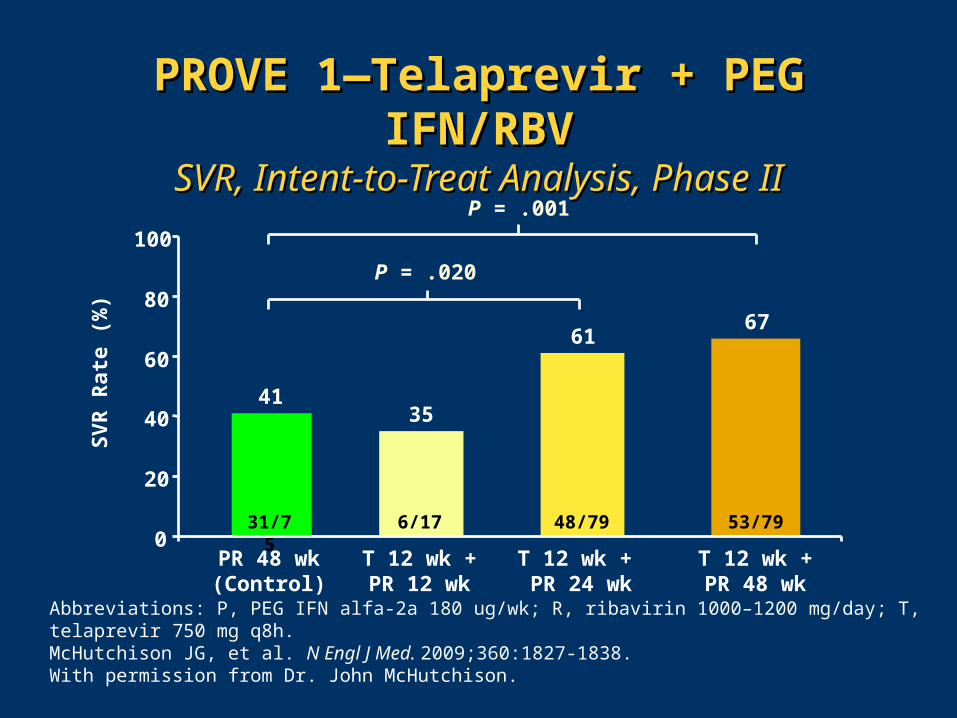
PROVE 1PROVE 1—T—Telaprevir + PEG IFN/RBVelaprevir + PEG IFN/RBVSVR, Intent-to-Treat Analysis, Phase IISVR, Intent-to-Treat Analysis, Phase II
0
20
40
60
80
100
SV
R R
ate
(%)
41
31/75
PR 48 wk(Control)
35
6/17
T 12 wk +PR 12 wk
61
48/79
T 12 wk + PR 24 wk
67
53/79
T 12 wk + PR 48 wk
P = .001
P = .020
Abbreviations: P, PEG IFN alfa-2a 180 ug/wk; R, ribavirin 1000–1200 mg/day; T, telaprevir 750 mg q8h.McHutchison JG, et al. N Engl J Med. 2009;360:1827-1838.With permission from Dr. John McHutchison.
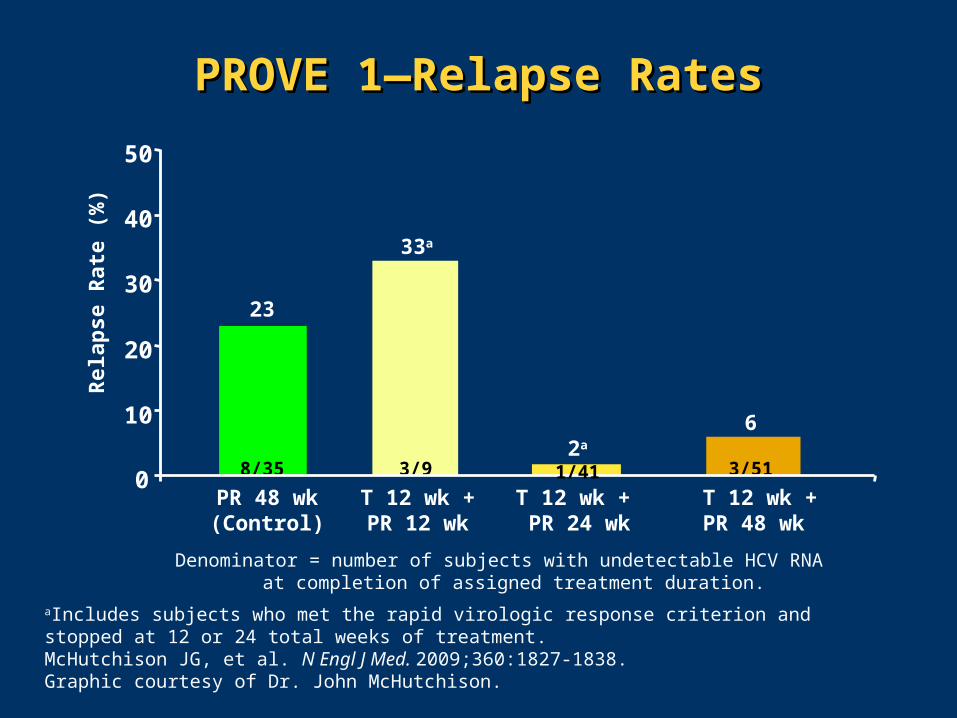
PROVE 1PROVE 1—R—Relapse Rateselapse Rates
0
10
20
30
40
50
Rel
apse
Rat
e (%
)
23
8/35
33a
3/92a
6
3/51
PR 48 wk(Control)
T 12 wk +PR 12 wk
T 12 wk + PR 24 wk
T 12 wk +PR 48 wk
aIncludes subjects who met the rapid virologic response criterion and stopped at 12 or 24 total weeks of treatment.McHutchison JG, et al. N Engl J Med. 2009;360:1827-1838.Graphic courtesy of Dr. John McHutchison.
Denominator = number of subjects with undetectable HCV RNA at completion of assigned treatment duration.
1/41
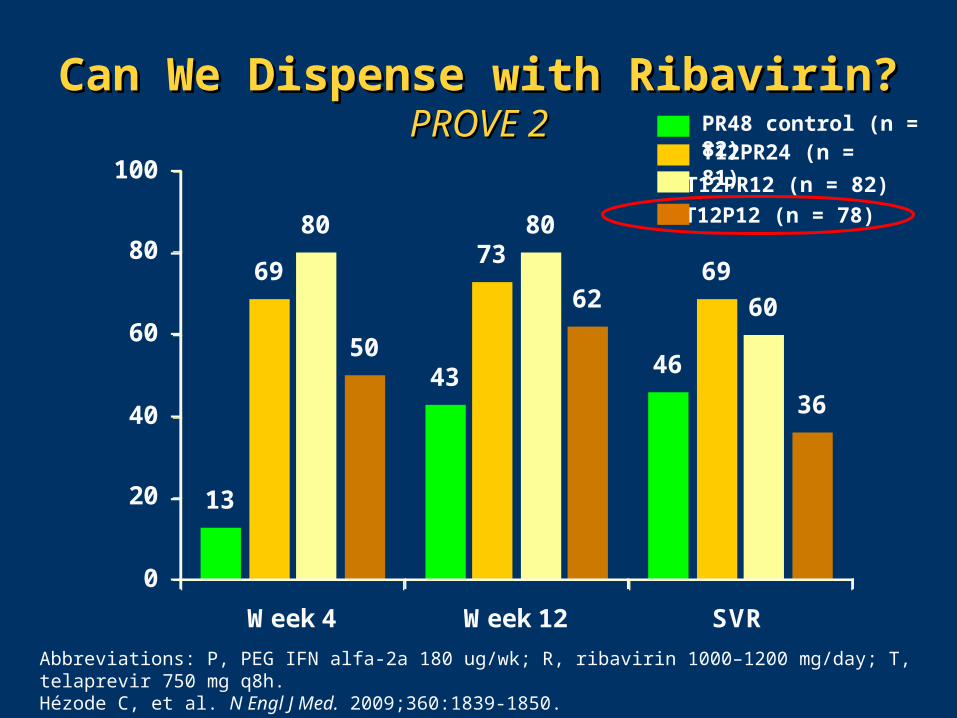
Can We Dispense with Ribavirin?Can We Dispense with Ribavirin?PROVE 2PROVE 2
13
43 46
6973
69
80 80
60
50
62
36
0
20
40
60
80
100
Week 4 Week 12 SVR
Patients with Virologic Response (%)
PR48 control (n = 82)T12PR24 (n = 81)
T12PR12 (n = 82)
Abbreviations: P, PEG IFN alfa-2a 180 ug/wk; R, ribavirin 1000–1200 mg/day; T, telaprevir 750 mg q8h.Hézode C, et al. N Engl J Med. 2009;360:1839-1850.
T12P12 (n = 78)
Wk 72Start Wk 4 Wk 12a Wk 28 Wk 48
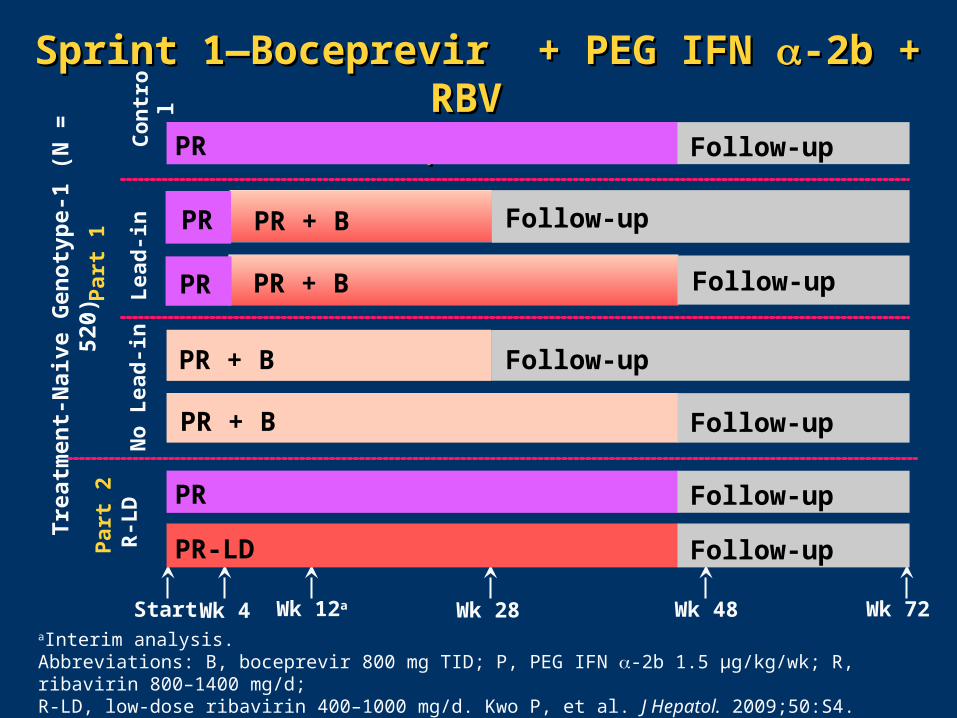
Sprint 1—Boceprevir + PEG IFN Sprint 1—Boceprevir + PEG IFN -2b + RBV -2b + RBV Phase II, Part 1 and 2Phase II, Part 1 and 2
Tre
atm
en
t-N
aiv
e G
en
oty
pe-
1 (
N =
520
)
aInterim analysis.Abbreviations: B, boceprevir 800 mg TID; P, PEG IFN -2b 1.5 µg/kg/wk; R, ribavirin 800–1400 mg/d; R-LD, low-dose ribavirin 400–1000 mg/d. Kwo P, et al. J Hepatol. 2009;50:S4.
No
Lea
d-i
nC
on
tro
lFollow-upPR
Follow-upPR PR + B
Follow-upPR PR + B
Follow-upPR + B
Follow-upPR + B
Lea
d-i
n
Par
t 1
Follow-upPR
Follow-upPR-LDR-L
D
Par
t 2
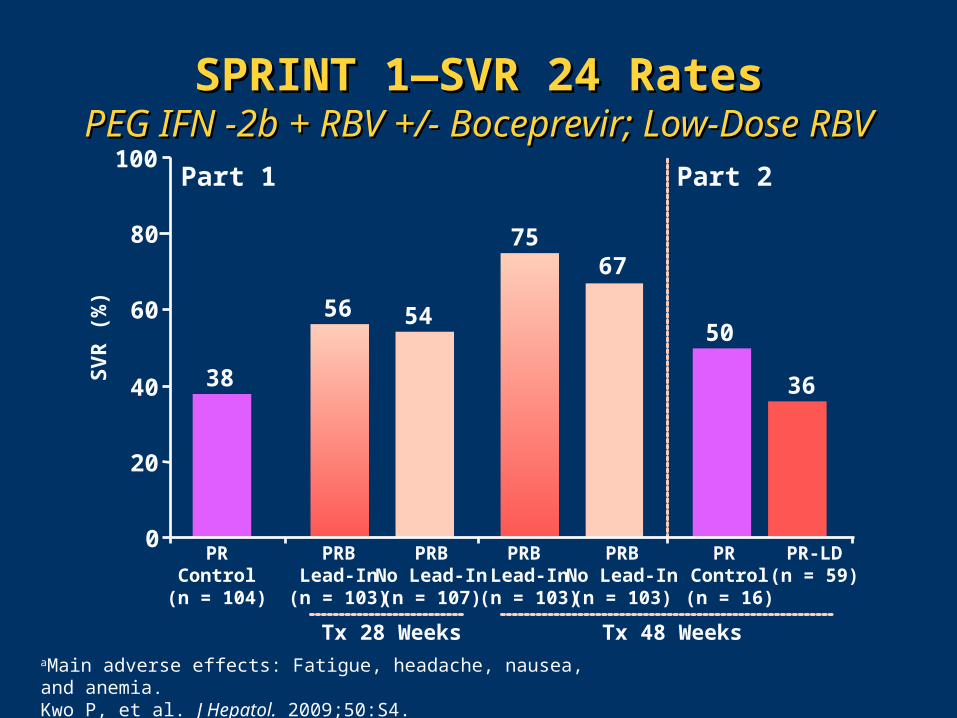
SPRINT 1SPRINT 1—S—SVR 24 RatesVR 24 RatesPEG IFN -2b + RBVPEG IFN -2b + RBV +/-+/- Boceprevir; Low-Dose RBVBoceprevir; Low-Dose RBV
38
56
75
54
67
0
20
40
60
80
100
SV
R (
%)
PRB Lead-In(n = 103)
PRBNo Lead-In(n = 103)
PRBLead-In(n = 103)
PRBNo Lead-In(n = 107)
PRControl(n = 104)
Tx 28 Weeks Tx 48 Weeks
50
36
PR Control(n = 16)
PR-LD(n = 59)
Part 2Part 1
aMain adverse effects: Fatigue, headache, nausea, and anemia.Kwo P, et al. J Hepatol. 2009;50:S4.

SPRINT 1SPRINT 1—S—SVR 24 in Those Who VR 24 in Those Who Achieved RVRAchieved RVR
100
82
94
74
84
0
20
40
60
80
100
SV
R (
%)
PRControl(n = 104)
PRB Lead-In(n = 103)
PRBNo Lead-In(n = 103)
PRBLead-In(n = 103)
PRBNo Lead-In(n = 107)
Tx 28 Weeks Tx 48 Weeks
Kwo P, et al. J Hepatol. 2009;50:S4.
32/3832/3862/6662/6632/4332/4354/6654/668/88/8

SPRINT 1SPRINT 1—V—Virologic Breakthroughirologic Breakthrough
0
45
7
12
0
5
10
15
20
PRB Lead-In(n = 103)
PRBNo Lead-In(n = 103)
PRBLead-In(n = 103)
PRBNo Lead-In(n = 107)
Pat
ien
ts w
ith
Bre
akth
rou
gh
(%
)
PRControl(n = 104)
Tx 28 Weeks Tx 48 Weeks
Kwo P, et al. J Hepatol. 2009;50:S4.
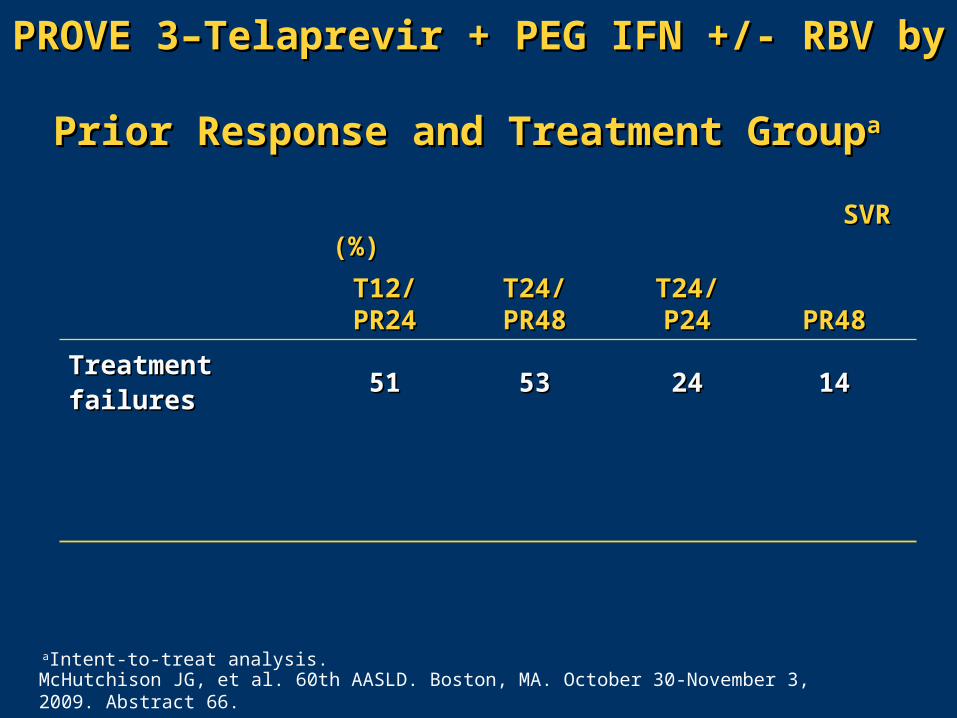
PROVE 3–Telaprevir + PEG IFN +/- RBV by PROVE 3–Telaprevir + PEG IFN +/- RBV by Prior Response and Treatment GroupPrior Response and Treatment Groupaa
SVR (%)SVR (%)
T12/T12/PR24PR24
T24/T24/PR48PR48
T24/T24/P24P24 PR48PR48
Treatment failuresTreatment failures 5151 5353 2424 1414
McHutchison JG, et al. 60th AASLD. Boston, MA. October 30-November 3, 2009. Abstract 66.aIntent-to-treat analysis.
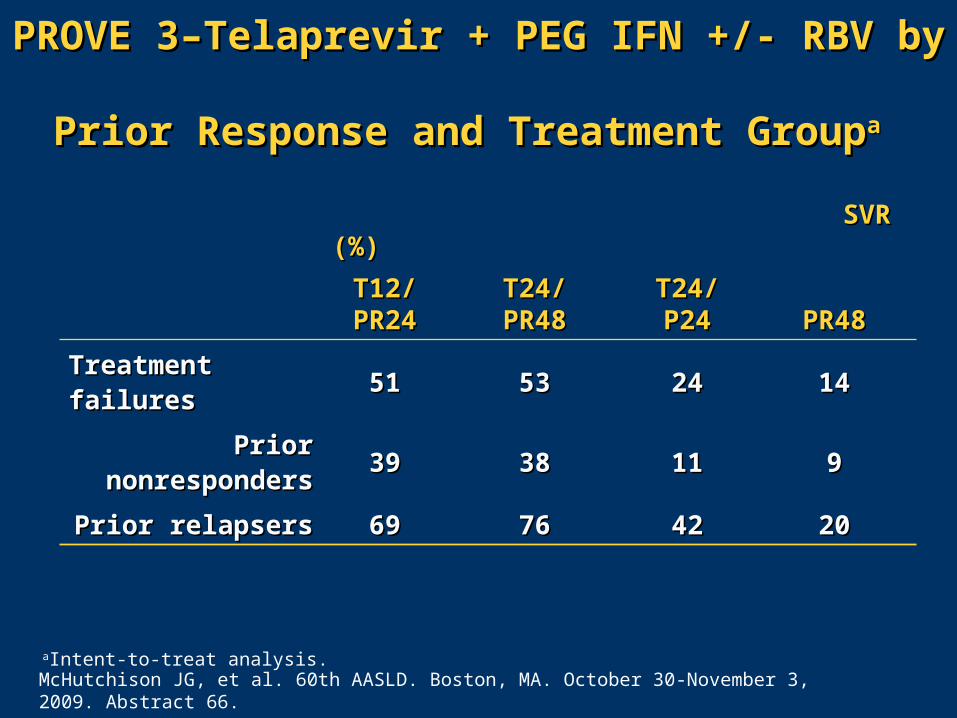
PROVE 3–Telaprevir + PEG IFN +/- RBV by PROVE 3–Telaprevir + PEG IFN +/- RBV by Prior Response and Treatment GroupPrior Response and Treatment Groupaa
SVR (%)SVR (%)
T12/T12/PR24PR24
T24/T24/PR48PR48
T24/T24/P24P24 PR48PR48
Treatment failuresTreatment failures 5151 5353 2424 1414
Prior Prior nonrespondersnonresponders
3939 3838 1111 99
Prior relapsersPrior relapsers 6969 7676 4242 2020
McHutchison JG, et al. 60th AASLD. Boston, MA. October 30-November 3, 2009. Abstract 66.aIntent-to-treat analysis.
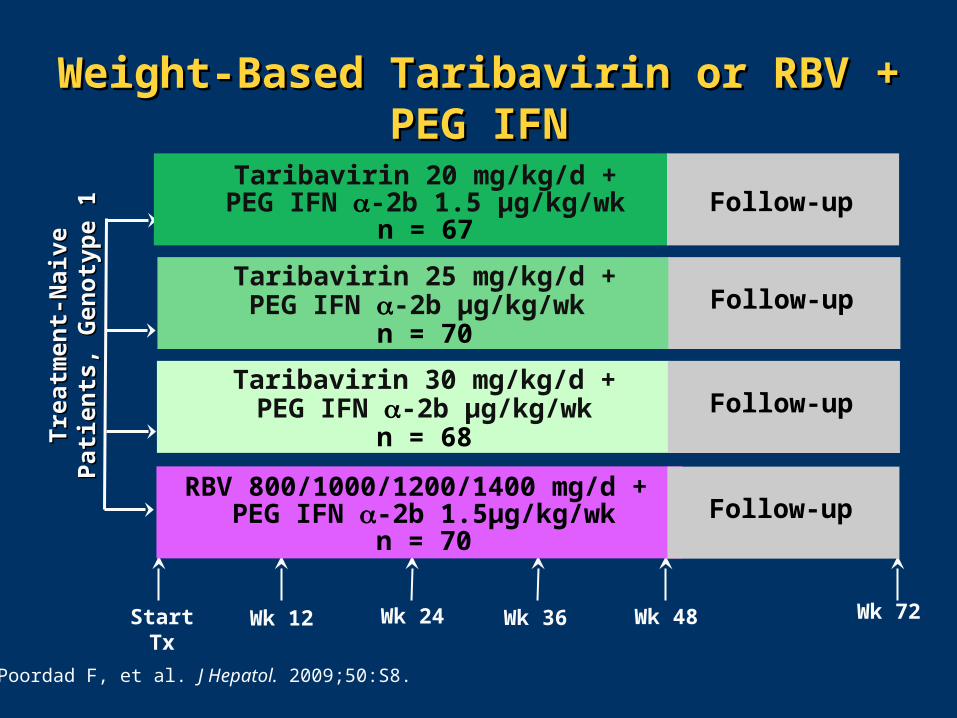
Weight-Based Taribavirin or RBV + PEG IFNWeight-Based Taribavirin or RBV + PEG IFNPhase IIb Study DesignPhase IIb Study Design
Wk 72Start Tx Wk 12 Wk 24 Wk 36 Wk 48
Tre
atm
ent-
Nai
ve P
atie
nts
, T
reat
men
t-N
aive
Pat
ien
ts,
Gen
oty
pe
1G
eno
typ
e 1
Poordad F, et al. J Hepatol. 2009;50:S8.
Taribavirin 25 mg/kg/d +PEG IFN -2b µg/kg/wk
n = 70Follow-up
Taribavirin 20 mg/kg/d +PEG IFN -2b 1.5 µg/kg/wk
n = 67Follow-up
Taribavirin 30 mg/kg/d +PEG IFN -2b µg/kg/wk
n = 68Follow-up
RBV 800/1000/1200/1400 mg/d + PEG IFN -2b 1.5µg/kg/wk
n = 70Follow-up
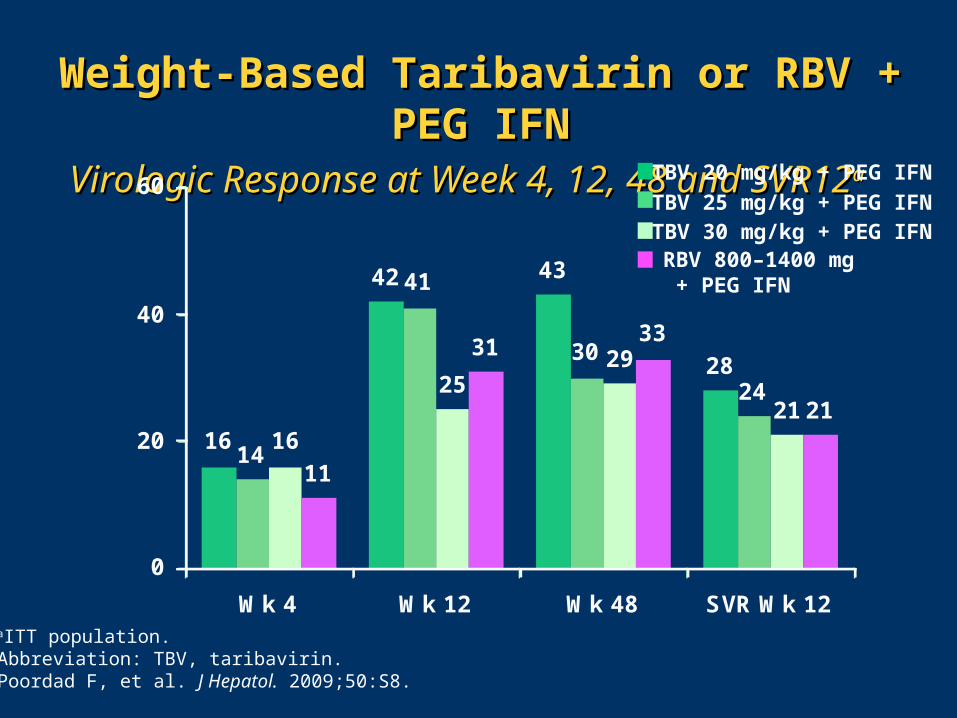
Weight-Based Taribavirin or RBV + PEG IFNWeight-Based Taribavirin or RBV + PEG IFNVirologic Response at Week 4, 12, 48 and SVR12Virologic Response at Week 4, 12, 48 and SVR12aa
16
42 43
28
14
41
30
24
16
2529
21
11
3133
21
0
20
40
60
Wk 4 Wk 12 Wk 48 SVR Wk 12
Patients with Undetectable
HCV RNA (%)
aITT population.Abbreviation: TBV, taribavirin.Poordad F, et al. J Hepatol. 2009;50:S8.
TBV 20 mg/kg + PEG IFN
TBV 25 mg/kg + PEG IFNTBV 30 mg/kg + PEG IFNRBV 800–1400 mg + PEG IFN
913 13
711
161519
2824
3033
0
20
40
60
Wk 12 Wk 24 Wk 48
Patients with Hb <10 g/dL (%)
Poordad F, et al. J Hepatol. 2009;50:S8.
TBV 20 mg/kg + PEG IFN
TBV 25 mg/kg + PEG IFNTBV 30 mg/kg + PEG IFNRBV 800–1400 mg + PEG IFN
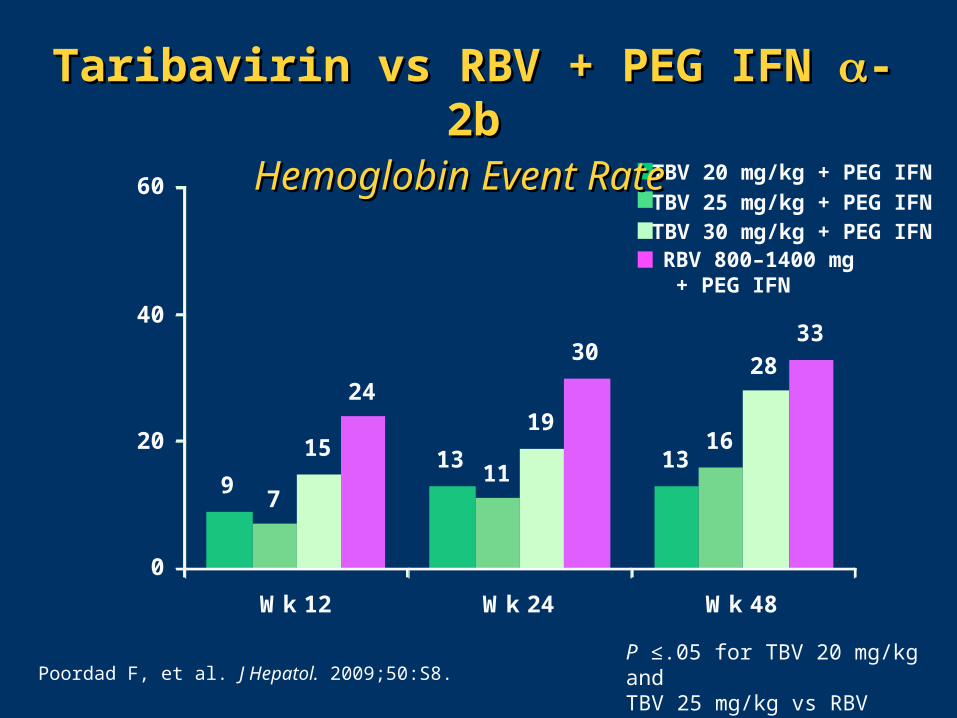
Taribavirin vs RBV + PEG IFN Taribavirin vs RBV + PEG IFN -2b-2bHemoglobin Event RateHemoglobin Event Rate
P ≤.05 for TBV 20 mg/kg and TBV 25 mg/kg vs RBV
40 WkDay 1 Day 4 Day 7 Day 14
Tre
atm
en
t-N
aiv
e G
en
oty
pe-
1
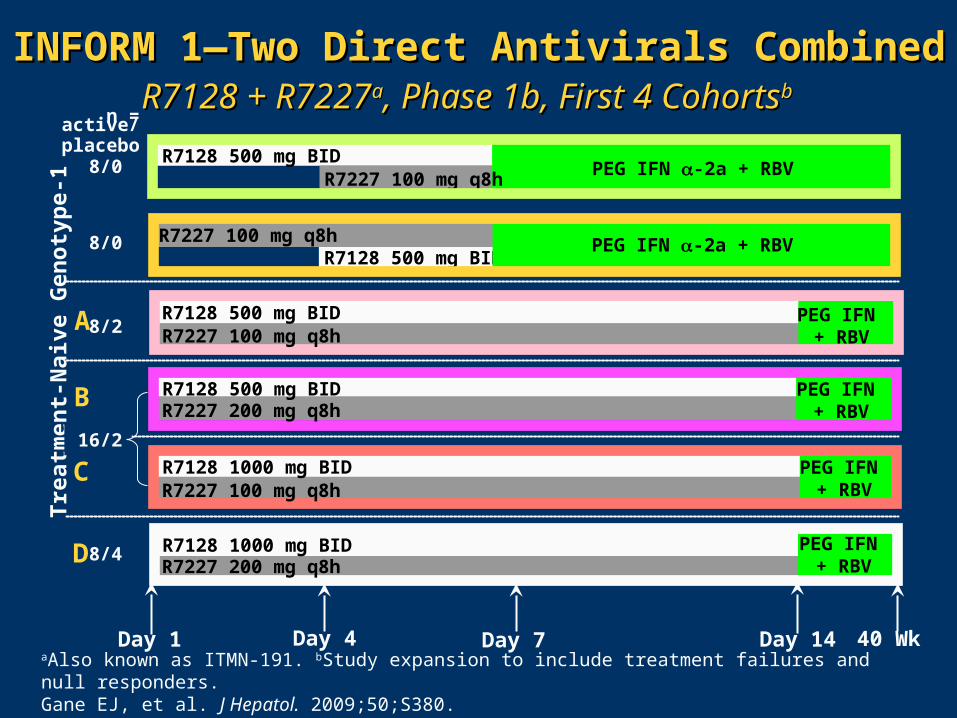
INFORM 1—Two Direct Antivirals CombinedINFORM 1—Two Direct Antivirals CombinedR7128 + R7227R7128 + R7227aa, Phase 1b, First 4 Cohorts, Phase 1b, First 4 Cohortsbb
R7128 500 mg BIDR7227 100 mg q8h
R7128 500 mg BIDR7227 200 mg q8h
R7128 1000 mg BIDR7227 100 mg q8h
R7128 1000 mg BIDR7227 200 mg q8h
R7128 500 mg BIDR7227 100 mg q8h
R7128 500 mg BIDR7227 100 mg q8h
n = active/placebo
8/0
8/0
8/2
8/4
A
B
C
D
16/2
PEG IFN -2a + RBV
PEG IFN -2a + RBV
PEG IFN + RBV
PEG IFN + RBV
PEG IFN + RBV
PEG IFN + RBV
aAlso known as ITMN-191. bStudy expansion to include treatment failures and null responders.Gane EJ, et al. J Hepatol. 2009;50;S380.
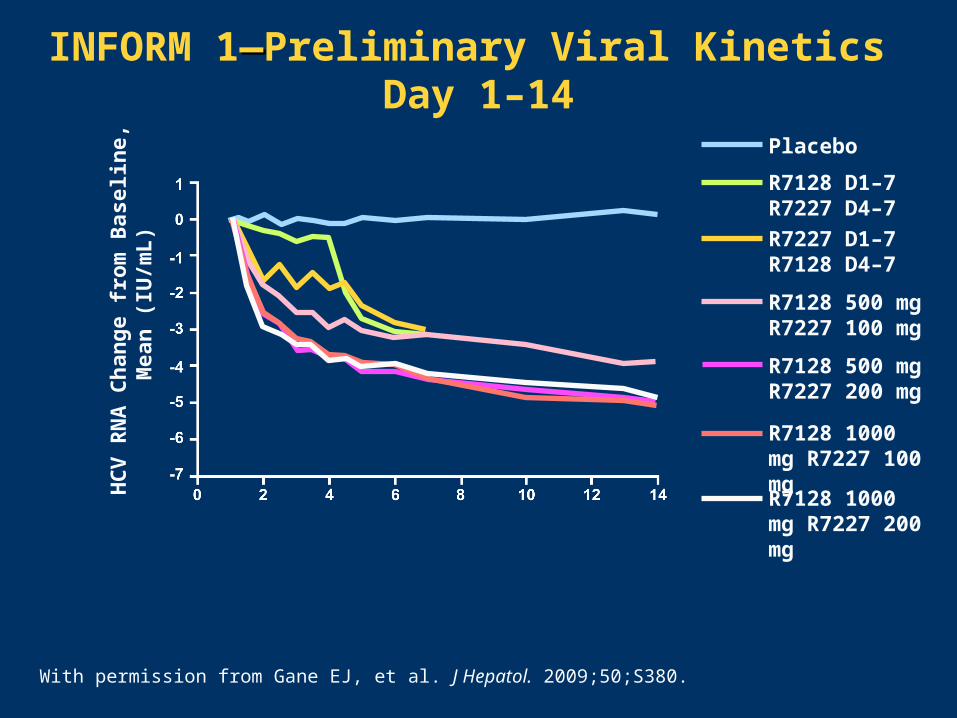
INFORM 1——Preliminary Viral Kinetics Day 1–14
HC
V R
NA
Ch
ang
e fr
om
Bas
elin
e,
Mea
n (
IU/m
L)
Placebo
R7128 D1–7 R7227 D4–7
R7227 D1–7 R7128 D4–7
R7128 500 mg R7227 100 mg
R7128 500 mg R7227 200 mg
R7128 1000 mg R7227 100 mg
R7128 1000 mg R7227 200 mg
With permission from Gane EJ, et al. J Hepatol. 2009;50;S380.
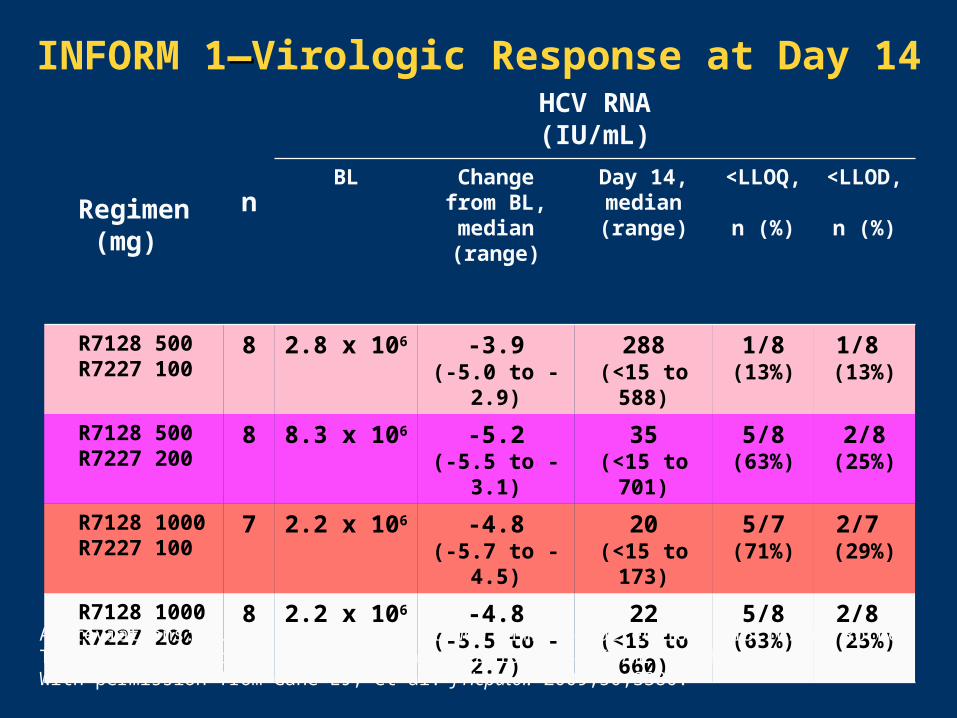
Regimen (mg)
n
HCV RNA(IU/mL)
BL Change from BL, median
(range)
Day 14, median (range)
<LLOQ,
n (%)
<LLOD, n (%)
R7128 500 R7227 100
8 2.8 x 10⁶ -3.9(-5.0 to -2.9)
288(<15 to 588)
1/8(13%)
1/8 (13%)
R7128 500 R7227 200
8 8.3 x 10⁶ -5.2(-5.5 to -3.1)
35(<15 to 701)
5/8(63%)
2/8(25%)
R7128 1000R7227 100
7 2.2 x 10⁶ -4.8(-5.7 to -4.5)
20(<15 to 173)
5/7(71%)
2/7 (29%)
R7128 1000R7227 200
8 2.2 x 10⁶ -4.8(-5.5 to -2.7)
22(<15 to 660)
5/8(63%)
2/8 (25%)
INFORM 1——Virologic Response at Day 14
Abbreviations: BL, baseline; LLOD, lower limit of detection (<15 IU/mL, Roche Taqman); LLOQ, lower limit of quantification (<40 IU/mL, Roche Taqman).With permission from Gane EJ, et al. J Hepatol. 2009;50;S380.
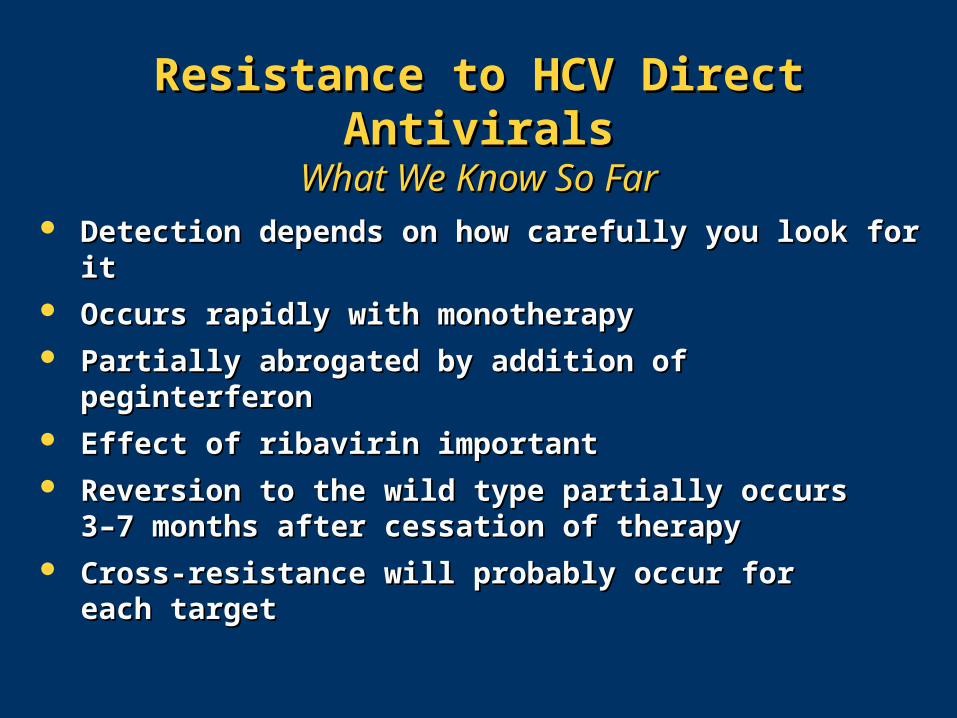
Resistance to HCV Direct AntiviralsResistance to HCV Direct AntiviralsWhat We Know So FarWhat We Know So Far
Detection depends on how carefully you look for itDetection depends on how carefully you look for it Occurs rapidly with monotherapyOccurs rapidly with monotherapy Partially abrogated by addition of peginterferonPartially abrogated by addition of peginterferon Effect of ribavirin importantEffect of ribavirin important Reversion to the wild type partially occurs Reversion to the wild type partially occurs
33––7 months after cessation of therapy7 months after cessation of therapy Cross-resistance will probably occur for Cross-resistance will probably occur for
each targeteach target
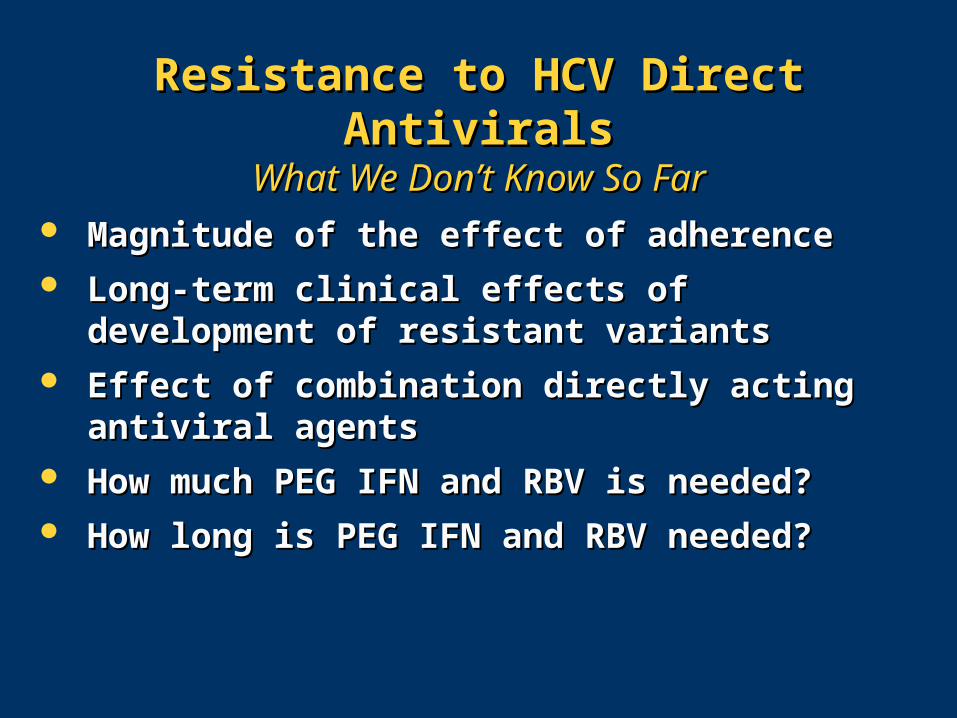
Resistance to HCV Direct AntiviralsResistance to HCV Direct AntiviralsWhat We DonWhat We Don’t’t Know So Far Know So Far
Magnitude of the effect of adherenceMagnitude of the effect of adherence Long-term clinical effects of development of Long-term clinical effects of development of
resistant variantsresistant variants Effect of combination directly acting antiviral Effect of combination directly acting antiviral
agentsagents How much PEG IFN and RBV is needed?How much PEG IFN and RBV is needed? How long is PEG IFN and RBV needed?How long is PEG IFN and RBV needed?
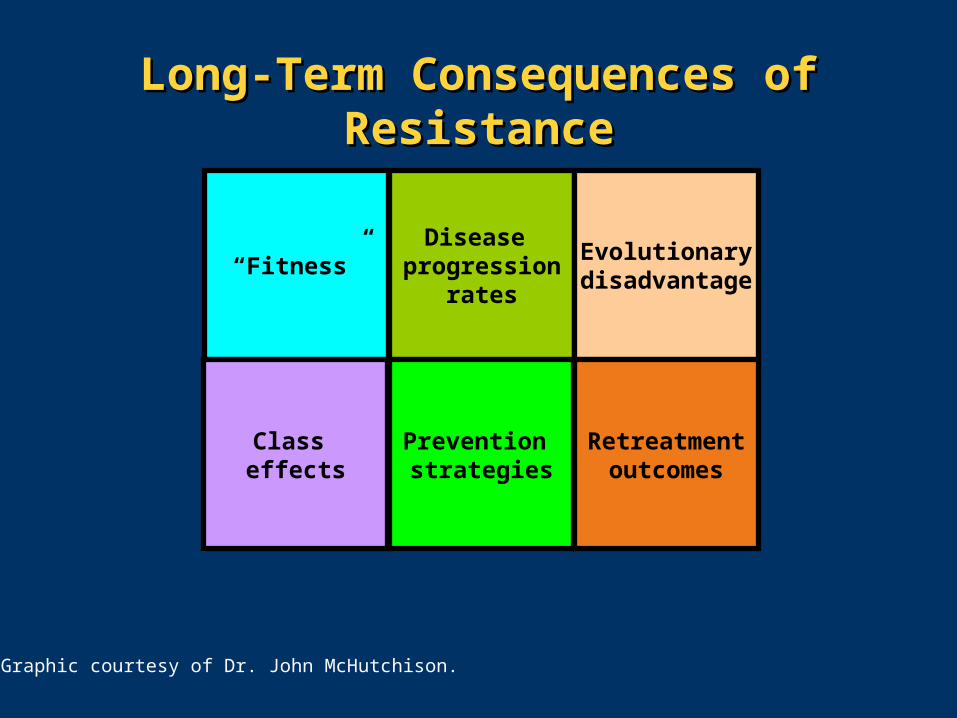
Long-Term Consequences of Long-Term Consequences of ResistanceResistance
“Fitness”Disease
progressionrates
Evolutionarydisadvantage
Retreatmentoutcomes
Prevention strategies
Class effects
Graphic courtesy of Dr. John McHutchison.
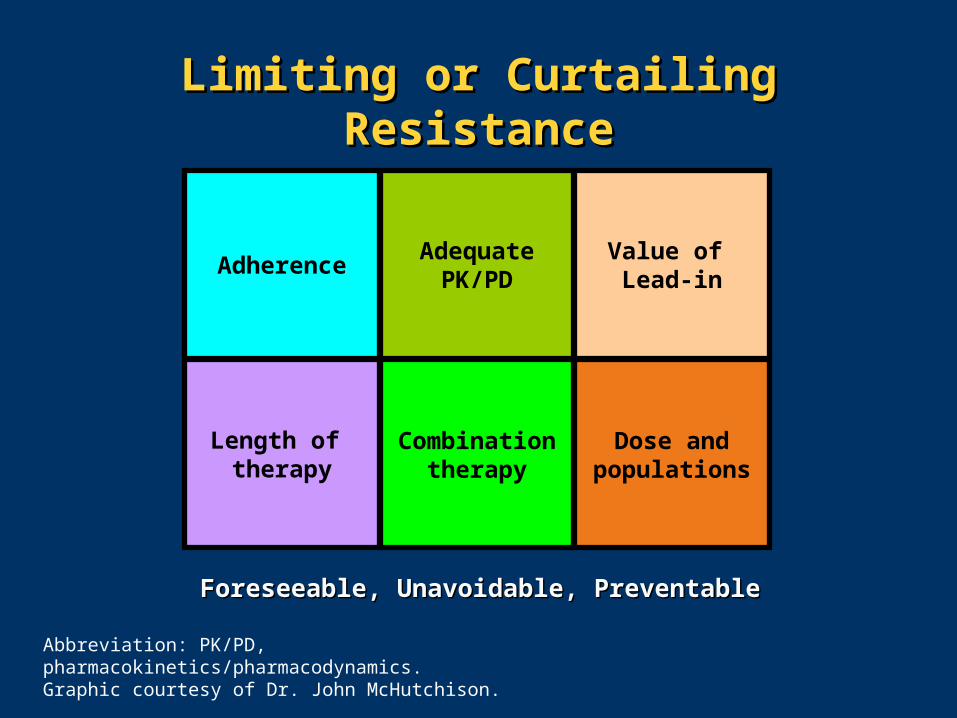
AdherenceAdequate
PK/PDValue of Lead-in
Dose andpopulations
Combinationtherapy
Length of therapy
Foreseeable, Unavoidable, PreventableForeseeable, Unavoidable, Preventable
Abbreviation: PK/PD, pharmacokinetics/pharmacodynamics.Graphic courtesy of Dr. John McHutchison.
Limiting or Curtailing ResistanceLimiting or Curtailing Resistance
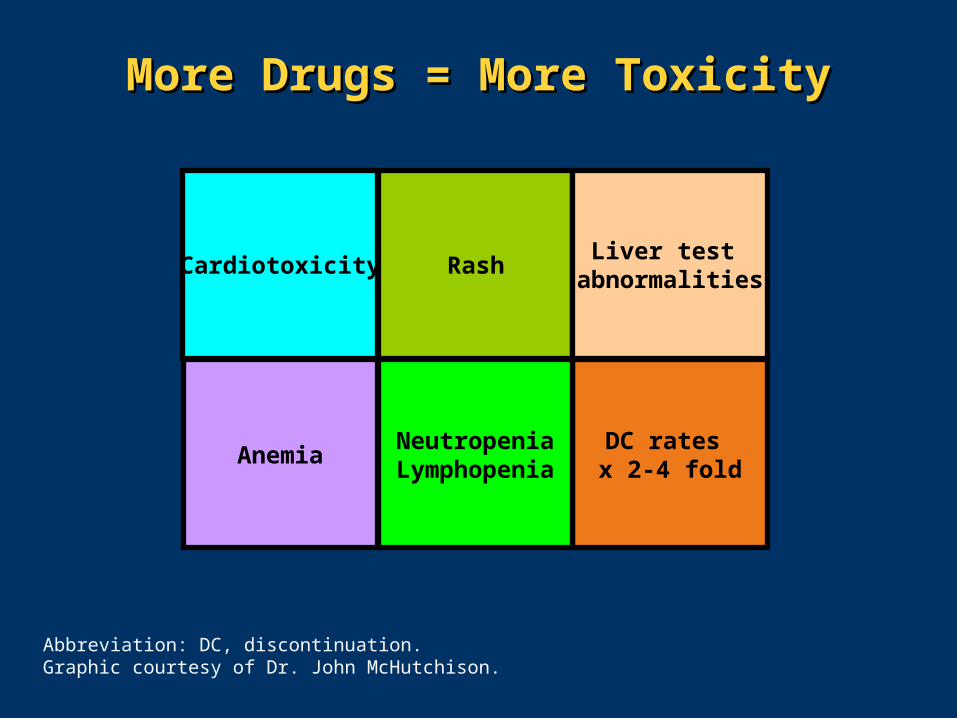
Cardiotoxicity RashLiver test
abnormalities
DC rates x 2-4 fold
NeutropeniaLymphopenia
Anemia
Abbreviation: DC, discontinuation.Graphic courtesy of Dr. John McHutchison.
More Drugs = More ToxicityMore Drugs = More Toxicity
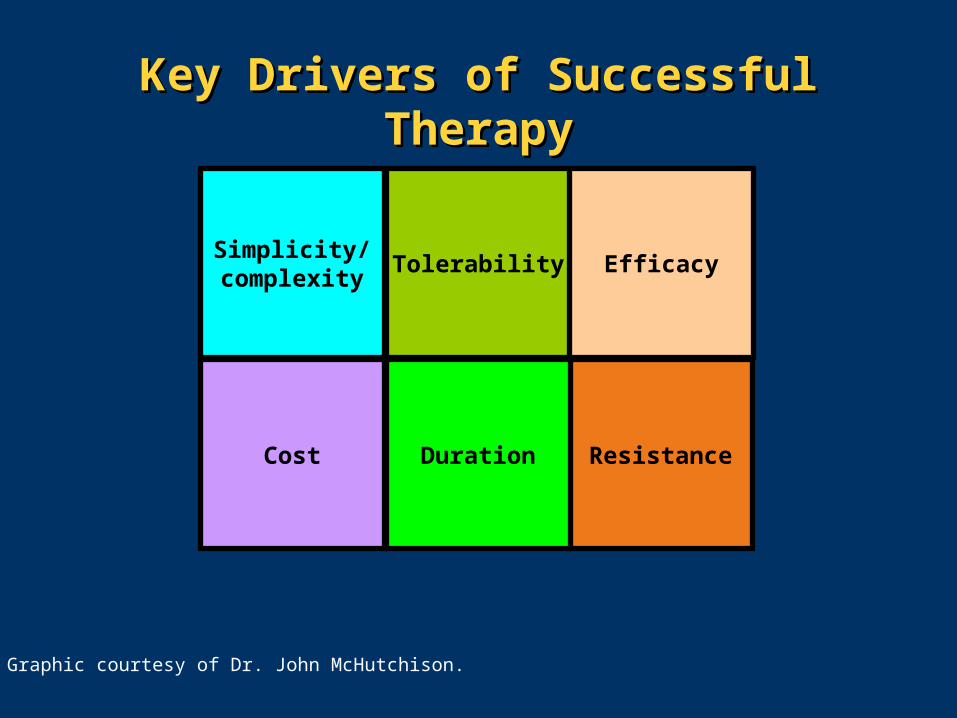
Simplicity/complexity
Tolerability Efficacy
ResistanceDurationCost
Graphic courtesy of Dr. John McHutchison.
Key Drivers of Successful TherapyKey Drivers of Successful Therapy
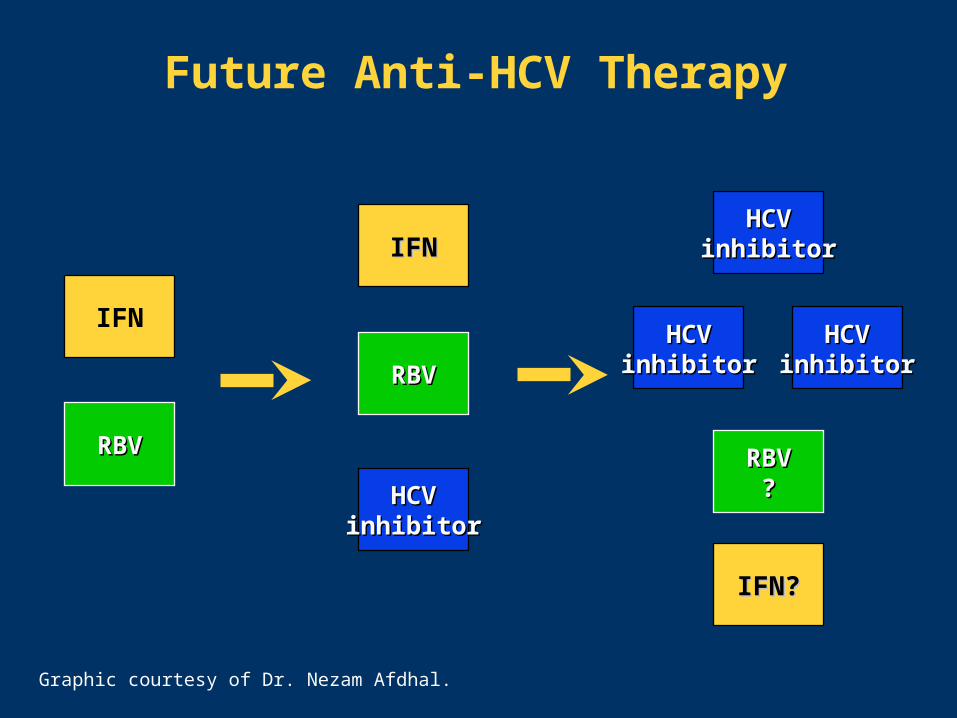
IFN
RBVRBV
IFNIFN
RBVRBV
HCVHCVinhibitorinhibitor
HCVHCVinhibitorinhibitor
HCVHCVinhibitorinhibitor
HCVHCVinhibitorinhibitor
RBVRBV??
Future Anti-HCV Therapy
IFN?IFN?
Graphic courtesy of Dr. Nezam Afdhal.
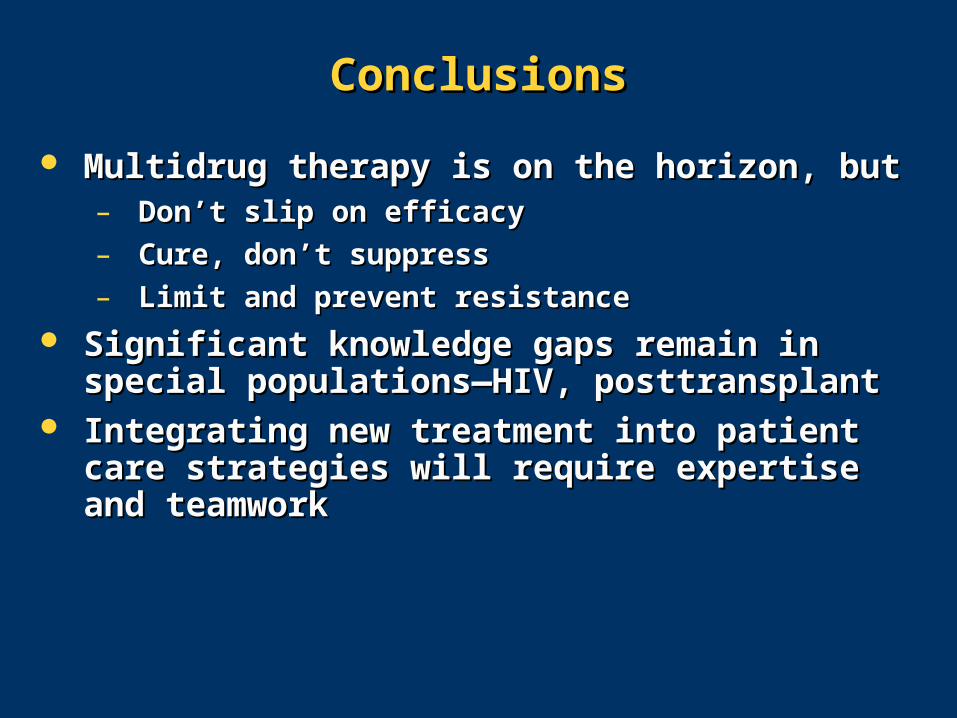
ConclusionsConclusions
Multidrug therapy is on the horizon, butMultidrug therapy is on the horizon, but– Don’t slip on efficacyDon’t slip on efficacy
– Cure, don’t suppressCure, don’t suppress
– Limit and prevent resistanceLimit and prevent resistance
Significant knowledge gaps remain in special Significant knowledge gaps remain in special populations—HIV, posttransplantpopulations—HIV, posttransplant
Integrating new treatment into patient care Integrating new treatment into patient care strategies will require expertise and strategies will require expertise and teamworkteamwork

Concluding RemarksConcluding Remarks
Ira M. Jacobson, MDIra M. Jacobson, MD
Vincent Astor Professor of MedicineVincent Astor Professor of MedicineChief, Division of Gastroenterology and HepatologyChief, Division of Gastroenterology and Hepatology
Medical Director of the Center for the StudyMedical Director of the Center for the Studyof Hepatitis Cof Hepatitis C
Weill Cornell Medical College Weill Cornell Medical College New York, New YorkNew York, New York
Phases in the Evolution of Anti-HCV Phases in the Evolution of Anti-HCV TherapyTherapy
The EmpiricPhase
The Phaseof
SpecificallyTargetedAntiviral Therapyfor HCV
(STAT-C)
Weisberg IW, et al. Current Hepatitis Reports. 2007;6:75-82. Graphic courtesy of Dr. Ira Jacobson.
The Final Phase—Small
MoleculeCombinations
???
• Optimal dosing• Viral kinetics• Challengingpopulations
• Nonresponders
TheRefinement
Phase
Less focus on which PEG IFNLess focus on which PEG IFN Response-guided therapy – principle clear but variable penetranceResponse-guided therapy – principle clear but variable penetrance Limited choices for nonresponders – huge unmet needLimited choices for nonresponders – huge unmet need Other populations with unmet needs aboundOther populations with unmet needs abound
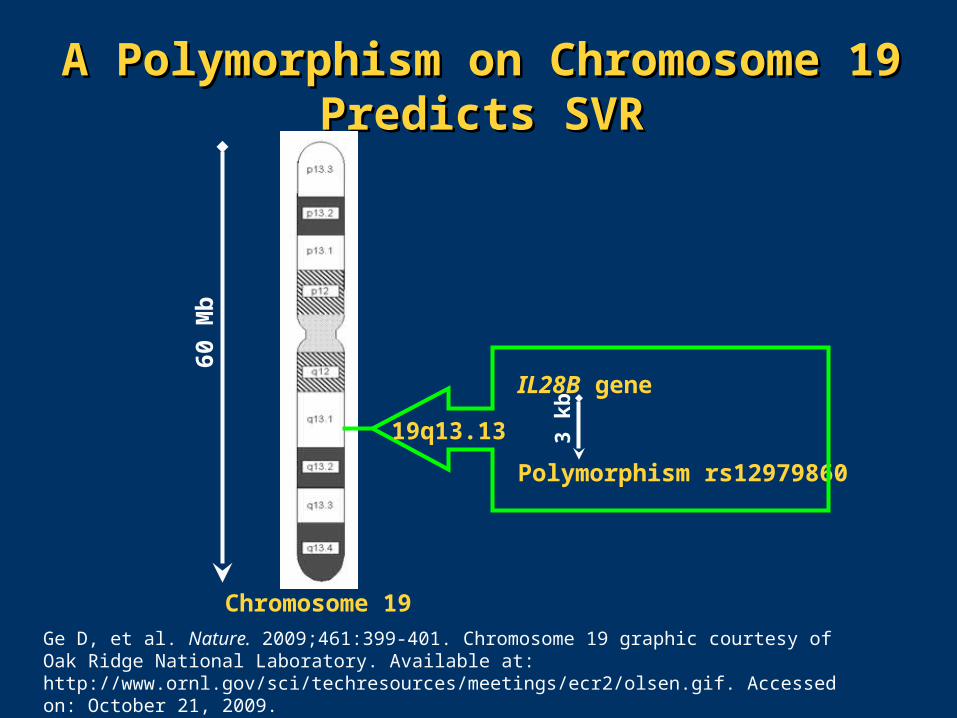
A Polymorphism on Chromosome 19 A Polymorphism on Chromosome 19 Predicts SVRPredicts SVR
60 M
b
Chromosome 19
Polymorphism rs12979860
IL28B gene
3 kb
19q13.13
Ge D, et al. Nature. 2009;461:399-401. Chromosome 19 graphic courtesy of Oak Ridge National Laboratory. Available at: http://www.ornl.gov/sci/techresources/meetings/ecr2/olsen.gif. Accessed on: October 21, 2009.
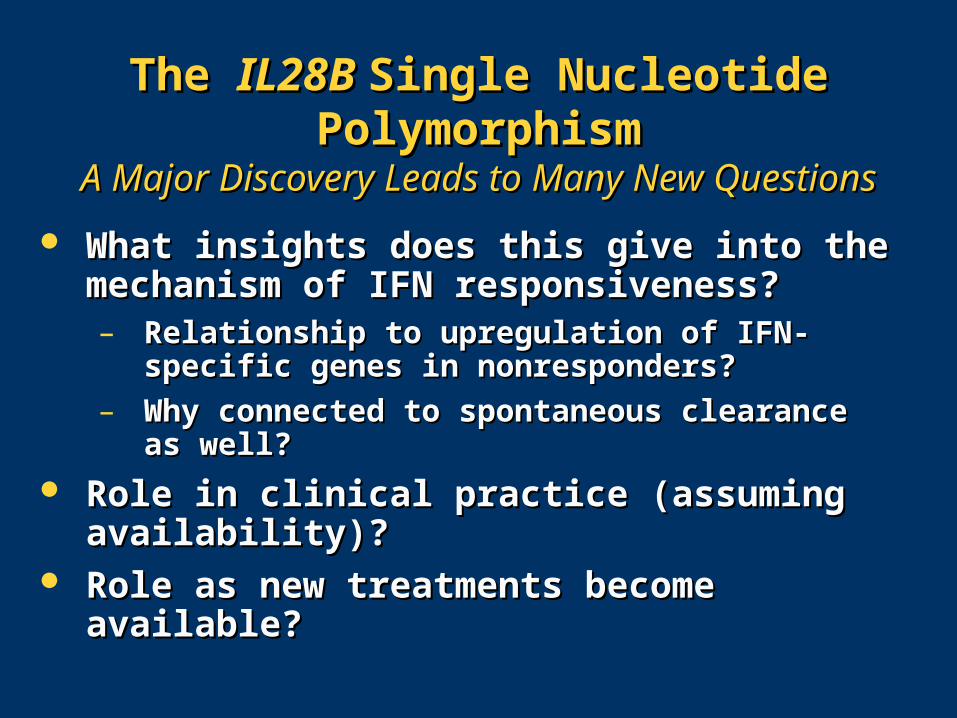
The The IL28B IL28B Single Nucleotide Single Nucleotide PolymorphismPolymorphism
A Major Discovery Leads to Many New QuestionsA Major Discovery Leads to Many New Questions
What insights does this give into the What insights does this give into the mechanism of IFN responsiveness?mechanism of IFN responsiveness?– Relationship to upregulation of IFN-specific Relationship to upregulation of IFN-specific
genes in nonresponders?genes in nonresponders?
– Why connected to spontaneous clearance Why connected to spontaneous clearance as well?as well?
Role in clinical practice (assuming Role in clinical practice (assuming availability)?availability)?
Role as new treatments become available?Role as new treatments become available?
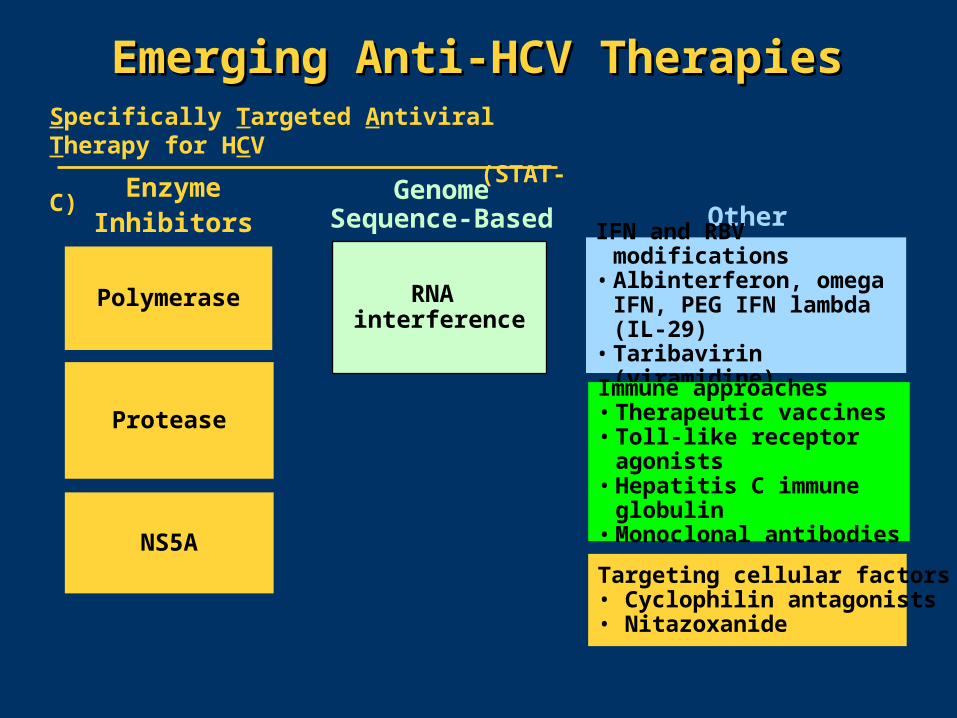
Emerging Anti-HCV TherapiesEmerging Anti-HCV Therapies
Genome Sequence-Based
RNA interference
EnzymeInhibitors
Protease
Polymerase
Other
IFN and RBV modifications• Albinterferon, omega IFN,
PEG IFN lambda (IL-29)• Taribavirin (viramidine)
Immune approaches• Therapeutic vaccines• Toll-like receptor agonists• Hepatitis C immune
globulin• Monoclonal antibodies
Targeting cellular factors• Cyclophilin antagonists• Nitazoxanide
Specifically Targeted Antiviral Therapy for HCV (STAT-C)
NS5A
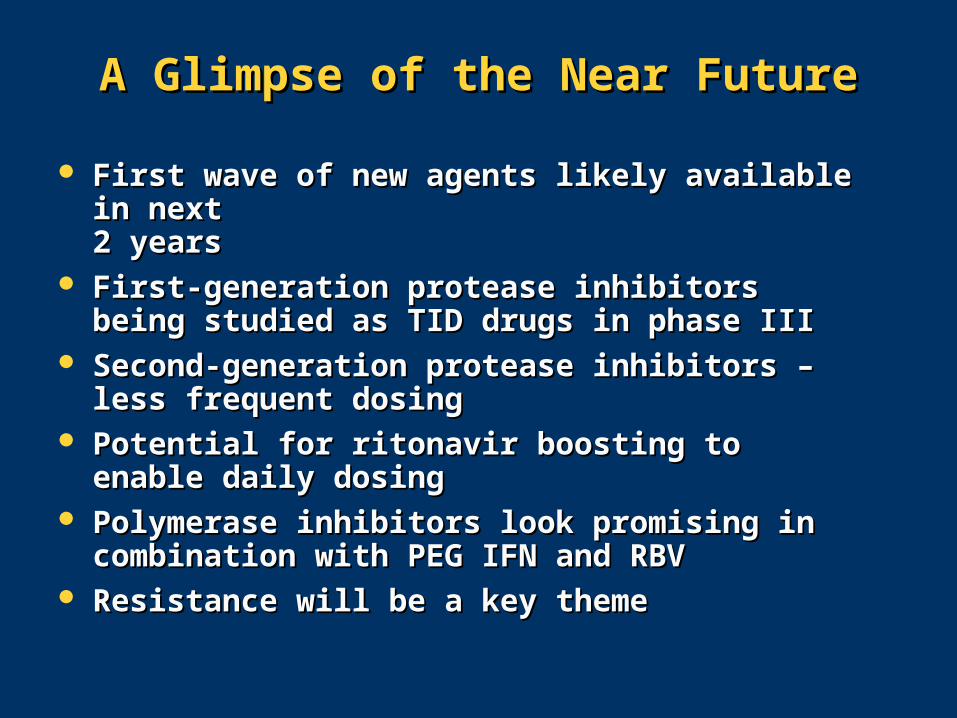
A Glimpse of the Near FutureA Glimpse of the Near Future
First wave of new agents likely available in next First wave of new agents likely available in next 2 years2 years
First-generation protease inhibitors being studied First-generation protease inhibitors being studied as TID drugs in phase IIIas TID drugs in phase III
Second-generation protease inhibitors – less Second-generation protease inhibitors – less frequent dosingfrequent dosing
Potential for ritonavir boosting to enable daily Potential for ritonavir boosting to enable daily dosingdosing
Polymerase inhibitors look promising in Polymerase inhibitors look promising in combination with PEG IFN and RBVcombination with PEG IFN and RBV
Resistance will be a key themeResistance will be a key theme
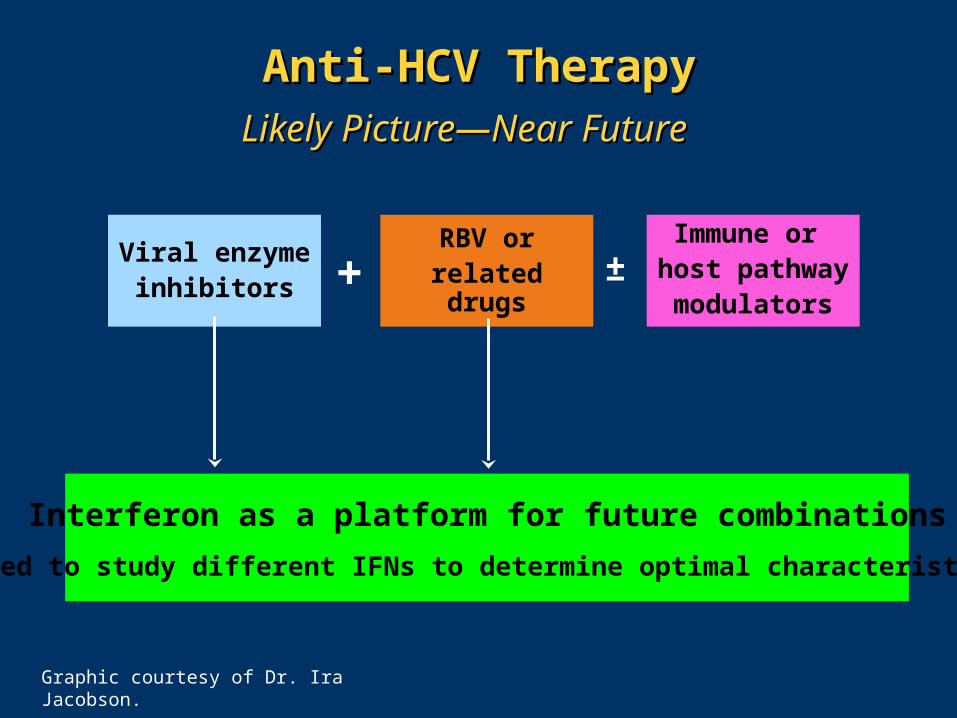
Anti-HCV TherapyAnti-HCV TherapyLikely Picture—Near FutureLikely Picture—Near Future
Viral enzymeinhibitors
Immune or host pathwaymodulators
RBV orrelated drugs+ ±
Interferon as a platform for future combinations
Need to study different IFNs to determine optimal characteristics
Graphic courtesy of Dr. Ira Jacobson.
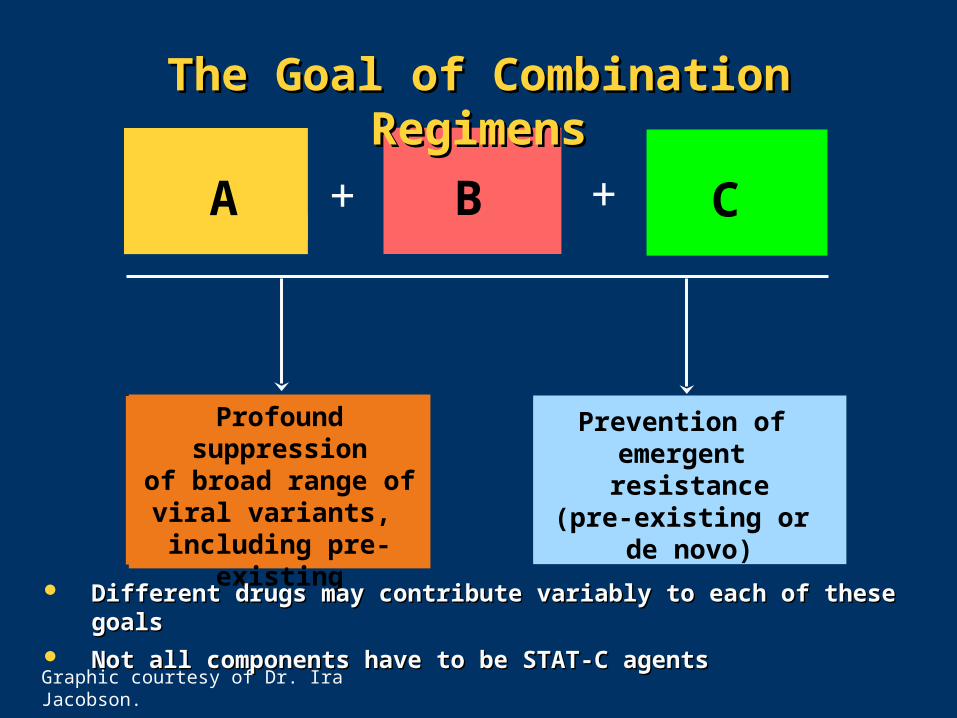
A B C
Prevention of emergent resistance
(pre-existing or de novo)
+ +A
Profound suppression
of broad range ofviral variants,
including pre-existing
Different drugs may contribute variably to each of these goalsDifferent drugs may contribute variably to each of these goals Not all components have to be STAT-C agentsNot all components have to be STAT-C agents
Graphic courtesy of Dr. Ira Jacobson.
The Goal of Combination RegimensThe Goal of Combination Regimens
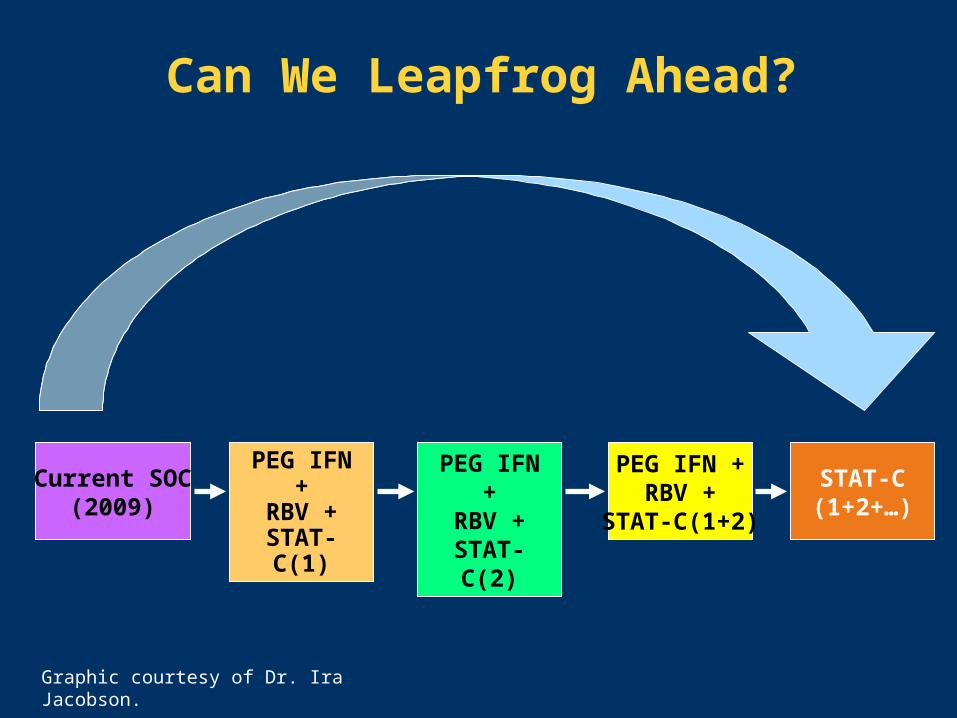
Current SOC(2009)
PEG IFN +RBV +
STAT-C(1)
PEG IFN +RBV +
STAT-C(2)
PEG IFN +RBV +
STAT-C(1+2)
STAT-C(1+2+…)
Can We Leapfrog Ahead?
Graphic courtesy of Dr. Ira Jacobson.
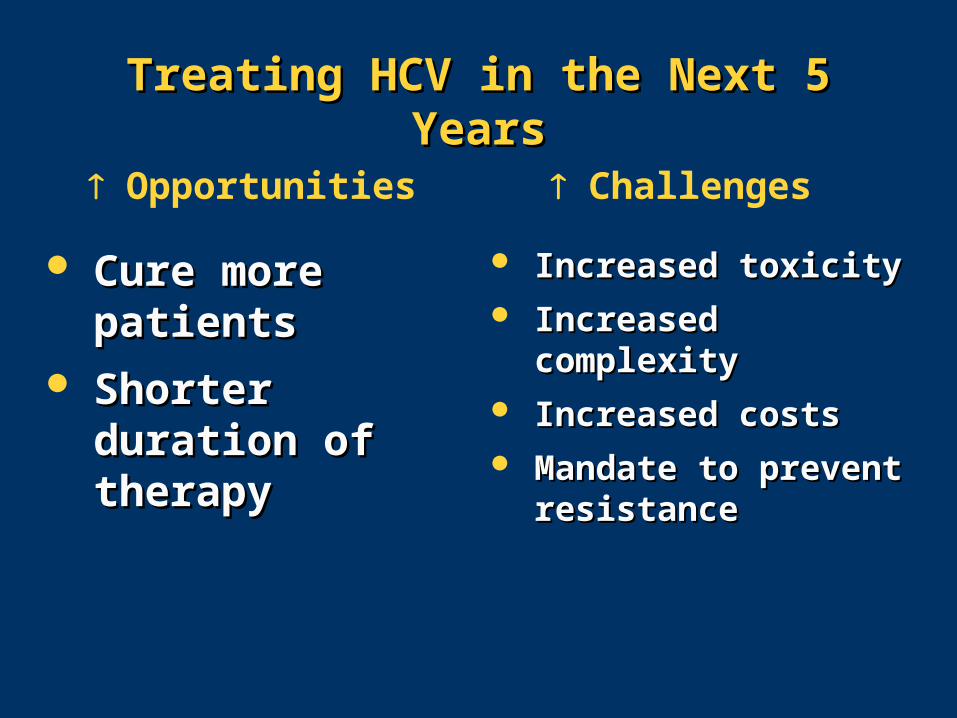
Treating HCV in the Next 5 YearsTreating HCV in the Next 5 Years
Cure more Cure more patientspatients
Shorter duration Shorter duration of therapyof therapy
Increased toxicityIncreased toxicity Increased Increased
complexitycomplexity Increased costsIncreased costs Mandate to prevent Mandate to prevent
resistanceresistance
Opportunities Challenges
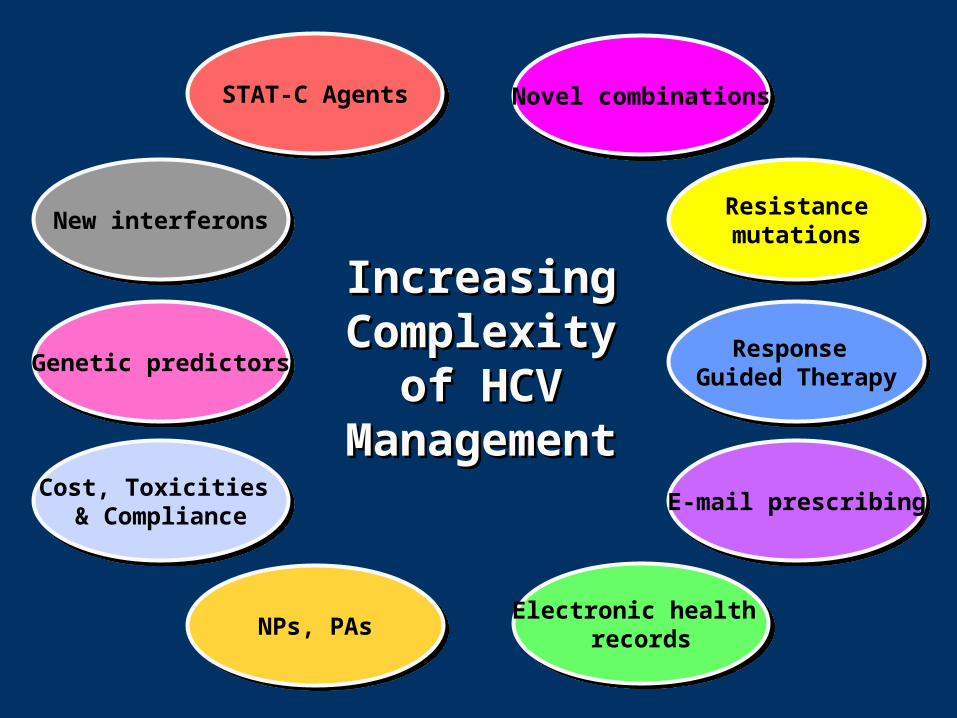
Electronic health records
Electronic health records
Resistancemutations
ResistancemutationsNew interferonsNew interferons
Cost, Toxicities & Compliance
Cost, Toxicities & Compliance
STAT-C AgentsSTAT-C Agents
Genetic predictorsGenetic predictors Response Guided Therapy
Response Guided Therapy
NPs, PAsNPs, PAs
Novel combinationsNovel combinations
E-mail prescribingE-mail prescribing
Increasing Increasing Complexity Complexity
of HCV of HCV ManagementManagement