Embed Size (px)
Citation preview
1 of 4
UNIVERSITY OF MANCHESTER VISUALIZATION APPLICATION
INFORMATION PACK
Introduction
Earlier this year Research IT requested feedback on a proposal to implement a ‘core research application
suite’ that would focus support, training and licence resources on a selected suite of applications chosen
to offer maximum value to University researchers. Based upon the feedback received it was clear that
there is demand for the implementation of a general purpose data visualization tool.
You have volunteered to participate in the evaluation of a set of candidate tools, with the objective of
selecting and deploying such a tool later this year. This information pack covers some of the details
required to proceed with the evaluation.
The remainder of this information pack provides details about the target space for consideration, the four
candidate application packages, links to software and training, some optional case study data for use in
the evaluation phase and finally an overview of the evaluation process, including a preview of the survey
questions and the link to the survey.
Visualization, Data Analysis and Data Analytics
The visualization application space is crowded with many potential candidates and this evaluation
focusses on the intermediate space between rudimentary visualization solutions e.g., Excel and those
regarded as providing high-end visualization and analytics e.g., R, Mathematica and Stata.
This class of software has typically been shaped by the needs of business intelligence and information
visualization and as such has capabilities to create visualizations that are interactive allowing for better
understanding and insights about the data. Data analytics enhances the visualization and data analysis
process by adding sophisticated tools to extract meaning, detect changes and unravel complex
relationships and as such is a major driver for investigation.
Candidate Applications
It is not feasible to conduct a selection exercise to cover all potential software applications, as such this
evaluation only considers market leaders and applications with prior local investment. The following
software packages have been elected for evaluation:
Tableau
Qlik
SpotFire
IBM Watson Analytics
2 of 4
Note: All four candidates provide cloud-enabled versions, where users can upload data to online tools to
undertake analysis and visualization. Tableau, Qlik and Spotfire also provide desktop clients that can
perform visualization and analytics locally.
Software Access and Training Materials
Tableau
Software: http://www.tableau.com/products/trial-email
Learning: http://www.tableau.com/support/manuals/quickstart
http://www.tableau.com/learn/training?gclid=CK2W9Lqo6MwCFfYy0wod2t8Ftg
Notes: Tableau Desktop is free for students and instructors at accredited academic institutions.
It can be used on Windows/Mac/Cloud.
Qlik
Software: http://global.qlik.com/uk/landing/go-sm/sense-desktop - Desktop Edition.
http://www.qlik.com/try-or-buy - Cloud Edition.
Training: http://www.qlik.com/products/qlik-sense/getting-started
Notes: Windows/Cloud versions available. Qlik has two products QlikView and Qlik Sense. The
Qlik Academic Program Manager recommends Qlik Sense.
Spotfire
Software: http://spotfire.tibco.com/trial
Training: http://spotfire.tibco.com/learn/spotfire-desktop-quickstart
Notes: This is the only one of the offerings which has a 30 days limited use. Windows/Cloud.
IBM Watson Analytics
Software: http://preview.tinyurl.com/zm588jj
Training: https://www.ibm.com/communities/analytics/watson-analytics-blog/upskill-with-watson-
analytics-training/
Notes: Unlike the others IBM Watson Analytics is only available as a cloud offering. Get an IBM
ID to get started. There is a University partnership program which will be investigated in
view of responses to this evaluation process.
3 of 4
Sample Data
While it is expected that participants will use their own data for the evaluation, in order to facilitate
additional participation, the following external data sources have been selected which are used in
research studies around the world:
Socio-economic: http://hdr.undp.org/en/data
Physical environment: http://www.ipcc-data.org/observ/index.html
The two sources were selected in order to ensure a good representation of various disciplines.
You can always find open data for your own discipline from sources like http://data.gov.uk and for
example you can get property prices from https://www.gov.uk/government/statistical-data-sets/price-
paid-data-downloads
Evaluation Survey and Details
The survey can be found here. Note that this survey can be taken multiple times, though please limit to
one review per candidate application:
https://www.surveymonkey.com/r/QZT9B7Z
A preview of the survey is included at the end of this PDF document, so you may review the questions
before undertaking the survey.
Some notes:
The evaluation survey will be open for 60 days from 1st June and closing on 31st July.
Research IT will be presenting three prizes to the best evaluation reports we get. These prizes
will be £250, £150 and £100 in Amazon Vouchers.
The evaluation survey is entirely undertaken through SurveyMonkey.
We are expecting evaluators to act as representatives of their schools, colleagues and potential
other users where possible. Please bear that in mind when giving feedback and comments and
let us know your thoughts on the subject areas.
Prizes will be allocated based on what we (Research IT) deem the ‘best’ feedback we receive,
considering both the tools you are assessing, and insight into your subject area, discipline and
colleagues.
If you would like us to see your work, you can share your visualizations with us, either by providing
links within the feedback survey or directly contacting us by email.

4 of 4
Support and help during the evaluation period
If you have any questions, clarifications or help with any aspect of the evaluation process please do not
hesitate to contact us. Please make note that each of the software you are using are time limited when
you download the trial version. Please get in touch with us to help you arrange extensions as we have
contacted vendors and we have our channels to arrange that.
*
*
*
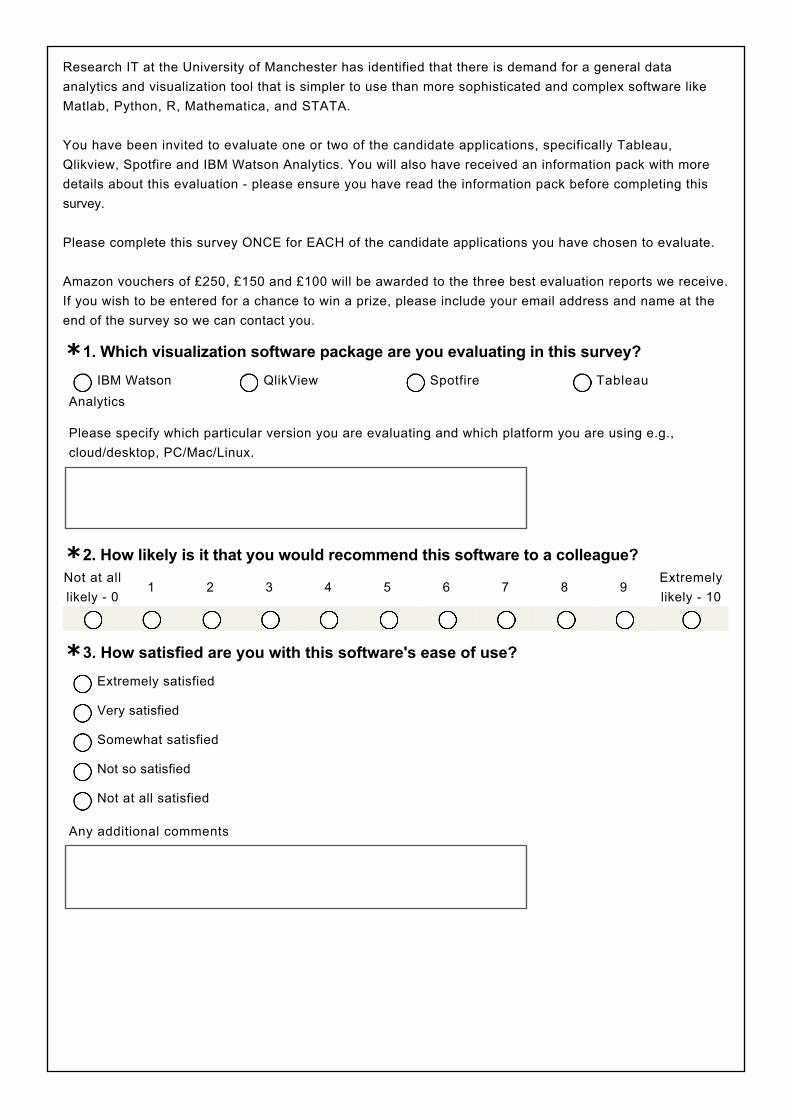
Research IT at the University of Manchester has identified that there is demand for a general dataanalytics and visualization tool that is simpler to use than more sophisticated and complex software likeMatlab, Python, R, Mathematica, and STATA.
You have been invited to evaluate one or two of the candidate applications, specifically Tableau,Qlikview, Spotfire and IBM Watson Analytics. You will also have received an information pack with moredetails about this evaluation please ensure you have read the information pack before completing thissurvey.
Please complete this survey ONCE for EACH of the candidate applications you have chosen to evaluate.
Amazon vouchers of £250, £150 and £100 will be awarded to the three best evaluation reports we receive.If you wish to be entered for a chance to win a prize, please include your email address and name at theend of the survey so we can contact you.
1. Which visualization software package are you evaluating in this survey?
2. How likely is it that you would recommend this software to a colleague?Not at alllikely 0
1 2 3 4 5 6 7 8 9Extremelylikely 10
3. How satisfied are you with this software's ease of use?
IBM WatsonAnalytics
QlikView Spotfire Tableau
Please specify which particular version you are evaluating and which platform you are using e.g.,cloud/desktop, PC/Mac/Linux.
Extremely satisfied
Very satisfied
Somewhat satisfied
Not so satisfied
Not at all satisfied
Any additional comments
*4. How would you rate the quality of the documentation?Very high quality
High quality
Neither high nor low quality
Low quality
Very low quality
N/A
Any additional comments
*
*
*
5. How would you rate the quality of the training materials?
6. How satisfied are you with the reliability of this software?
7. How satisfied are you with the security of this software?
Very high quality
High quality
Neither high nor low quality
Low quality
Very low quality
N/A
Any additional comments
Extremely satisfied
Very satisfied
Somewhat satisfied
Not so satisfied
Not at all satisfied
Any additional comments
Extremely satisfied
Very satisfied
Somewhat satisfied
Not so satisfied
Not at all satisfied
N/A
Any additional comments
*8. How satisfied are you with the ability to integrate other software with thissoftware?Extremely satisfied
Very satisfied
Somewhat satisfied
Not so satisfied
Not at all satisfied
N/A
Any additional comments
*
*
9. How satisfied are you with the look and feel of this software?
10. How satisfied are you with the ability to collaborate with other users on thissoftware?
Extremely satisfied
Very satisfied
Somewhat satisfied
Not so satisfied
Not at all satisfied
Any additional comments
Extremely satisfied
Very satisfied
Somewhat satisfied
Not so satisfied
Not at all satisfied
N/A
Any additional comments
*
*
*
*
11. How satisfied are you with the supported data file formats?
12. How satisfied are you with the database access capabilities?
13. How satisfied are you with the missing data and cleaning data tools?
14. How satisfied are you with the ability to handle Big Data?
Extremely satisfied
Very satisfied
Somewhat satisfied
Not so satisfied
Not at all satisfied
Extremely satisfied
Very satisfied
Somewhat satisfied
Not so satisfied
Not at all satisfied
N/A
Extremely satisfied
Very satisfied
Somewhat satisfied
Not so satisfied
Not at all satisfied
N/A
Extremely satisfied
Very satisfied
Somewhat satisfied
Not so satisfied
Not at all satisfied
N/A
*15. How satisfied are you with the mapping capabilities?Extremely satisfied
Very satisfied
Somewhat satisfied
Not so satisfied
Not at all satisfied
N/A
*
*
*
*
16. How satisfied are you with the data modelling capabilities?
17. How satisfied are you with ability to handle multidimensional, multivariate data?
18. How satisfied are you with ability to handle realtime data?
19. How satisfied are you with data clustering/hierarchical capabilities?
Extremely satisfied
Very satisfied
Somewhat satisfied
Not so satisfied
Not at all satisfied
N/A
Extremely satisfied
Very satisfied
Somewhat satisfied
Not so satisfied
Not at all satisfied
N/A
Extremely satisfied
Very satisfied
Somewhat satisfied
Not so satisfied
Not at all satisfied
N/A
Extremely satisfied
Very satisfied
Somewhat satisfied
Not so satisfied
Not at all satisfied
N/A
*20. How satisfied are you with the data selection tools?Extremely satisfied
Very satisfied
Somewhat satisfied
Not so satisfied
Not at all satisfied
N/A
*
*
*
*
21. How satisfied are you with the data mining capabilities?
22. How satisfied are you with the visual drilldown capabilities?
23. How satisfied are you with the data analytics capabilities?
24. How satisfied are you with the user interface and overall interactivity?
Extremely satisfied
Very satisfied
Somewhat satisfied
Not so satisfied
Not at all satisfied
N/A
Extremely satisfied
Very satisfied
Somewhat satisfied
Not so satisfied
Not at all satisfied
N/A
Extremely satisfied
Very satisfied
Somewhat satisfied
Not so satisfied
Not at all satisfied
N/A
Extremely satisfied
Very satisfied
Somewhat satisfied
Not so satisfied
Not at all satisfied
*25. How satisfied are you with the visualization view controls and its overallinteractivity?Extremely satisfied
Very satisfied
Somewhat satisfied
Not so satisfied
Not at all satisfied
*
*
*
*
26. How satisfied are you with the options for exporting/publishing your results?
27. How satisfied are you with the support for creating and editing dashboards?
28. How satisfied are you with the options for sharing interactive dashboards?
29. How satisfied are you with the reproducibility of the visualization, analysis andoutput results?
Extremely satisfied
Very satisfied
Somewhat satisfied
Not so satisfied
Not at all satisfied
N/A
Extremely satisfied
Very satisfied
Somewhat satisfied
Not so satisfied
Not at all satisfied
N/A
Extremely satisfied
Very satisfied
Somewhat satisfied
Not so satisfied
Not at all satisfied
N/A
Extremely satisfied
Very satisfied
Somewhat satisfied
Not so satisfied
Not at all satisfied
N/A
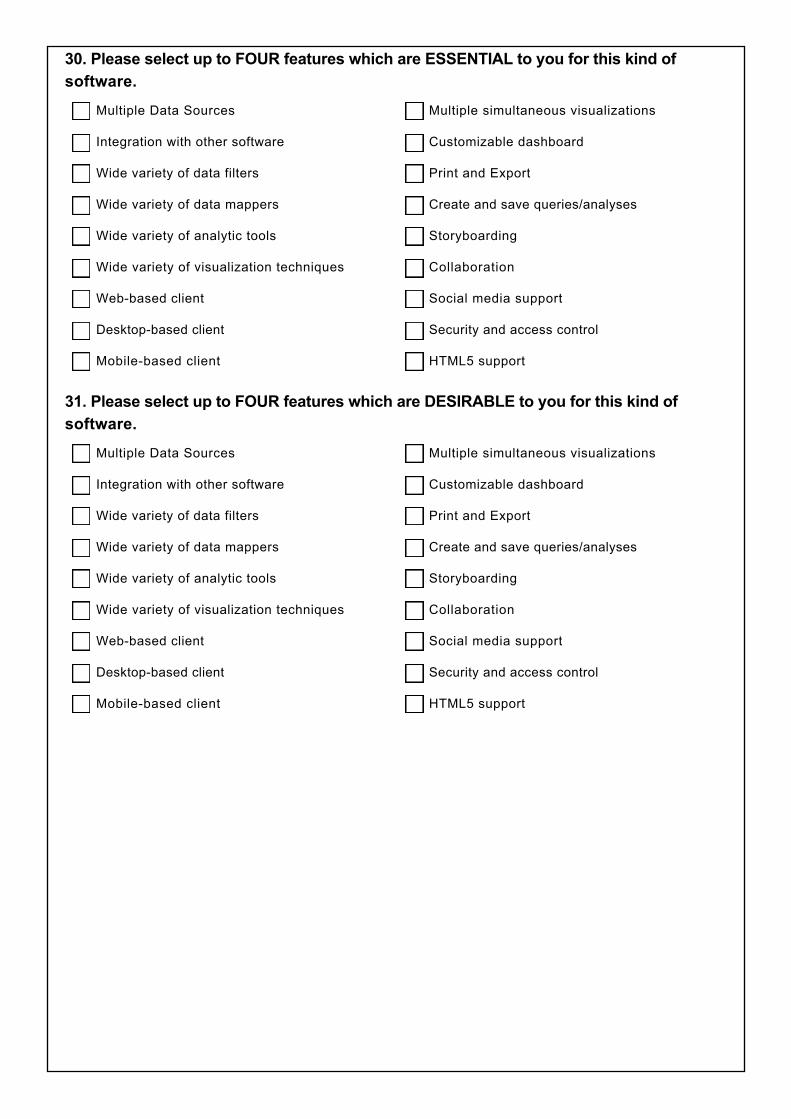
30. Please select up to FOUR features which are ESSENTIAL to you for this kind ofsoftware.
31. Please select up to FOUR features which are DESIRABLE to you for this kind ofsoftware.
Multiple Data Sources
Integration with other software
Wide variety of data filters
Wide variety of data mappers
Wide variety of analytic tools
Wide variety of visualization techniques
Webbased client
Desktopbased client
Mobilebased client
Multiple simultaneous visualizations
Customizable dashboard
Print and Export
Create and save queries/analyses
Storyboarding
Collaboration
Social media support
Security and access control
HTML5 support
*
*
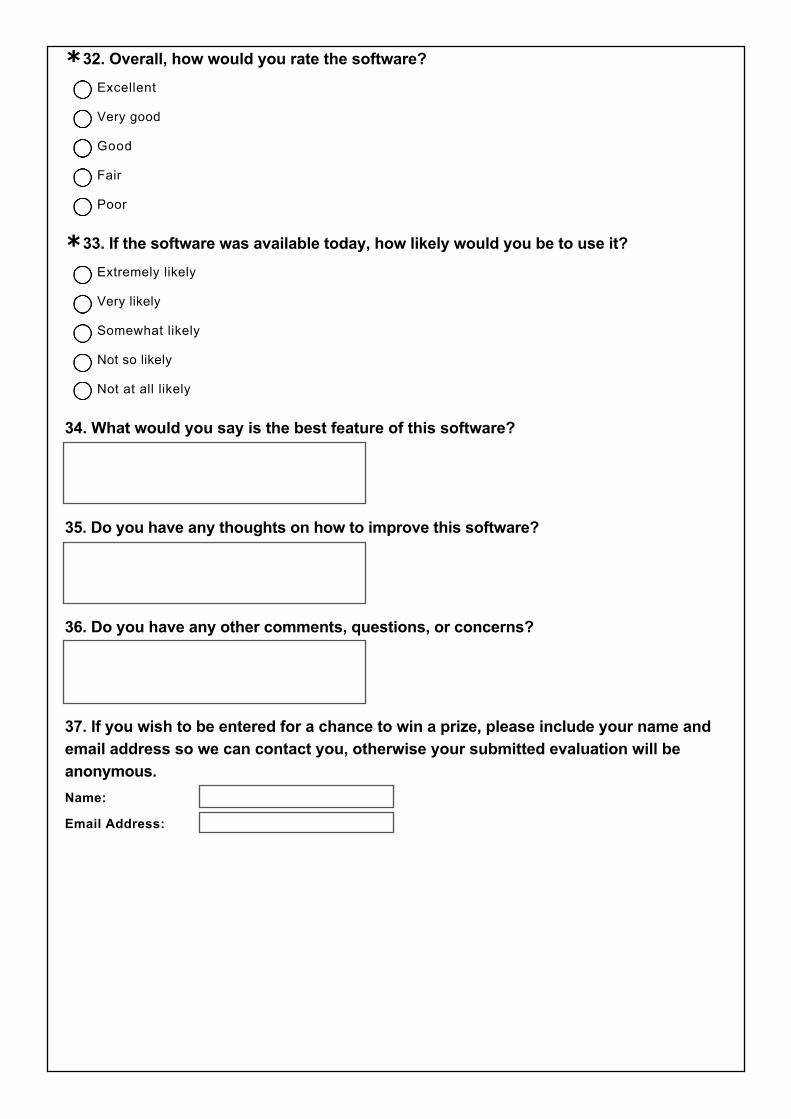
32. Overall, how would you rate the software?
33. If the software was available today, how likely would you be to use it?
34. What would you say is the best feature of this software?
35. Do you have any thoughts on how to improve this software?
36. Do you have any other comments, questions, or concerns?
37. If you wish to be entered for a chance to win a prize, please include your name andemail address so we can contact you, otherwise your submitted evaluation will beanonymous.Name:
Email Address:
Excellent
Very good
Good
Fair
Poor
Extremely likely
Very likely
Somewhat likely
Not so likely
Not at all likely


![Qualitative Relativizations of Complexity Classes* · 0 1985 Academic Press. Inc. 1. INTRODUCTION This paper is a continuation of research efforts reported in [3] and in earlier papers](https://img.pdfslide.us/doc/110x75/5f21b051b96f8429652f129c/qualitative-relativizations-of-complexity-classes-0-1985-academic-press-inc-1.jpg)