Embed Size (px)
DESCRIPTION
Introduction into the Absorption Channels. Description of characteristics and content of the Ozone channel: Ch08: 9.7 . Contact person: Veronika Zwatz-Meise [email protected] Version 1.0. 13 July 2004. All MSG channels. Channel 01:VIS 0.6 Channel 02:VIS 0.8 - PowerPoint PPT Presentation
Citation preview
1
Introduction into the Absorption Channels
Description of characteristics and content of the Ozone channel:
Ch08: 9.7
Contact person:Veronika [email protected] 1.0. 13 July 2004
2
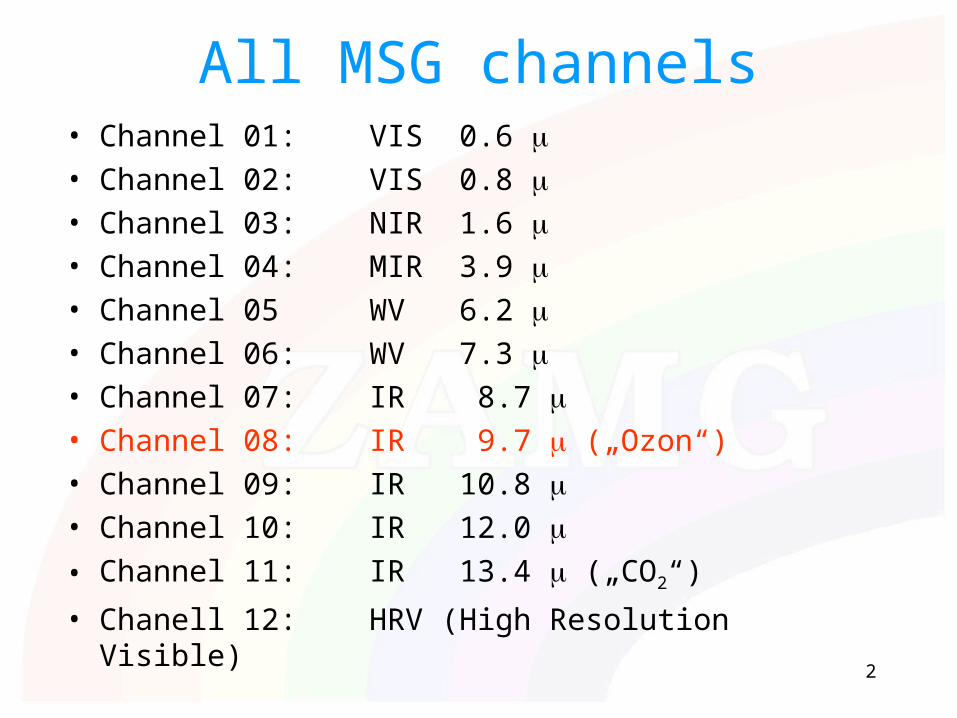
All MSG channels• Channel 01: VIS 0.6
• Channel 02: VIS 0.8
• Channel 03: NIR 1.6
• Channel 04: MIR 3.9
• Channel 05 WV 6.2
• Channel 06: WV 7.3
• Channel 07: IR 8.7
• Channel 08: IR 9.7 („Ozon“)
• Channel 09: IR 10.8
• Channel 10: IR 12.0
• Channel 11: IR 13.4 („CO2“)
• Chanell 12: HRV (High Resolution Visible)
3
„Ozone channel“
Ch08: 9.7 m
4
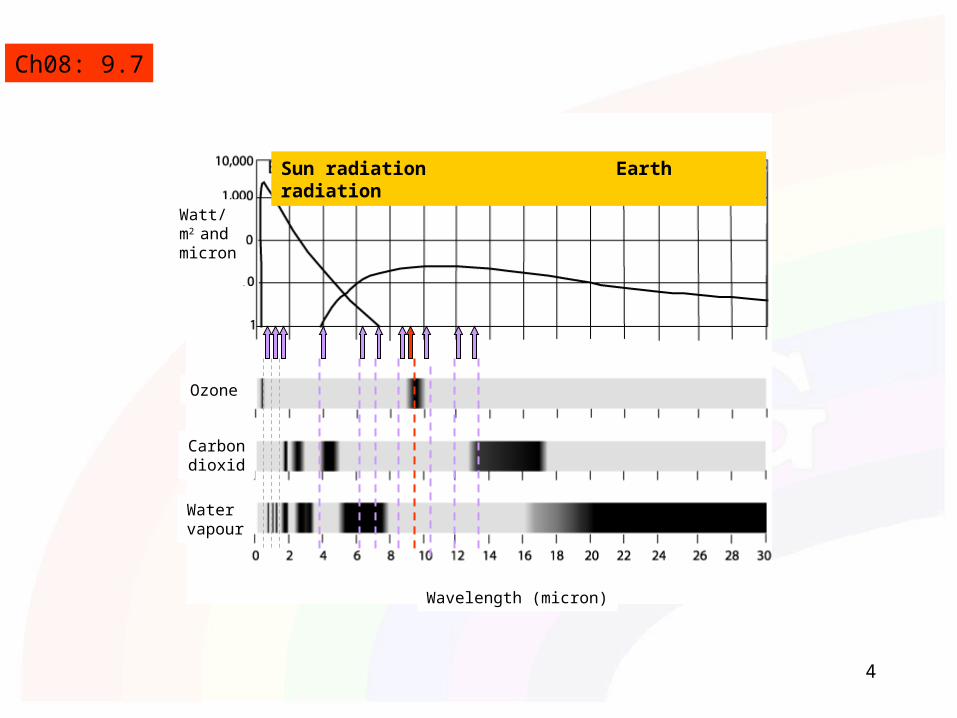
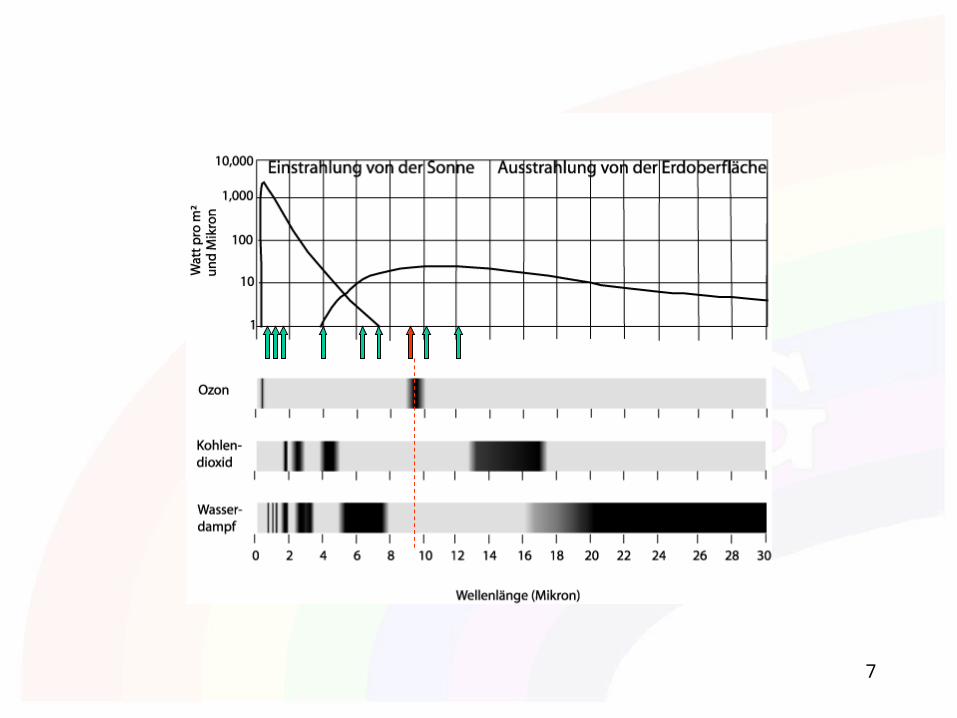
Sun radiation Earth radiation
Ch08: 9.7
Wavelength (micron)
Watt/m2 andmicron
Ozone
Carbondioxid
Watervapour
5
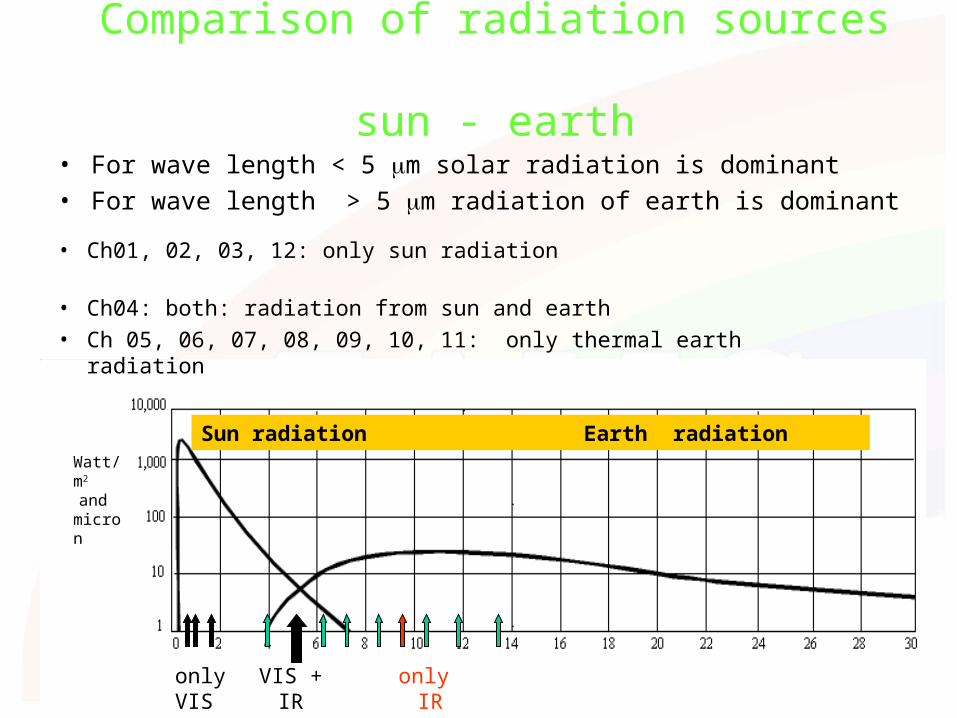
Comparison of radiation sources sun - earth
• For wave length < 5 m solar radiation is dominant
• For wave length > 5 m radiation of earth is dominant
only VIS
VIS +IR
only IR
• Ch01, 02, 03, 12: only sun radiation
• Ch04: both: radiation from sun and earth
• Ch 05, 06, 07, 08, 09, 10, 11: only thermal earth radiation
Sun radiation Earth radiationWatt/m2
andmicron
6
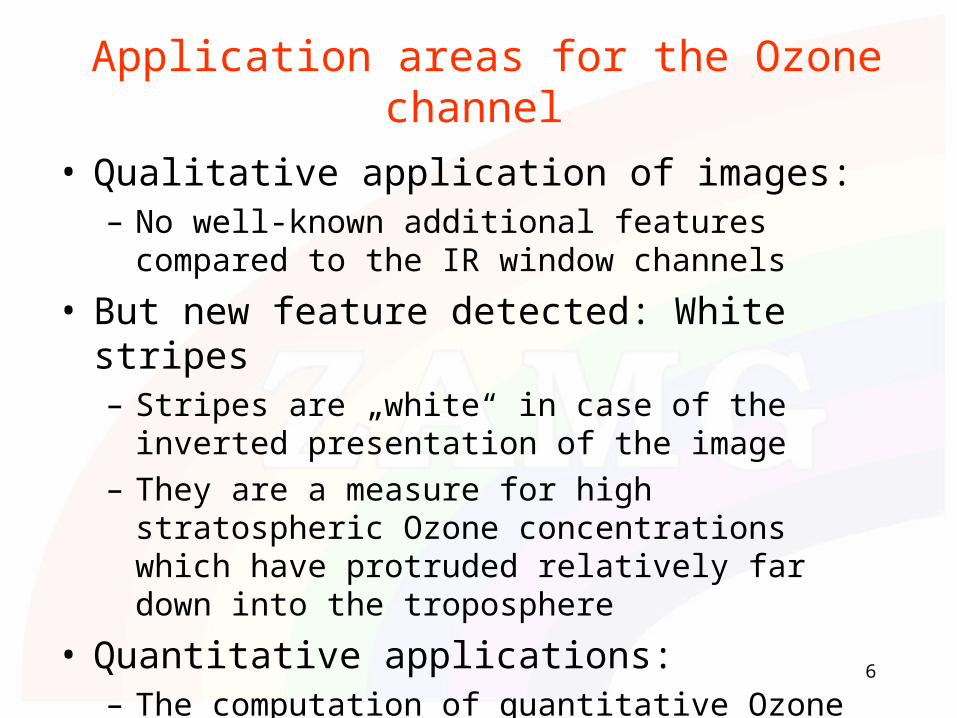
Application areas for the Ozone channel
• Qualitative application of images:– No well-known additional features compared to the IR
window channels
• But new feature detected: White stripes– Stripes are „white“ in case of the inverted presentation of
the image
– They are a measure for high stratospheric Ozone concentrations which have protruded relatively far down into the troposphere
• Quantitative applications:– The computation of quantitative Ozone values will be a
future task
7
8
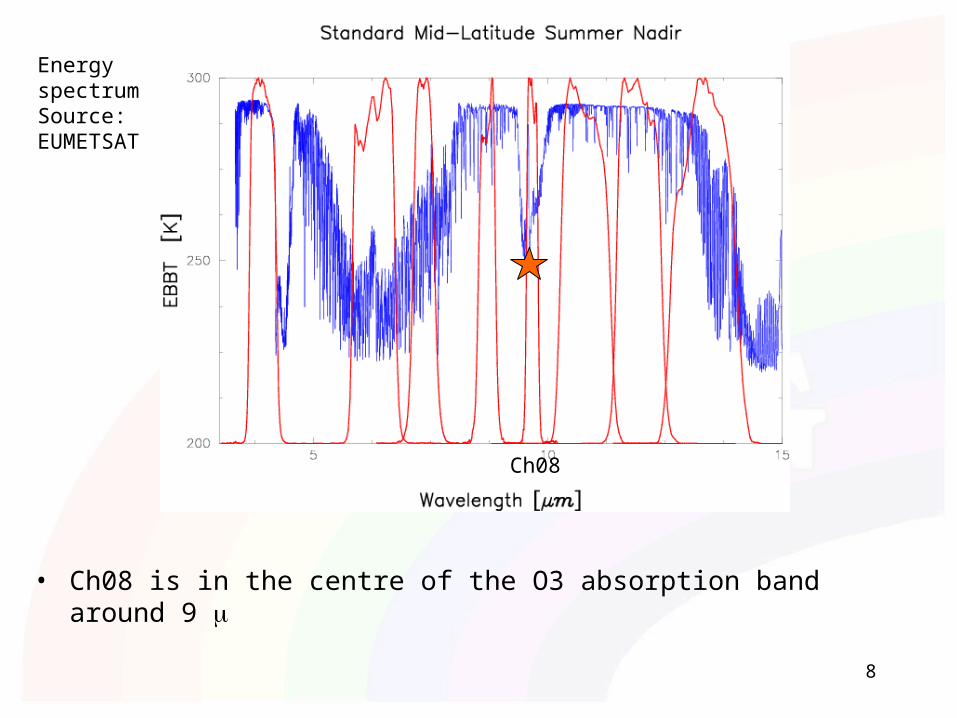
• Ch08 is in the centre of the O3 absorption band around 9
EnergyspectrumSource:EUMETSAT
Ch08
9
Figure 3c
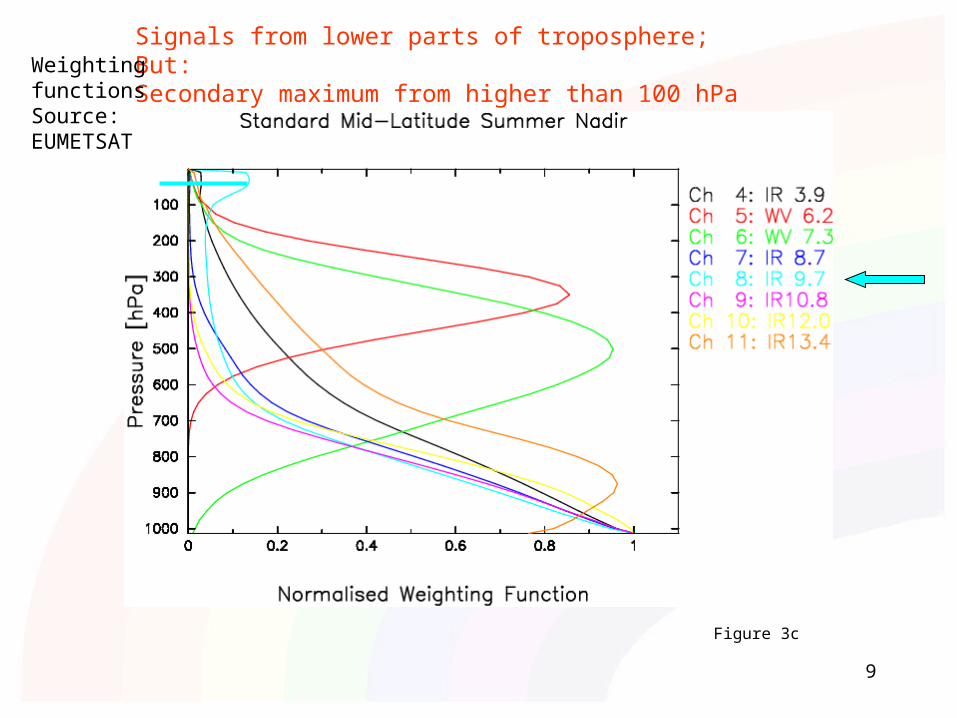
Signals from lower parts of troposphere;But:Secondary maximum from higher than 100 hPa
WeightingfunctionsSource:EUMETSAT
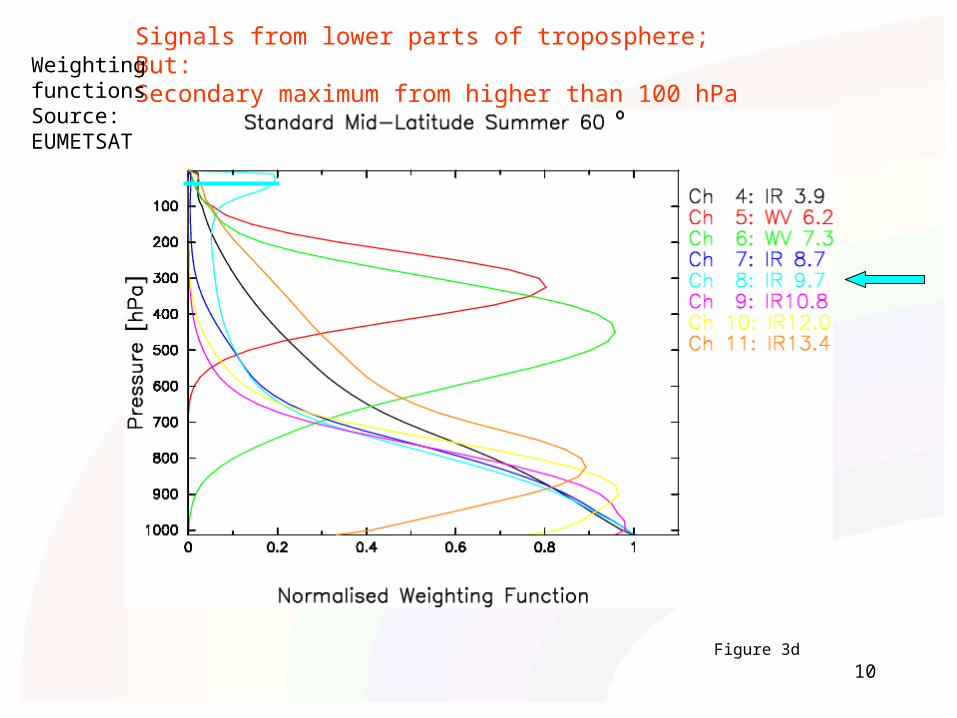
10Figure 3d
Signals from lower parts of troposphere;But:Secondary maximum from higher than 100 hPa
WeightingfunctionsSource:EUMETSAT
11
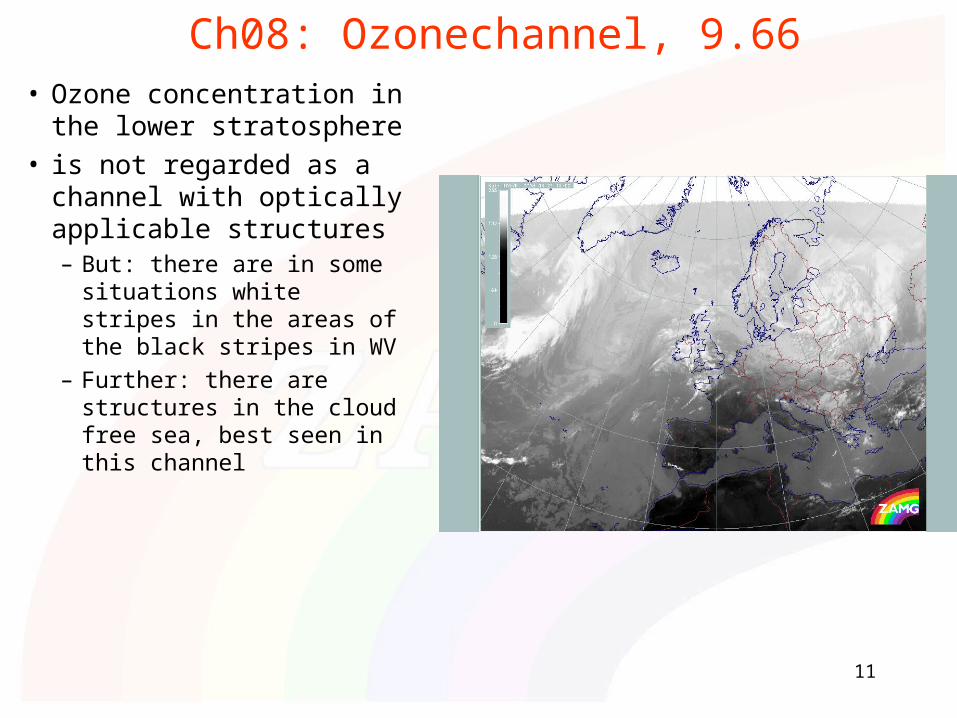
Ch08: Ozonechannel, 9.66• Ozone concentration in the
lower stratosphere • is not regarded as a channel
with optically applicable structures– But: there are in some
situations white stripes in the areas of the black stripes in WV
– Further: there are structures in the cloud free sea, best seen in this channel
12
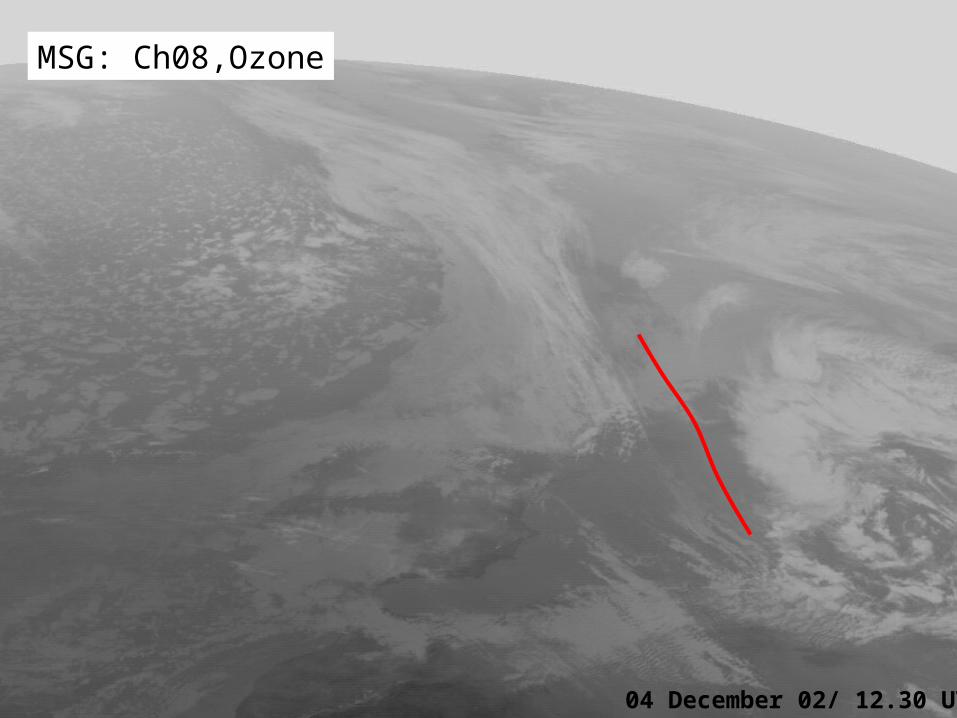
„White Stripes“• White stripes can only be seen in Ch08, not in Chs 09, 10
• They appear in areas of dark stripes in WV (Ch05 and 06)
• They are accompanied by NWP paramaters typical for low tropopause (tropopause folding):– PV low down (for instance 500 hpa)
– Maximum of shear vorticity at 300 hpa
– on the cyclonic side of a jet streak
• Physical meaning of white stripes:– high content of Ozone which absorbs the radiation from below and
emitts radiation according to 2 nd law of Kirchhoff
• There are many more situations with low tropopause (tropopause folding) without the white stripe; consequently:
• White stripes are an optical indication of high stratospheric Ozone in upper tropopsheric heights
13
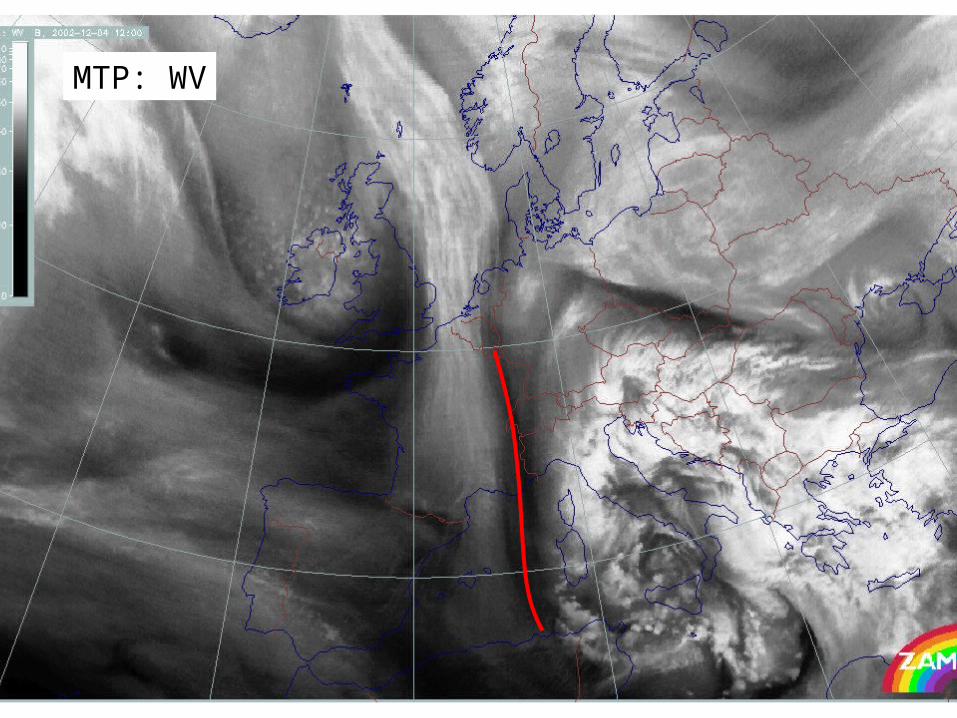
Case 4 December 2002
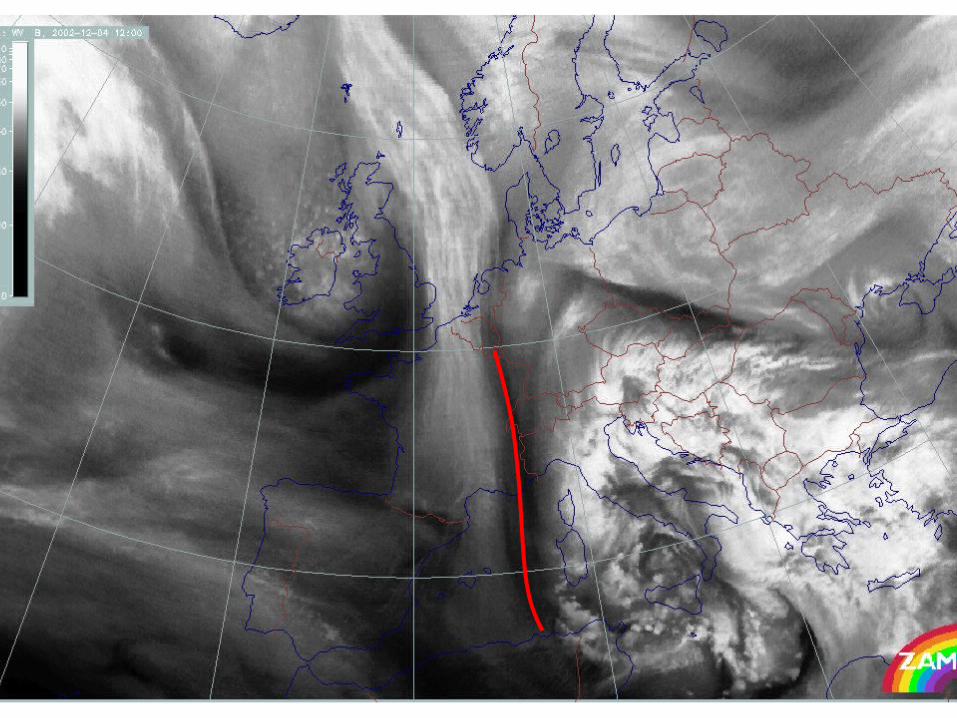
• Black stripe in WV: Belgium - W-Alps -W-Switzerland - Western Mediterranean
• Same area shows white stripe in Ch08 • Model parameters:
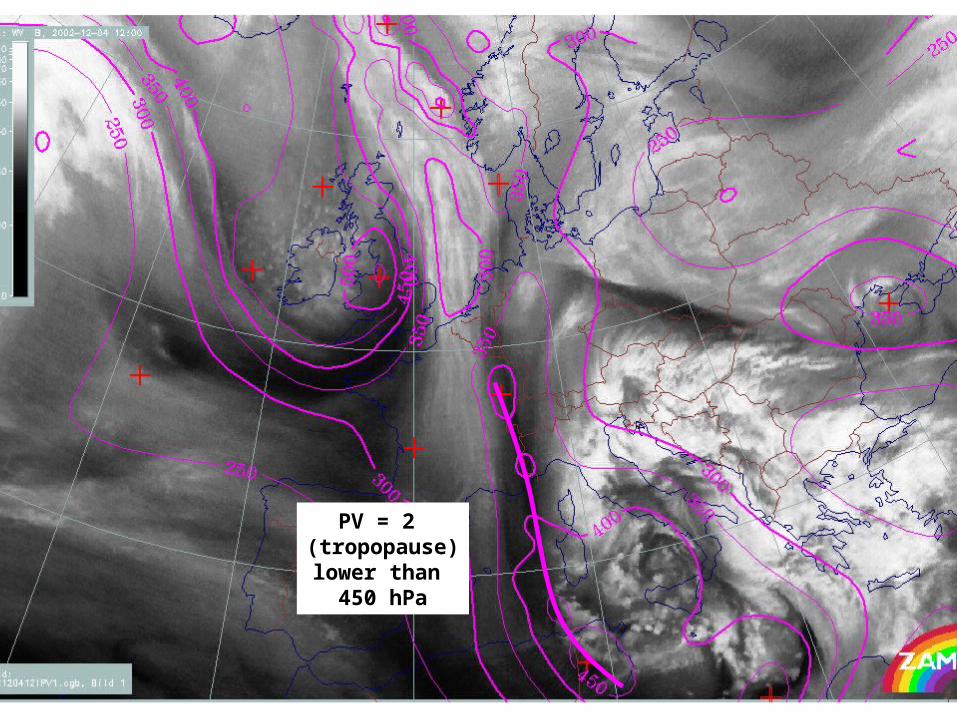
– PV = 2 unit lower than 400, partly 450 hPa
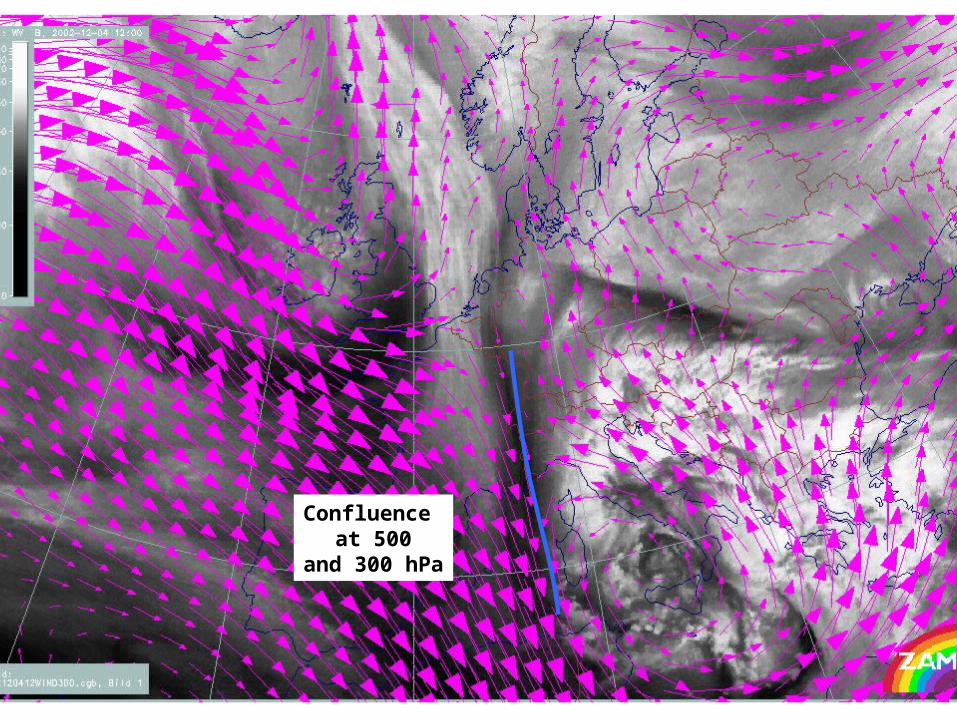
– confluence area at 500 and 300 hPa
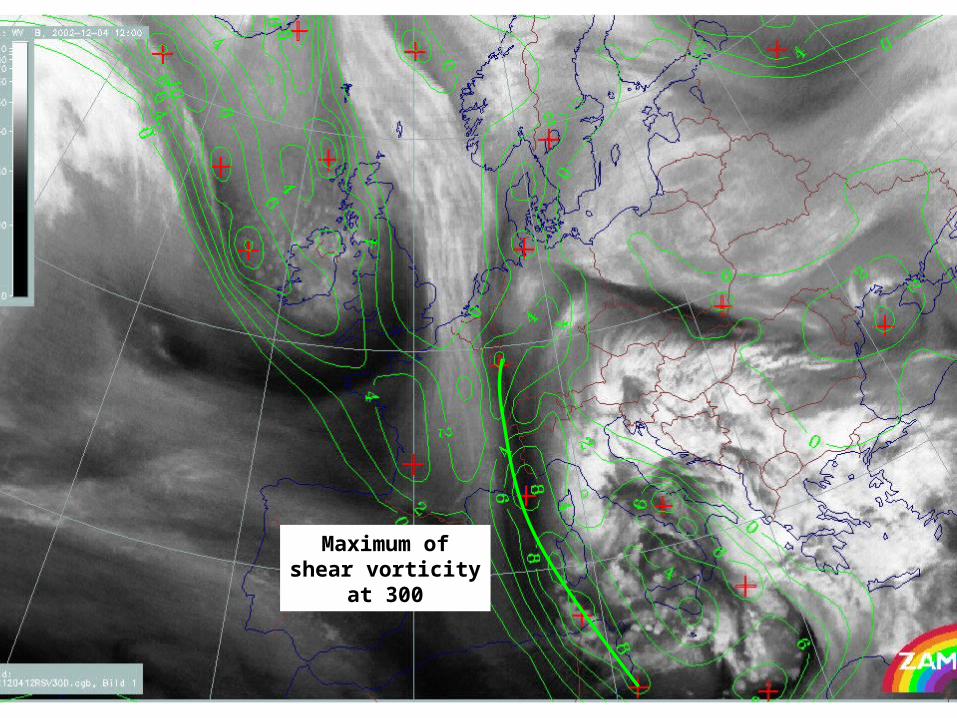
– maximum of shear vorticity
14
MTP: WV
15
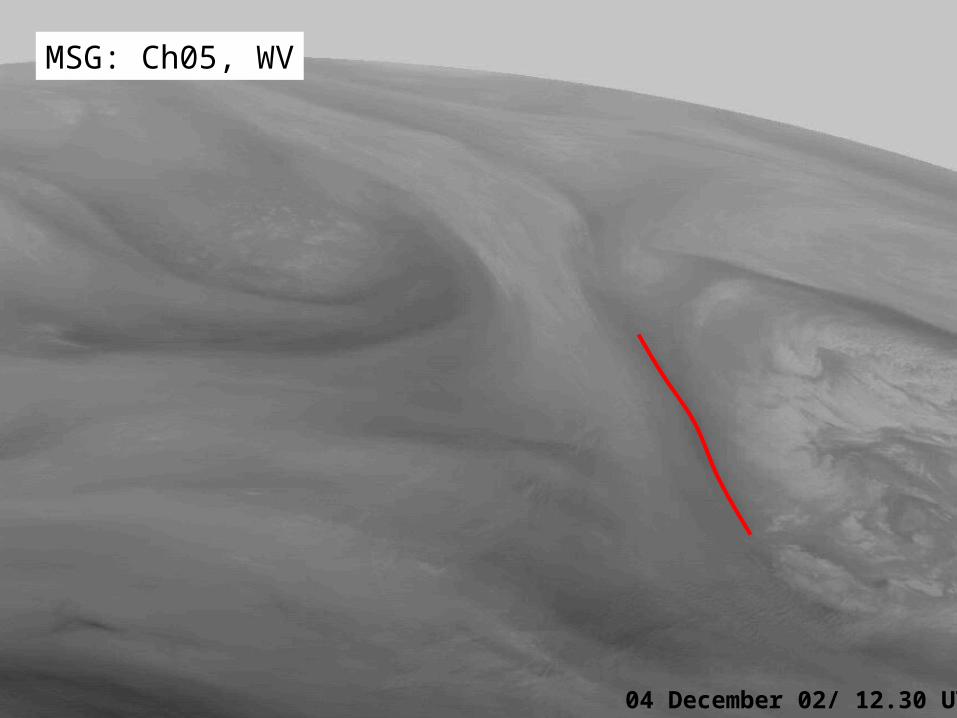
WV 6.2
04 December 02/ 12.30 UTC
MSG: Ch05, WV
16
O3 9.7
04 December 02/ 12.30 UTC
MSG: Ch08,Ozone
17
18
Maximum ofshear vorticity
at 300
19
PV = 2 (tropopause)lower than
450 hPa
20
Confluence at 500
and 300 hPa
21
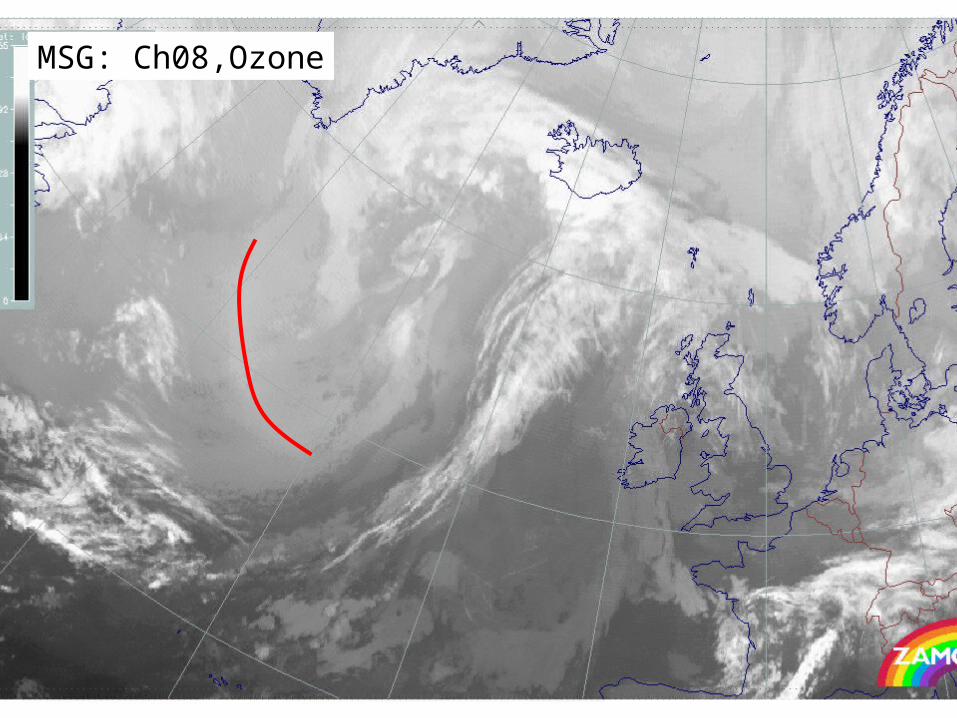
Case 9 July 03/0600 UTC
• Black stripe in WV: Atlantic; huge low system• Same area shows white stripe in Ch08 • white stripe not seen in the other IR channels• Model parameters:
– close to jet axis (zeroline of shear vorticity) on cyclonic side
– maxima of cyclonic shear vorticity
– PV = 1 lower than 450
– in vertical cross section convergence at these levels
22
MSG: Ch08,Ozone
23
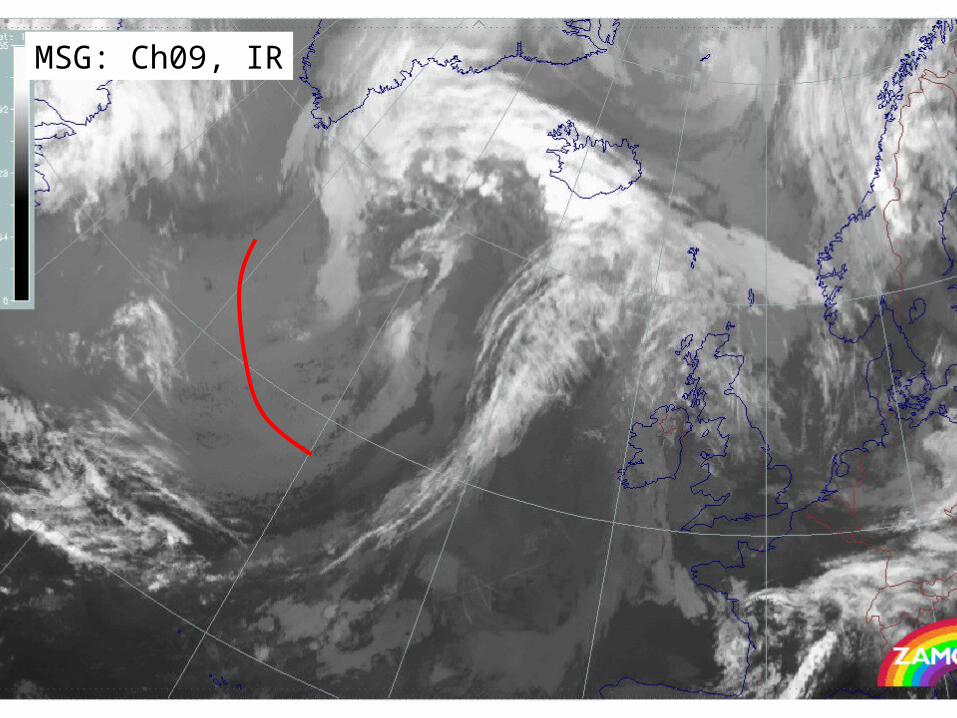
MSG: Ch09, IR
24
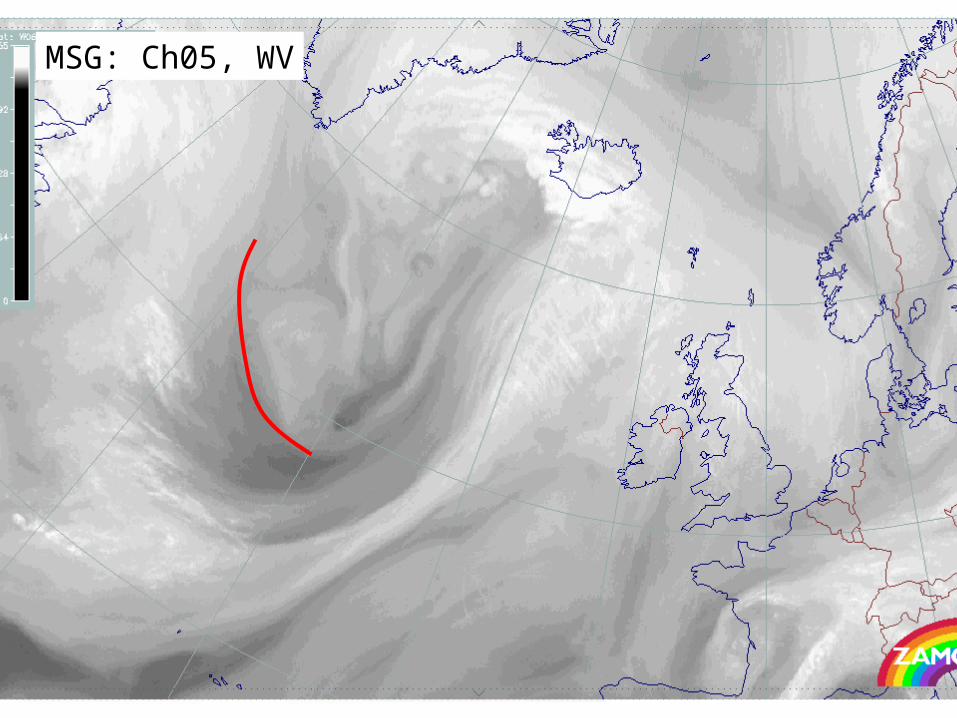
MSG: Ch05, WV
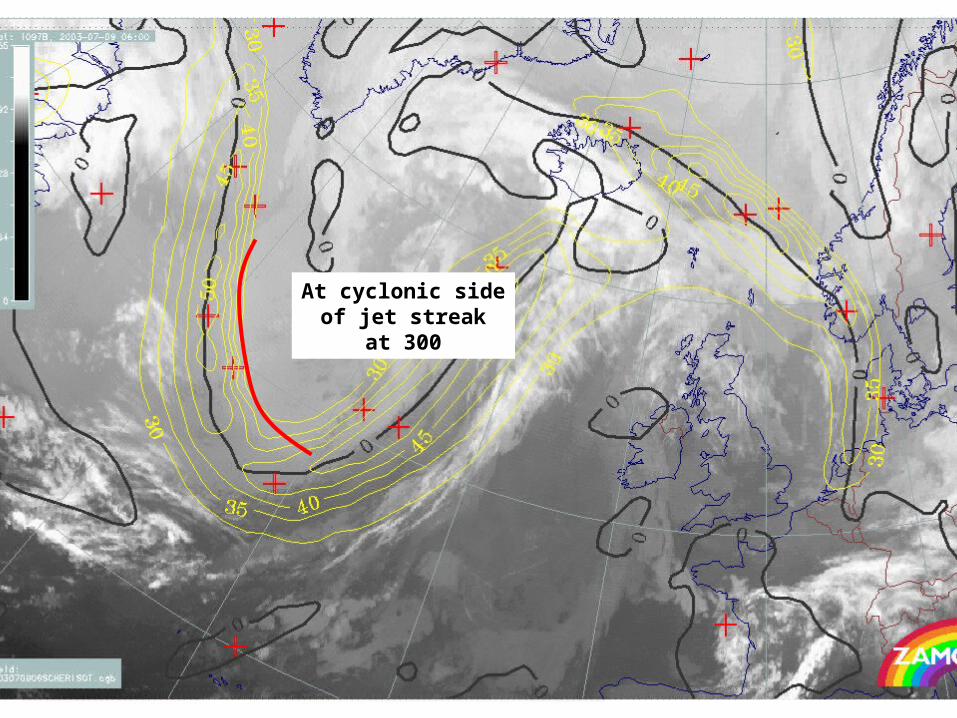
25
At cyclonic sideof jet streak
at 300
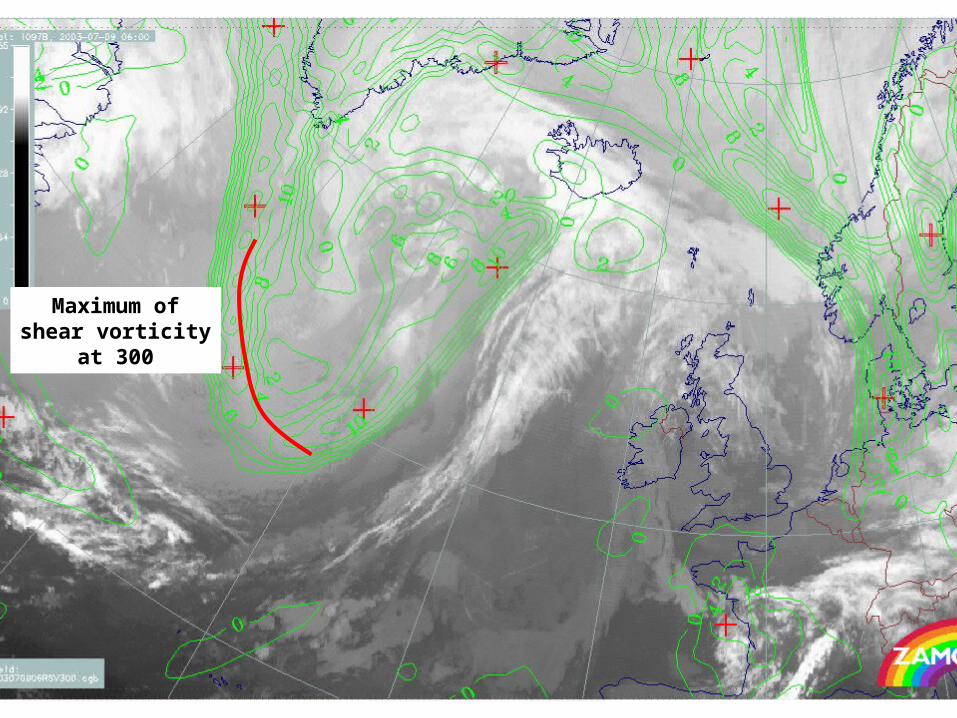
26
Maximum ofshear vorticity
at 300
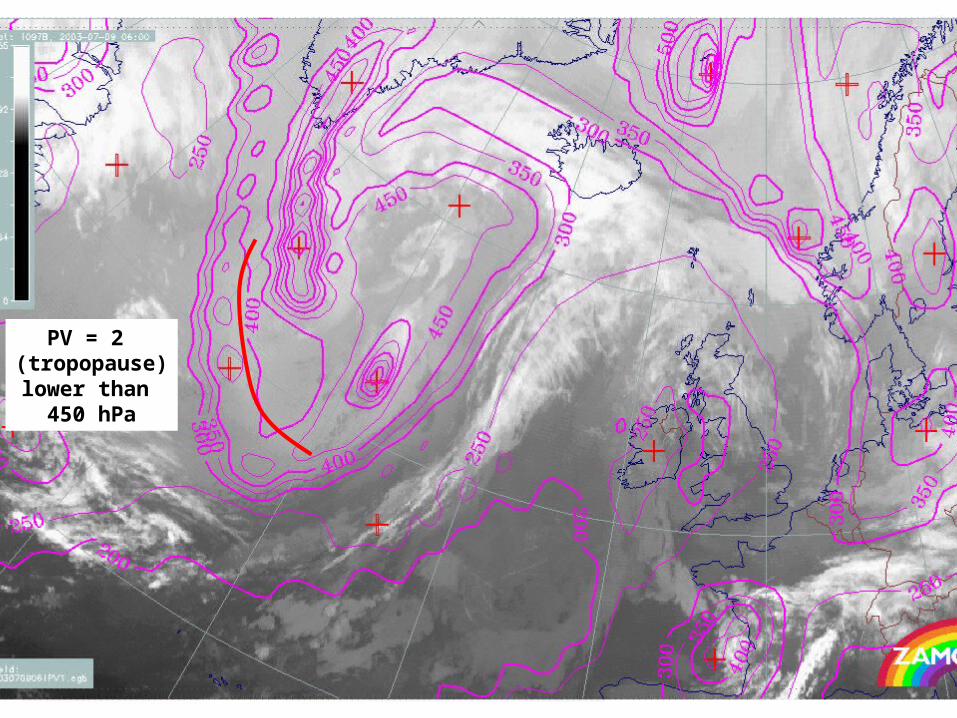
27
PV = 2 (tropopause)lower than
450 hPa