Embed Size (px)
Citation preview
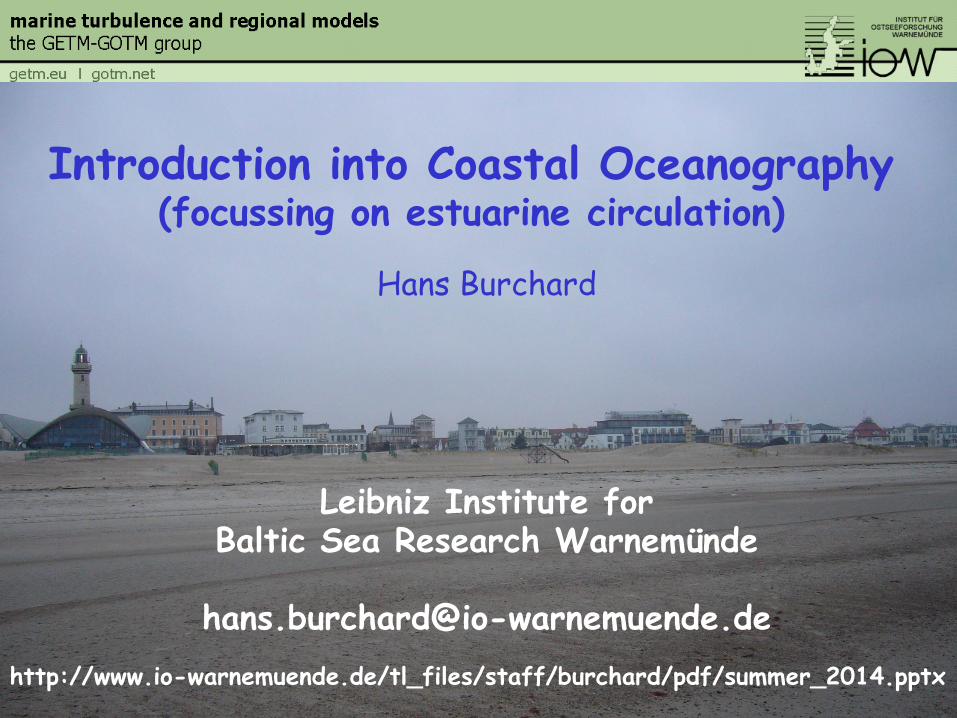
Hans Burchard
Leibniz Institute for Baltic Sea Research Warnemünde
Introduction into Coastal Oceanography (focussing on estuarine circulation)
http://www.io-warnemuende.de/tl_files/staff/burchard/pdf/summer_2014.pptx
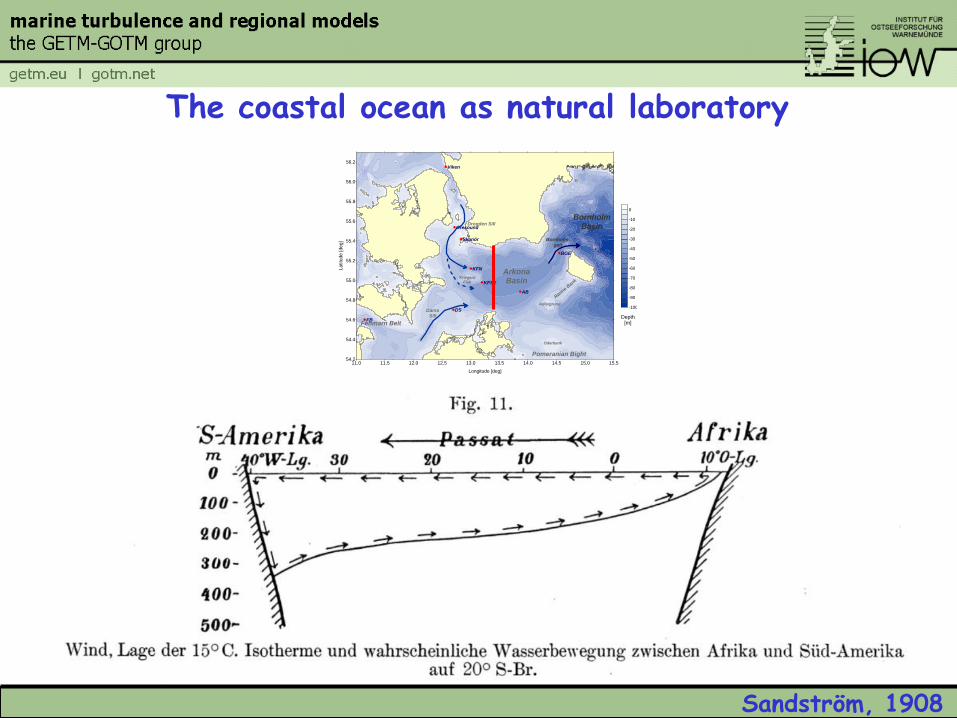
Sandström, 1908
The coastal ocean as natural laboratory
11.0 11.5 12.0 12.5 13.0 13.5 14.0 14.5 15.0 15.5
Longitude [deg]
54.2
54.4
54.6
54.8
55.0
55.2
55.4
55.6
55.8
56.0
56.2
La
titu
de
[d
eg
] Skanör
Viken
Oresound
KFSE
KFN
BGE
DS
AB
FB
-100
-90
-80
-70
-60
-50
-40
-30
-20
-10
0
Depth[m]
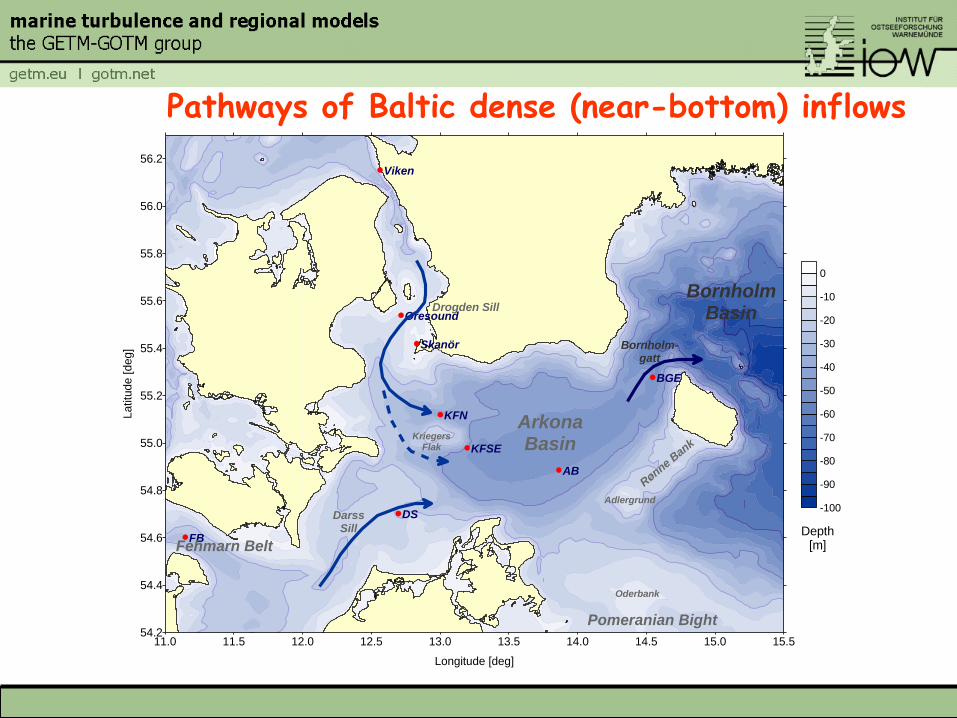
BornholmBasin
ArkonaBasin
Pomeranian Bight
DarssSill
Fehmarn Belt
Rønne Bank
Bornholm-gatt
Drogden Sill
KriegersFlak
Adlergrund
Oderbank
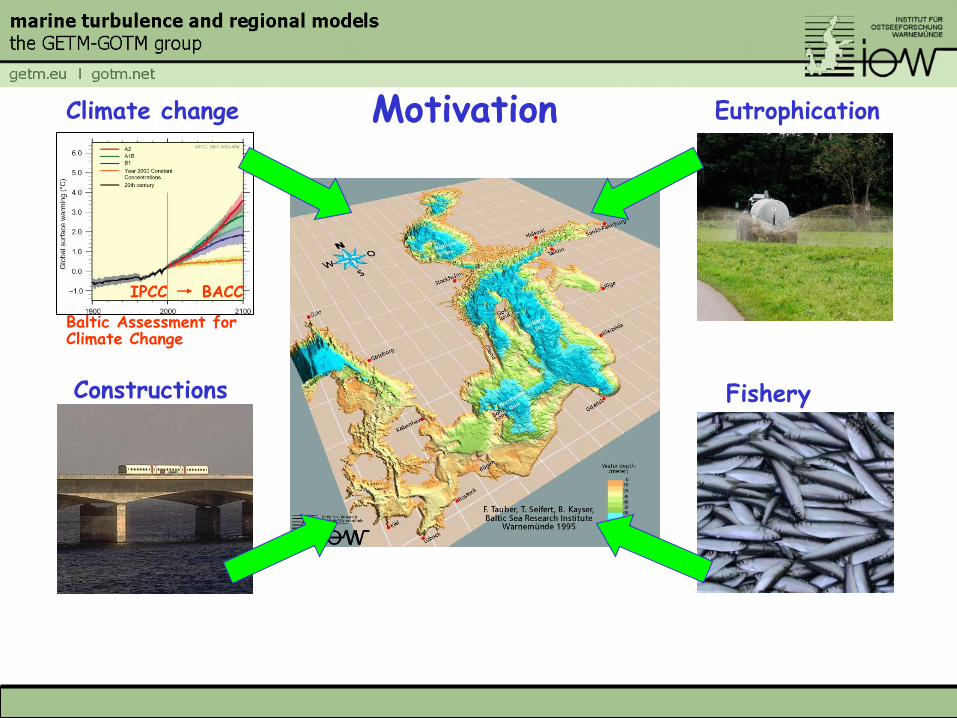
Motivation
Figure SPM.5
Climate change Eutrophication
Constructions Fishery
IPCC BACC
Baltic Assessment for Climate Change
11.0 11.5 12.0 12.5 13.0 13.5 14.0 14.5 15.0 15.5
Longitude [deg]
54.2
54.4
54.6
54.8
55.0
55.2
55.4
55.6
55.8
56.0
56.2
La
titu
de
[d
eg
] Skanör
Viken
Oresound
KFSE
KFN
BGE
DS
AB
FB
-100
-90
-80
-70
-60
-50
-40
-30
-20
-10
0
Depth[m]
BornholmBasin
ArkonaBasin
Pomeranian Bight
DarssSill
Fehmarn Belt
Rønne Bank
Bornholm-gatt
Drogden Sill
KriegersFlak
Adlergrund
Oderbank
Pathways of Baltic dense (near-bottom) inflows
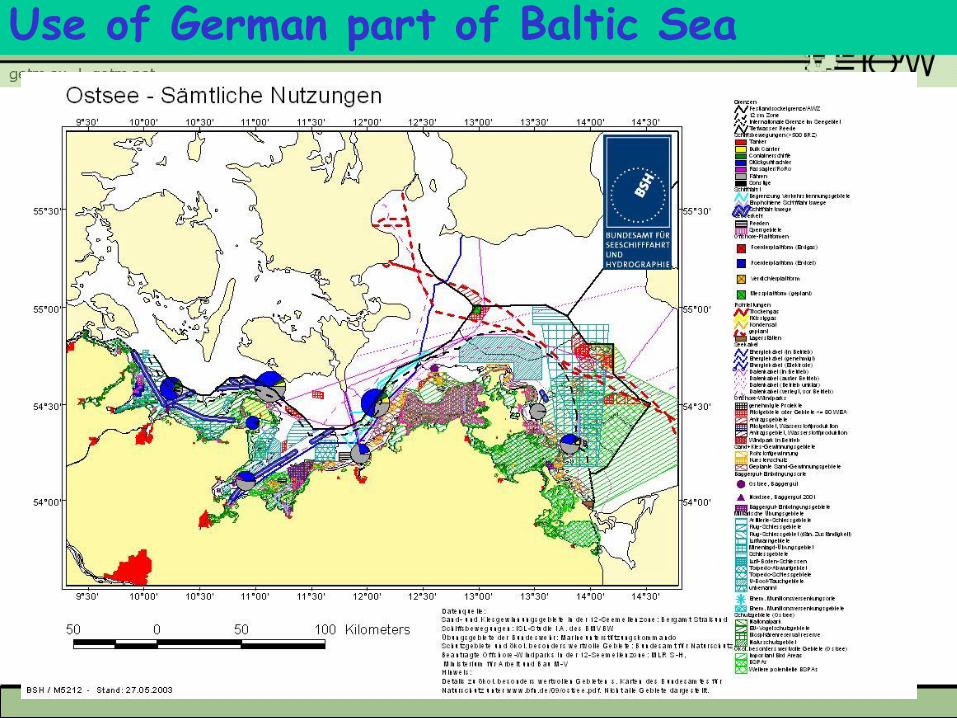
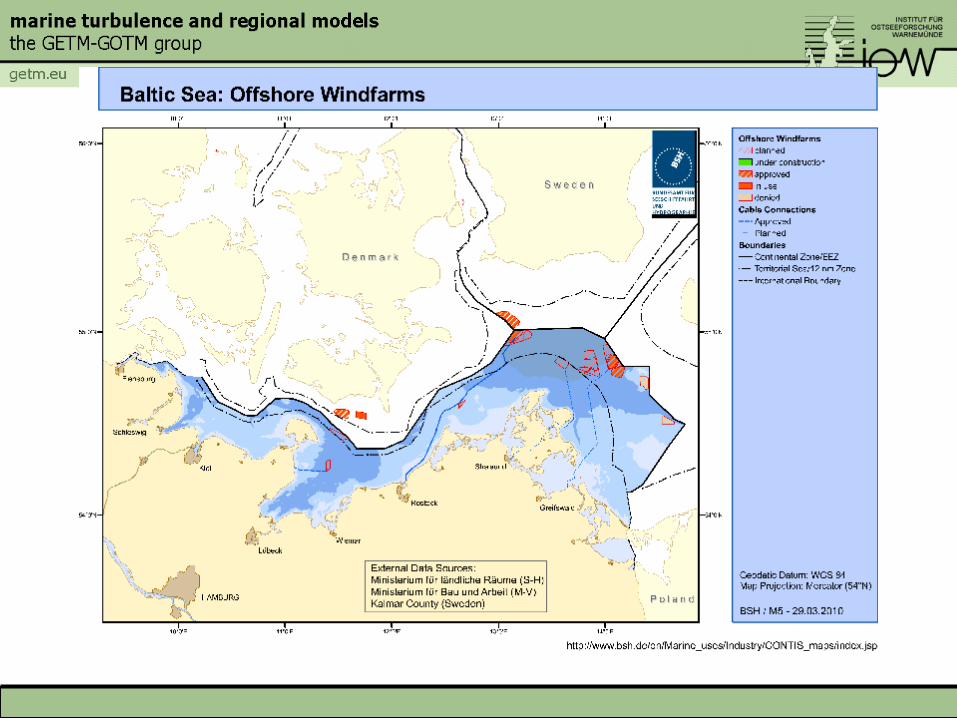
Use of German part of Baltic Sea
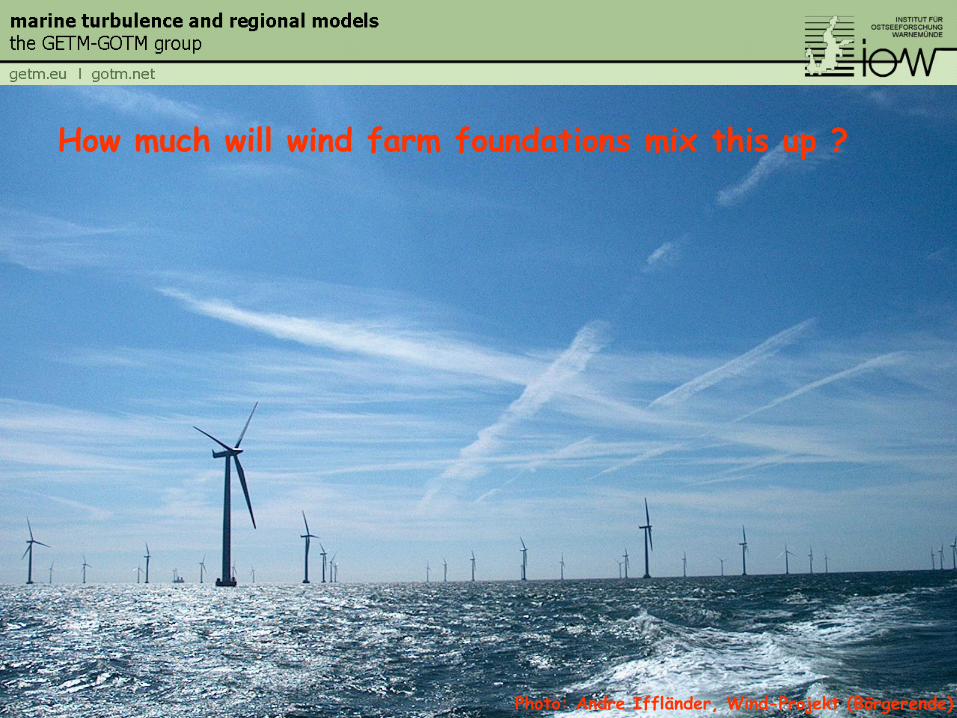
How much will wind farm foundations mix this up ?
Photo: Andre Iffländer, Wind-Projekt (Börgerende)
… and the bridges ???
Photo: Toralf Heene (IOW)
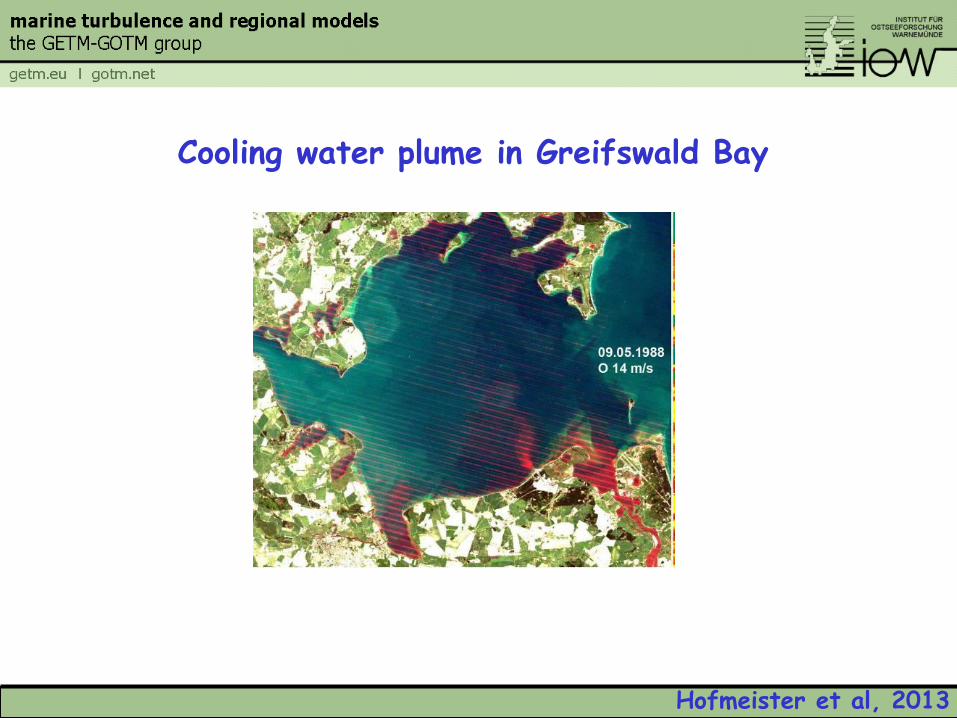
Cooling water plume in Greifswald Bay
Hofmeister et al, 2013
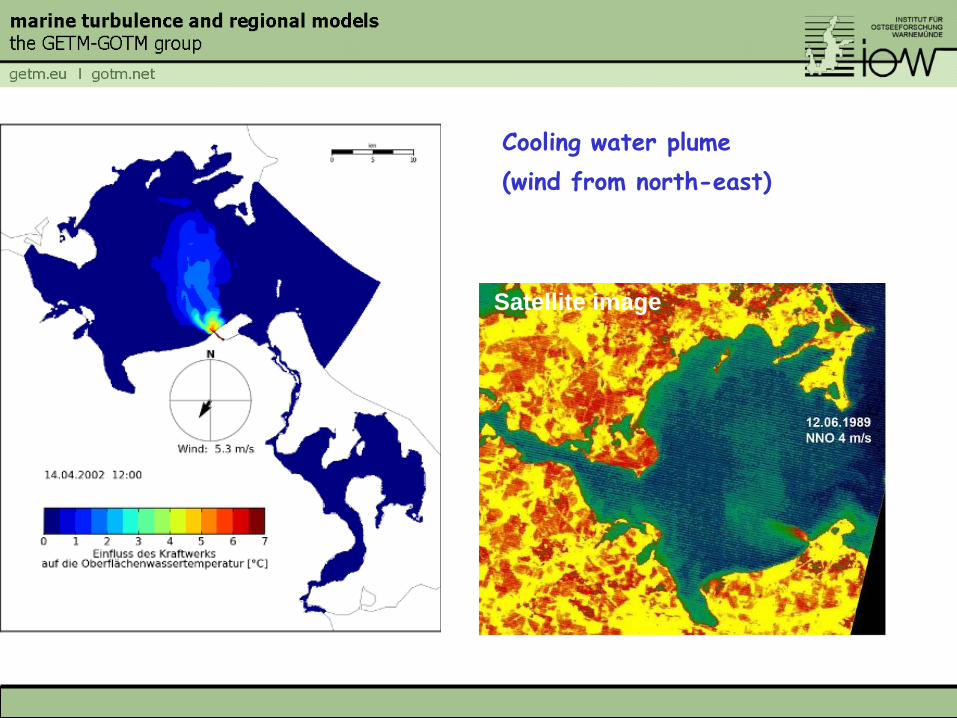
Cooling water plume
(wind from north-east)
Satellite image
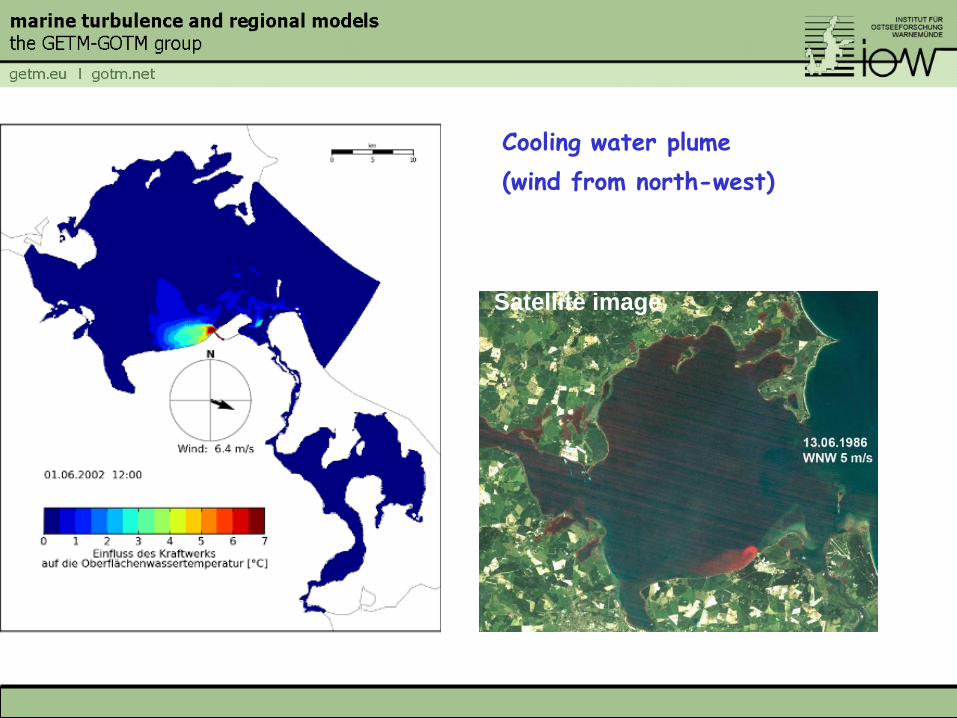
Cooling water plume
(wind from north-west)
Satellite image
Area: ~12 600 km2
Length: ~ 100 km Discharge: ~ 65 m3/s
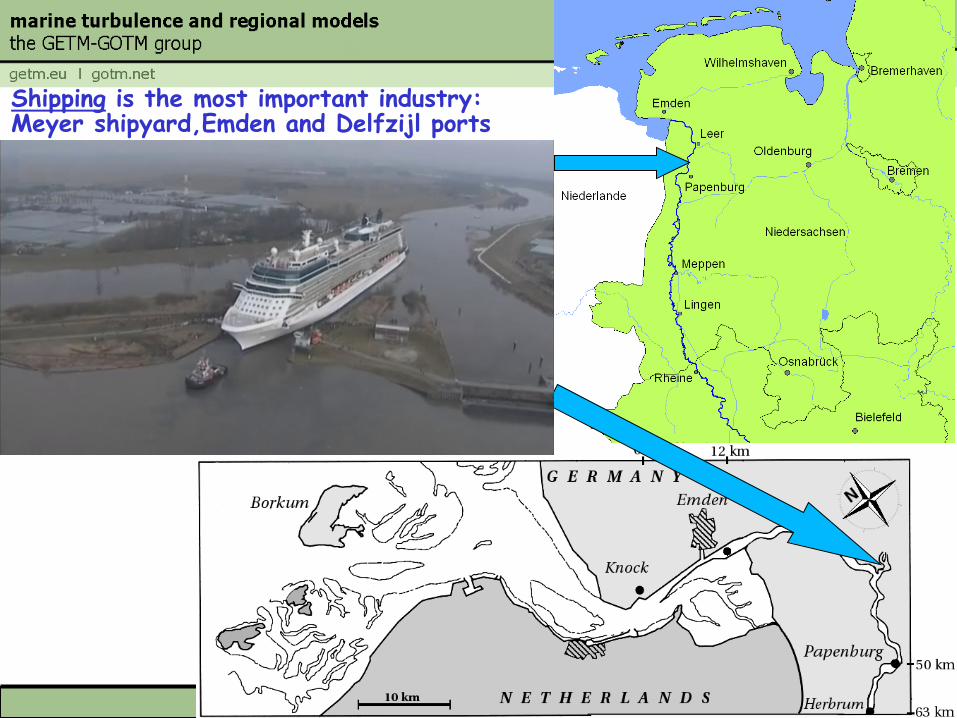
Shipping is the most important industry: Meyer shipyard,Emden and Delfzijl ports
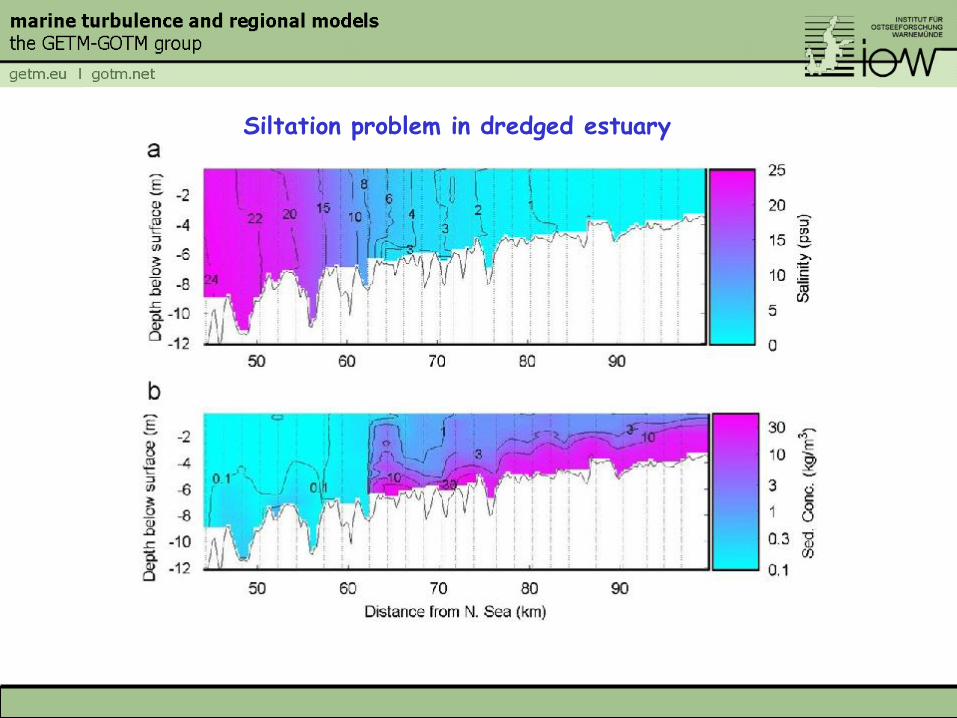
Siltation problem in dredged estuary
To assess the potential consequences of
human interference to the coastal ocean,
a detailed understanding of the
underlying processes is necessary.
Then, numerical models reproducing these
processes can be used to calculate
scenarios of these human interferences.
Programme
A: Some fundamental hydrodynamics
B: Overturning circulation in the Baltic Sea
C: Overturning circulation in the Wadden Sea
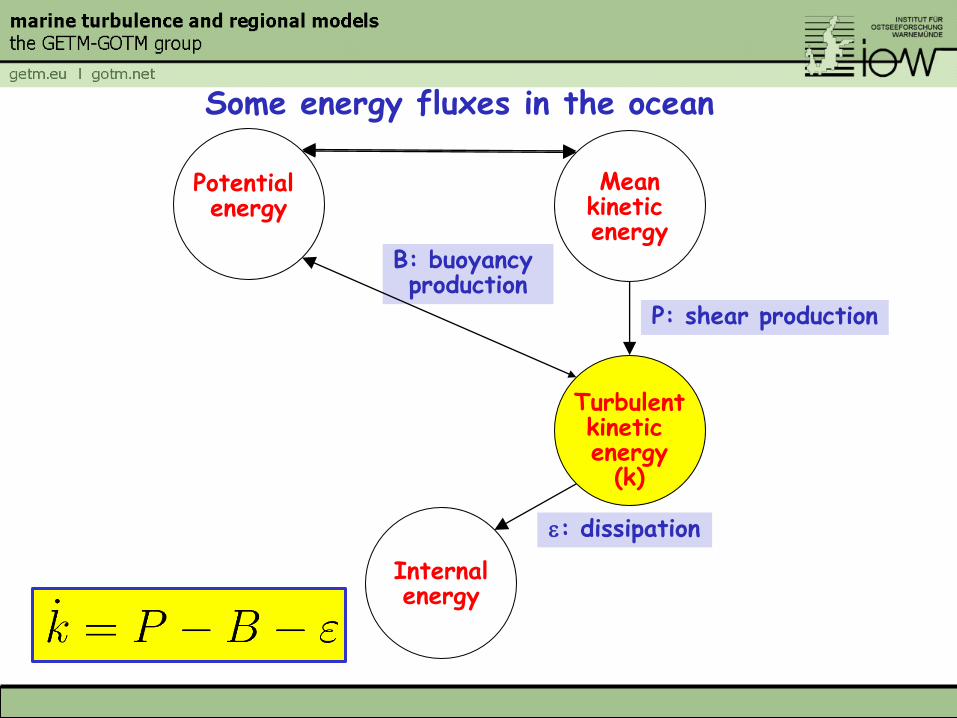
Potential energy
Mean kinetic energy
Turbulent kinetic energy
(k)
Internal energy
P: shear production
B: buoyancy production
e: dissipation
Some energy fluxes in the ocean
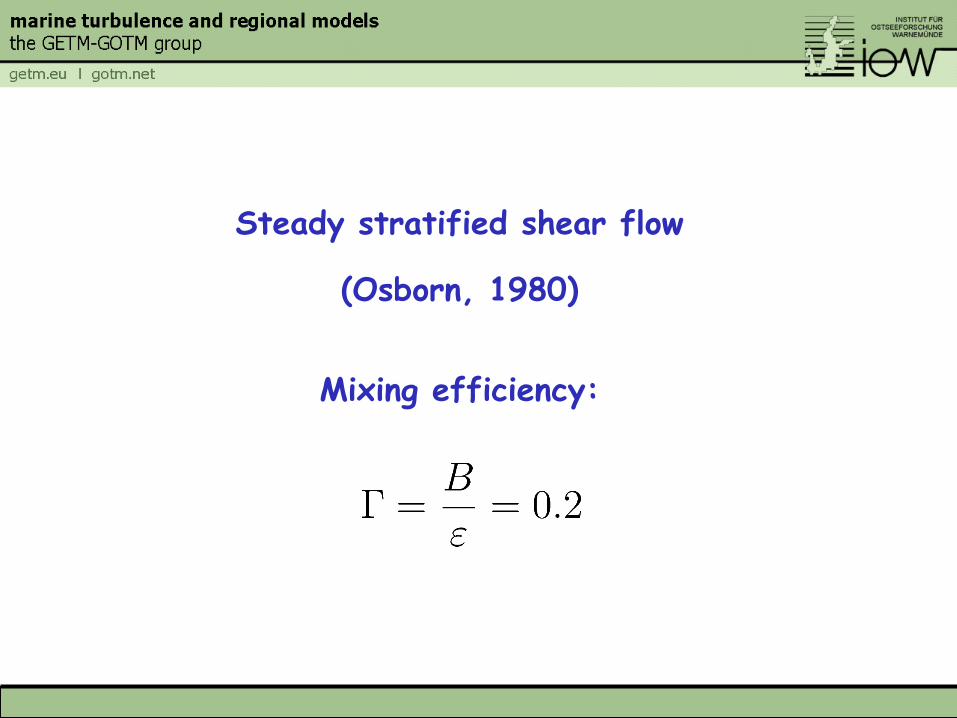
Steady stratified shear flow
(Osborn, 1980)
Mixing efficiency:
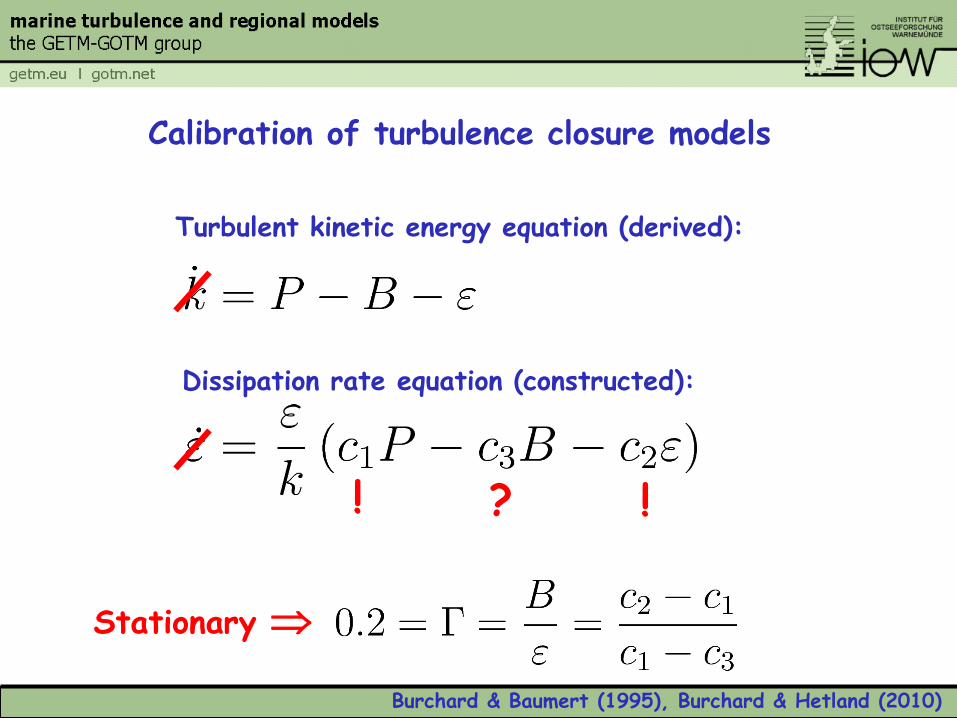
Calibration of turbulence closure models
Turbulent kinetic energy equation (derived):
Dissipation rate equation (constructed):
? ! !
Stationary
Burchard & Baumert (1995), Burchard & Hetland (2010)
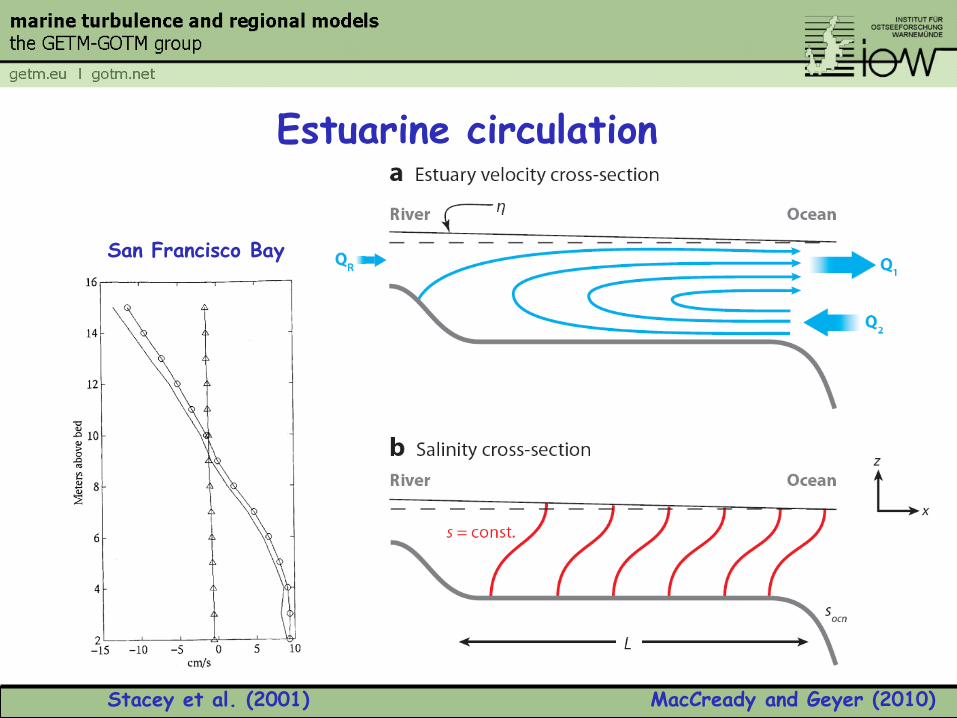
Estuarine circulation
Stacey et al. (2001)
San Francisco Bay
MacCready and Geyer (2010)
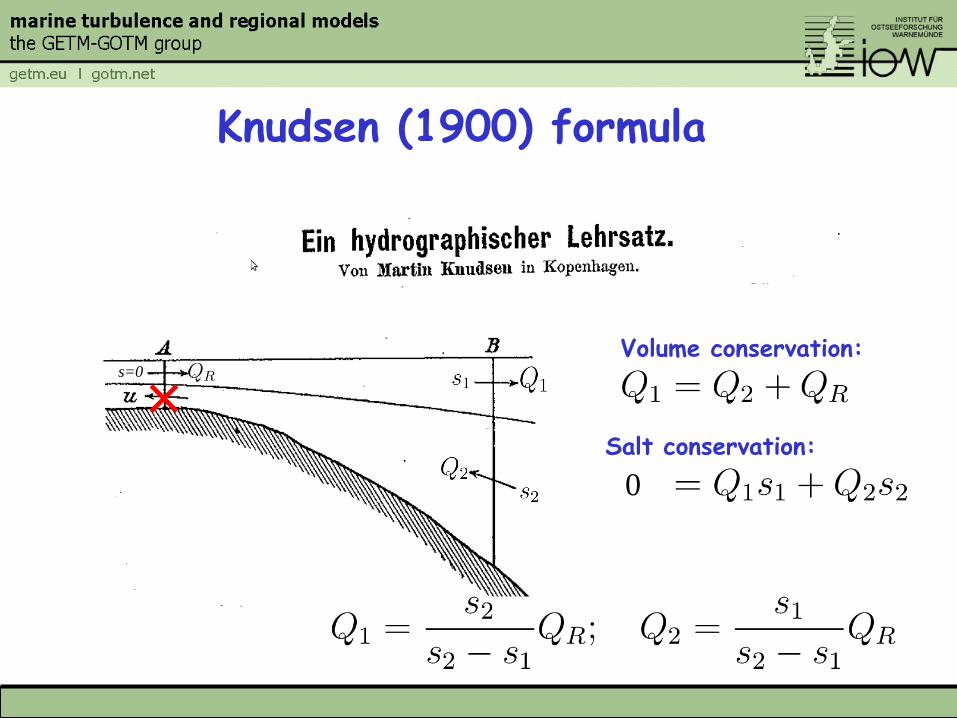
Knudsen (1900) formula
s=0
Volume conservation:
Salt conservation:
0
A: Some fundamental hydrodynamics
B: Overturning circulation in the Baltic Sea
C: Overturning circulation in the Wadden Sea
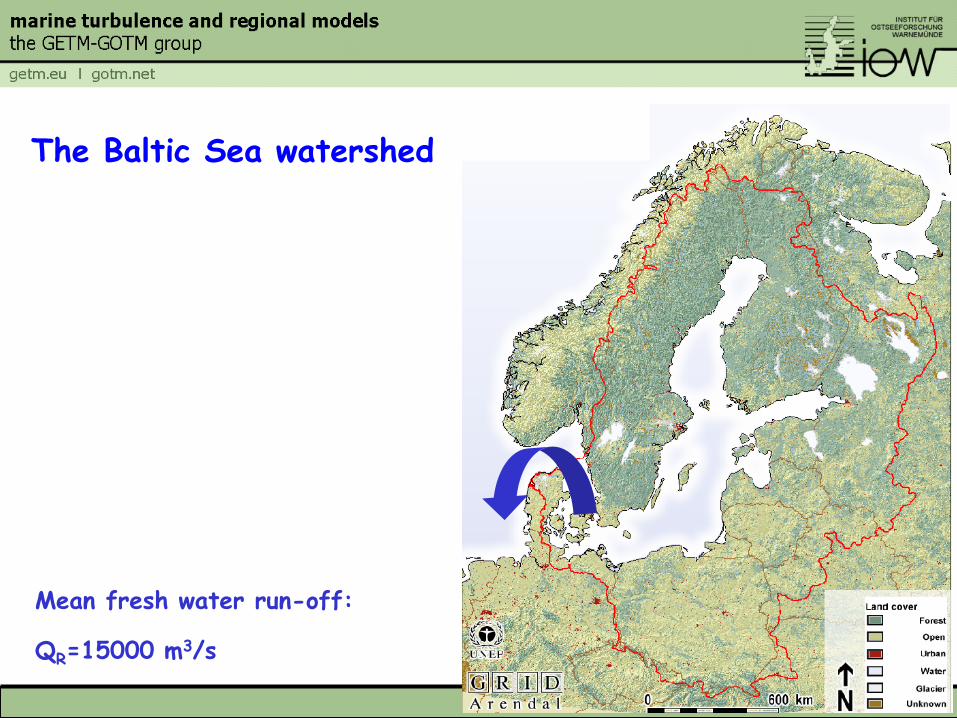
The Baltic Sea watershed
Mean fresh water run-off: QR=15000 m
3/s
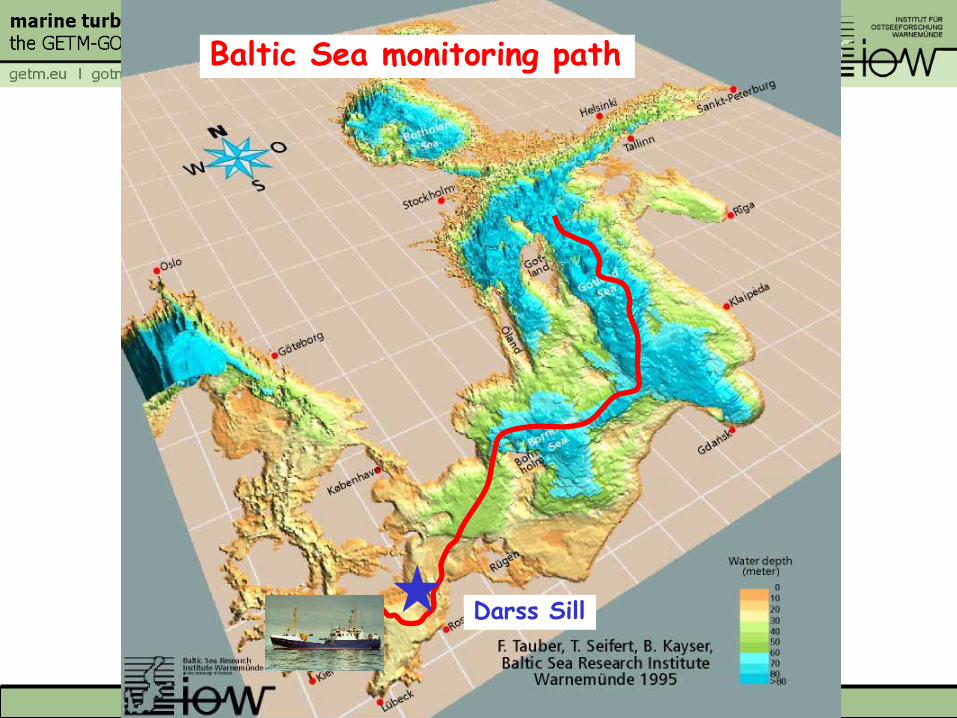
Baltic Sea monitoring path
Darss Sill
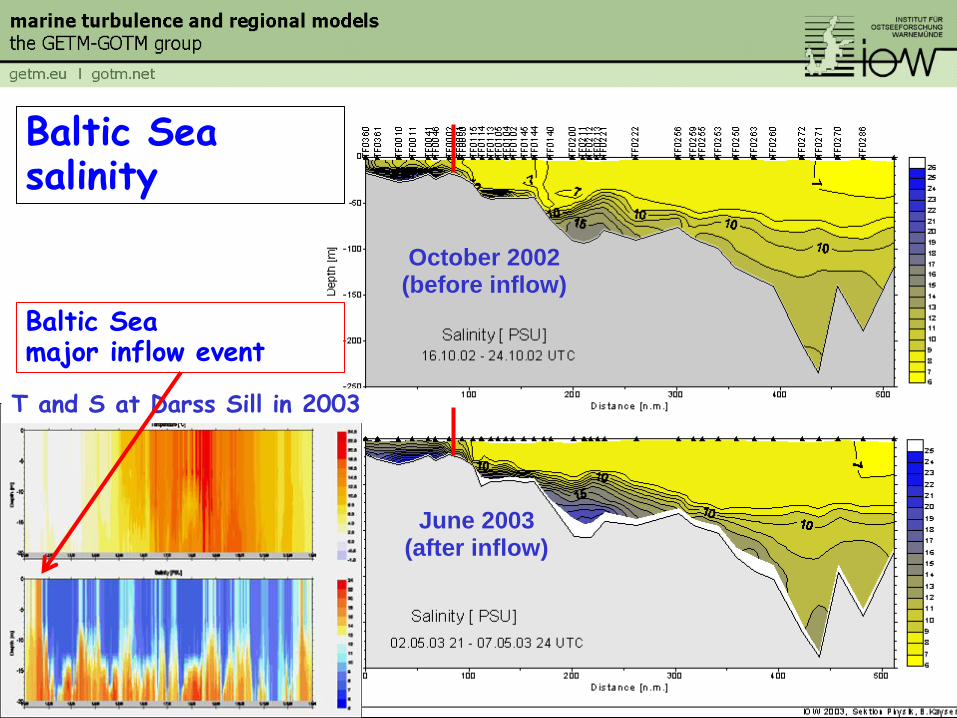
T and S at Darss Sill in 2003
Baltic Sea salinity
Baltic Sea major inflow event
October 2002 (before inflow)
June 2003 (after inflow)
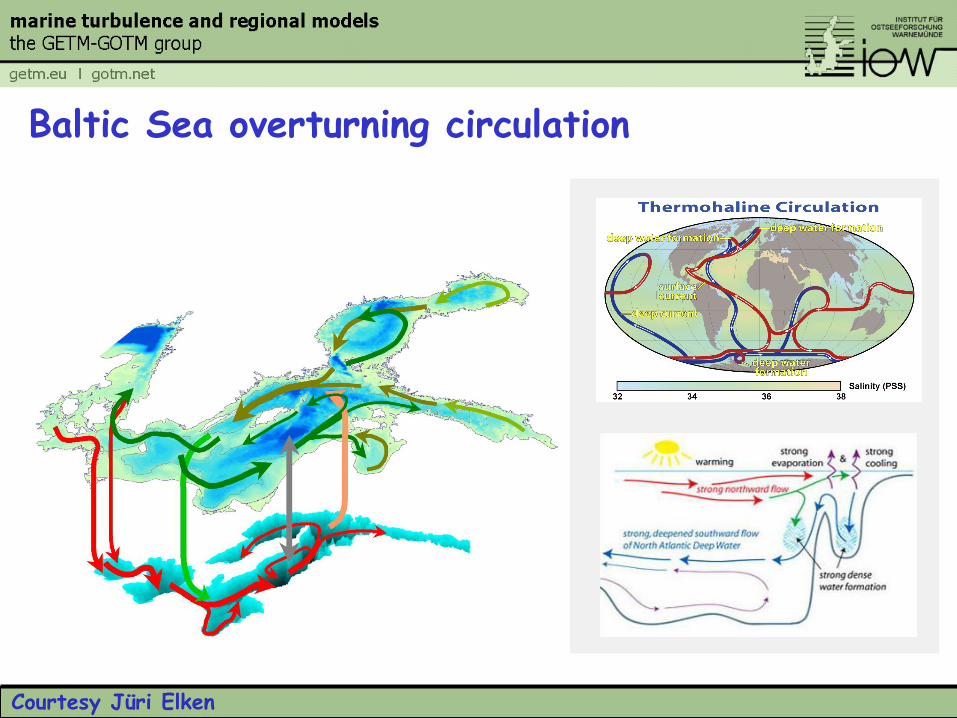
Baltic Sea overturning circulation
Courtesy Jüri Elken
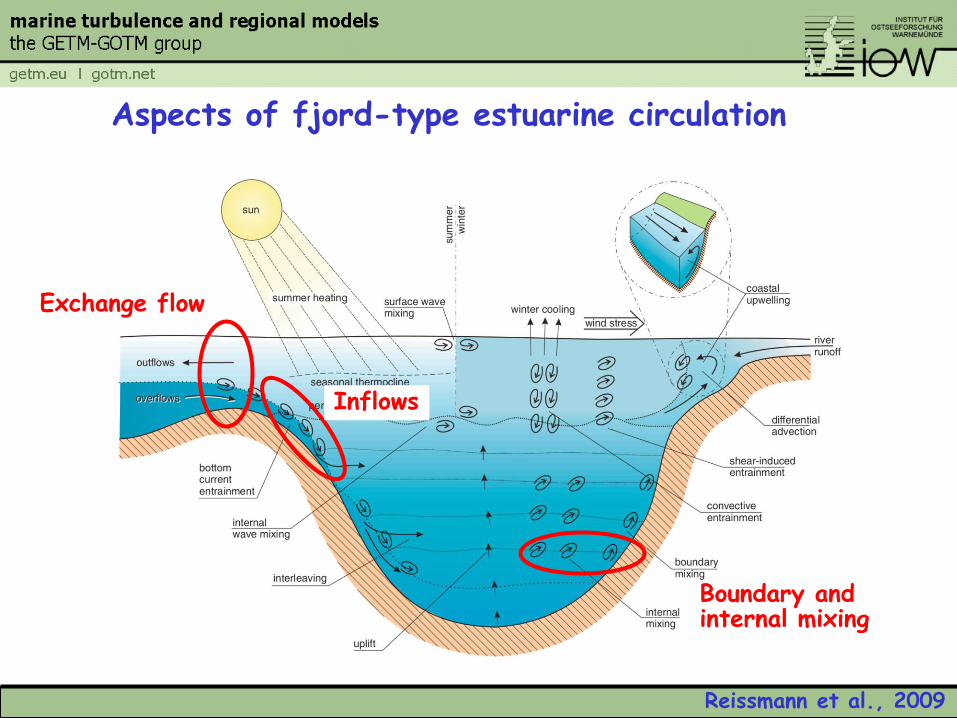
Aspects of fjord-type estuarine circulation
Reissmann et al., 2009
Exchange flow
Inflows
Boundary and internal mixing
Computersimulation Western Baltic Sea
Computersimulation Western Baltic Sea
+
+
+
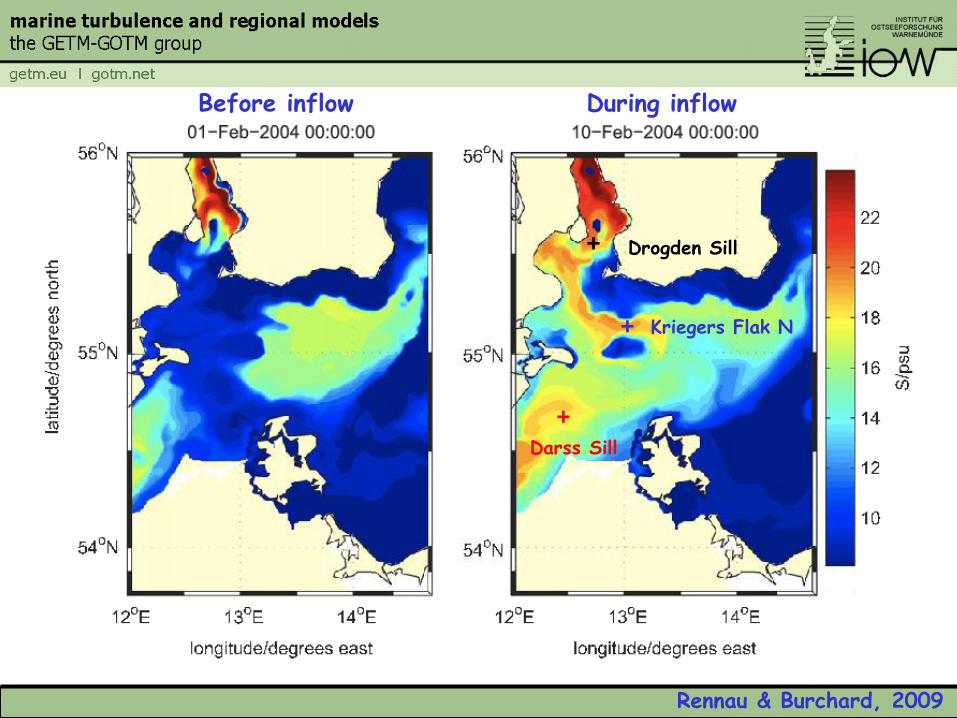
Drogden Sill
Darss Sill
Kriegers Flak N
Before inflow During inflow
Rennau & Burchard, 2009
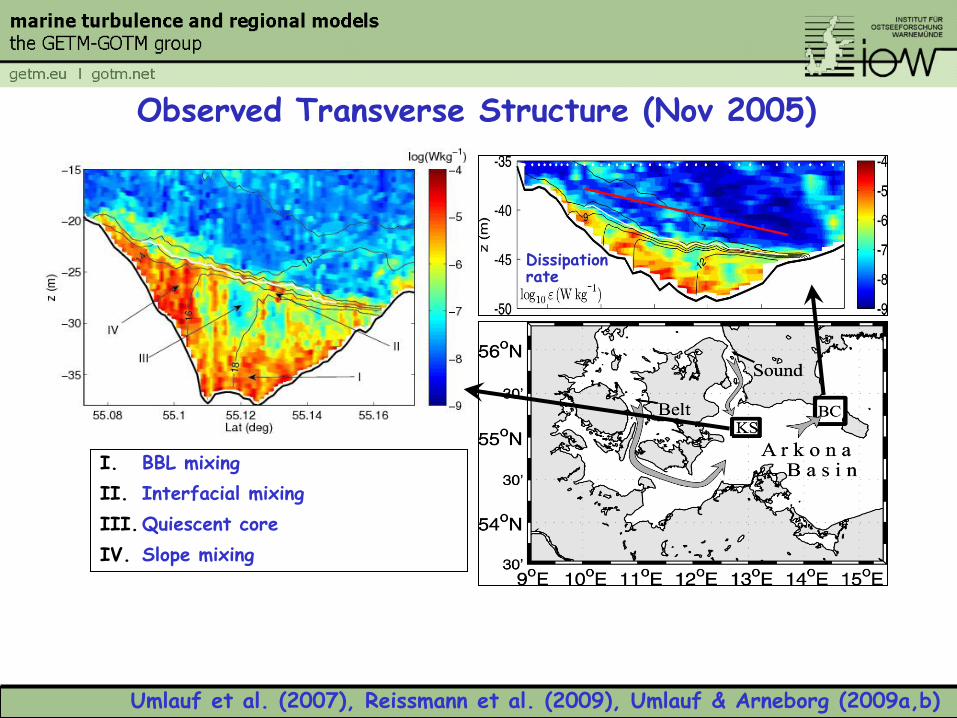
Observed Transverse Structure (Nov 2005)
• wegde-shaped interface
• interface jet
• lateral buoyancy gradient in interior
• three-layer transverse circulation
Umlauf et al., GRL, (2007)
Dissipation rate
Down-channel velocity
Cross-channel velocity
I. BBL mixing
II. Interfacial mixing
III.Quiescent core
IV. Slope mixing
Umlauf et al. (2007), Reissmann et al. (2009), Umlauf & Arneborg (2009a,b)
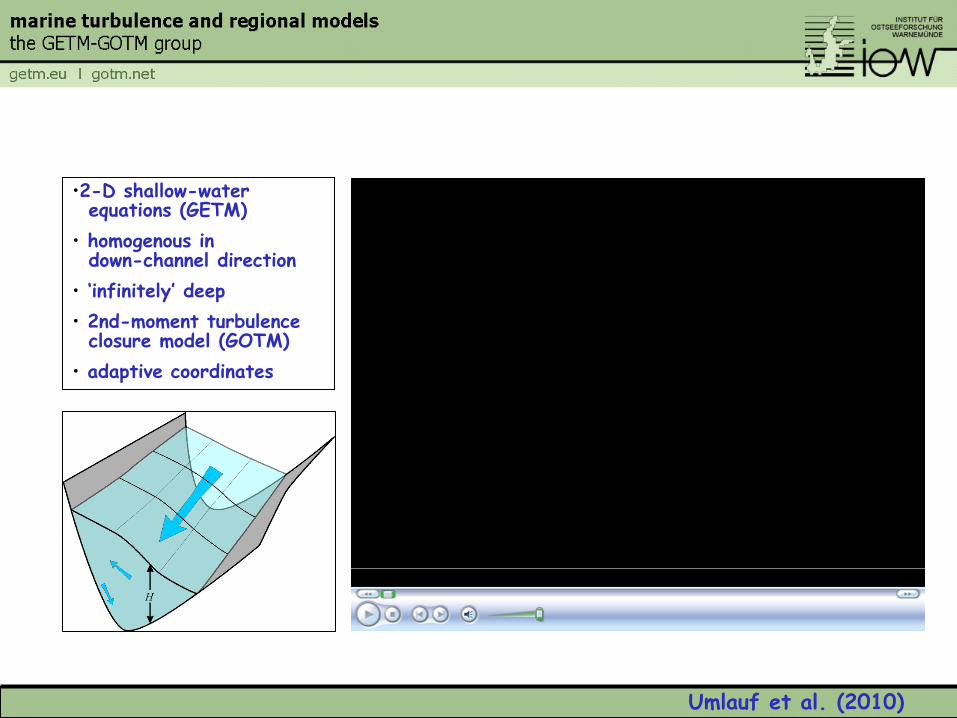
Which is the most simple model that can reproduce this?
•2-D shallow-water equations (GETM)
• homogenous in down-channel direction
• ‘infinitely’ deep
• 2nd-moment turbulence closure model (GOTM)
• adaptive coordinates
Umlauf et al. (2010)
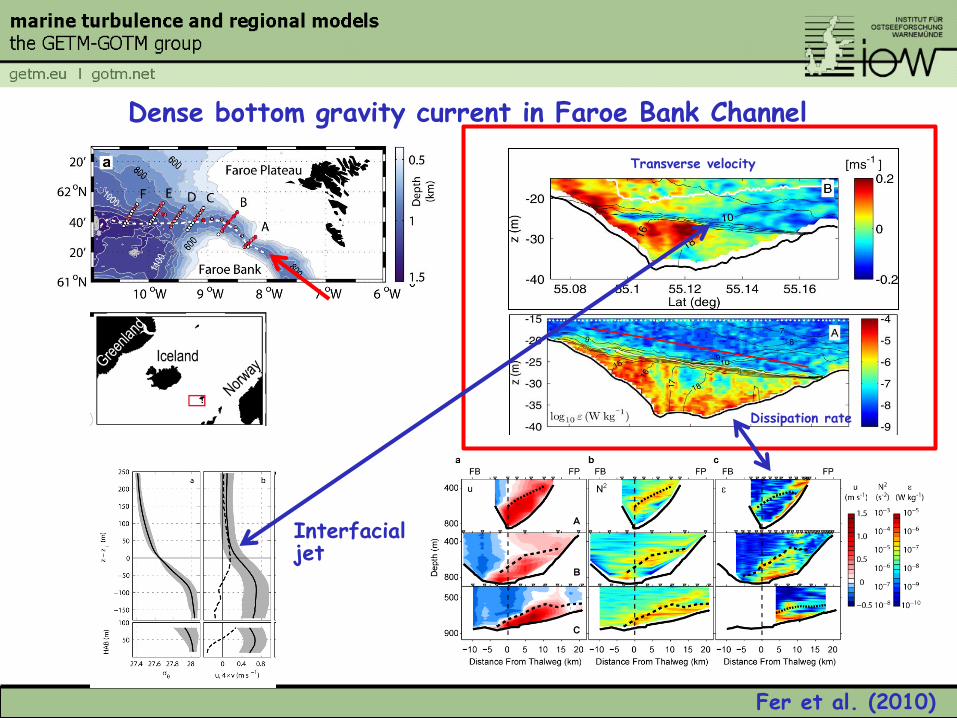
Fer et al. (2010)
Dense bottom gravity current in Faroe Bank Channel
Dissipation rate
Transverse velocity
Interfacial jet
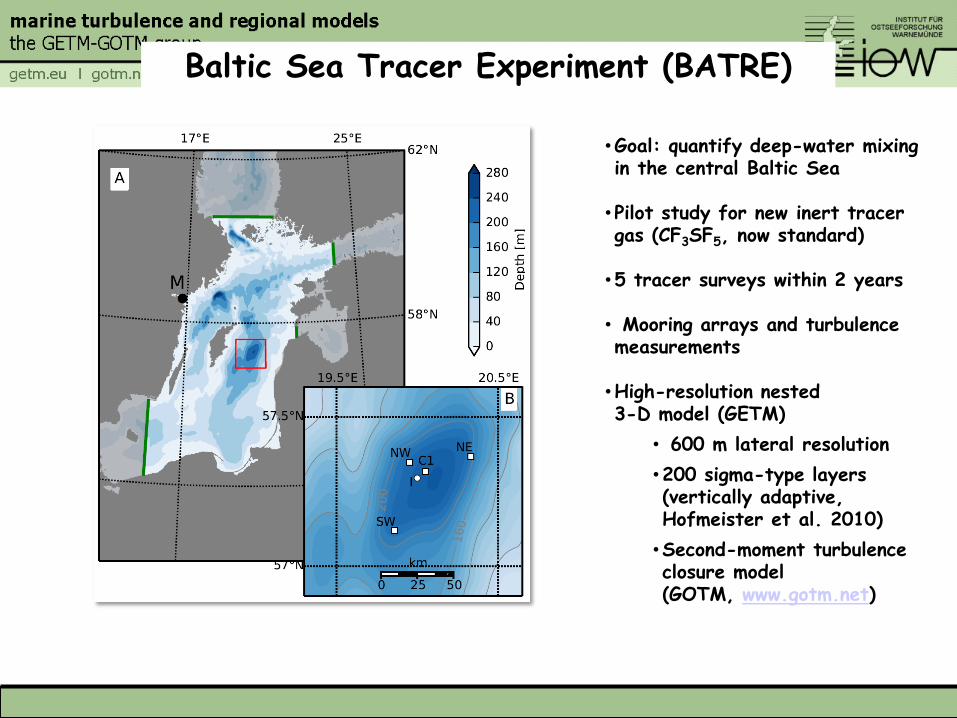
Baltic Sea Tracer Experiment (BATRE)
•Goal: quantify deep-water mixing in the central Baltic Sea
• Pilot study for new inert tracer gas (CF3SF5, now standard)
•5 tracer surveys within 2 years
• Mooring arrays and turbulence measurements
•High-resolution nested 3-D model (GETM)
• 600 m lateral resolution
•200 sigma-type layers (vertically adaptive, Hofmeister et al. 2010)
•Second-moment turbulence closure model (GOTM, www.gotm.net)
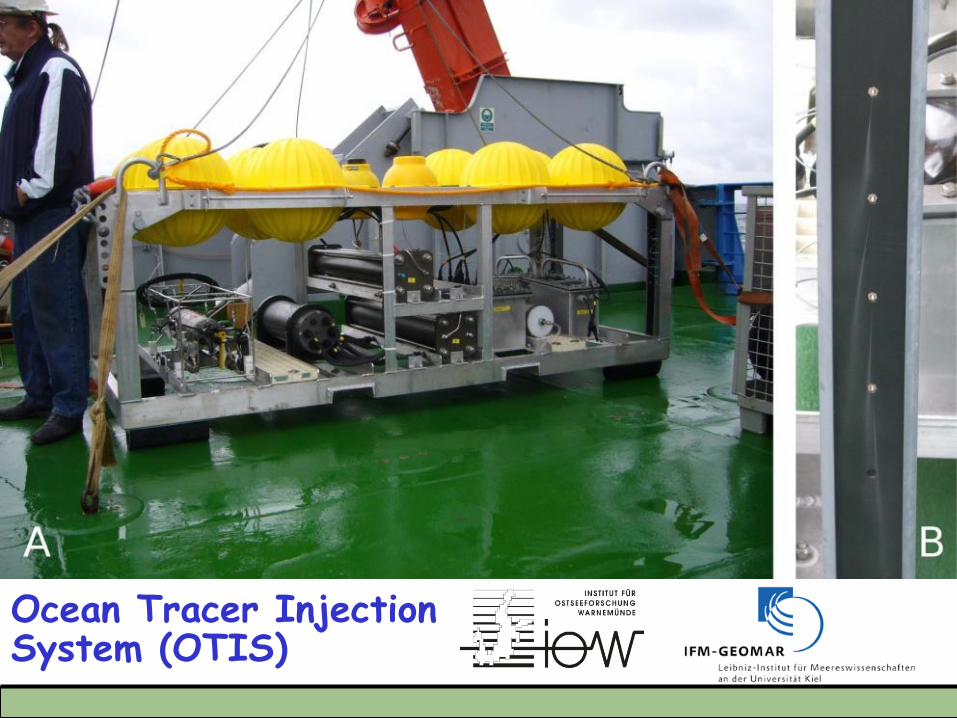
Ocean Tracer Injection System (OTIS)
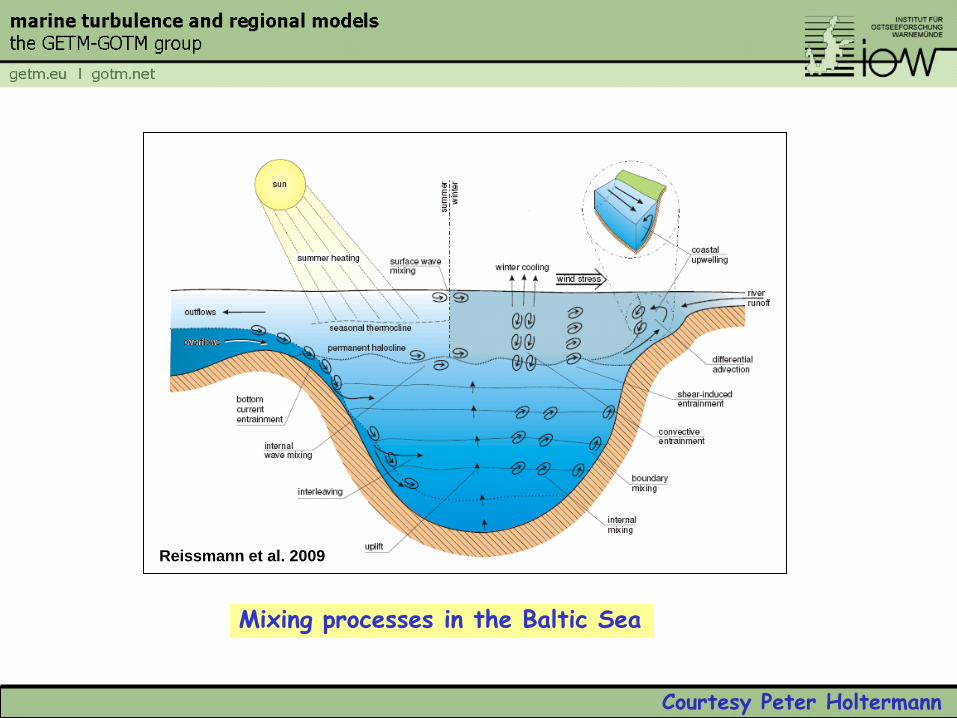
Mixing processes in the Baltic Sea
Reissmann et al. 2009
Courtesy Peter Holtermann
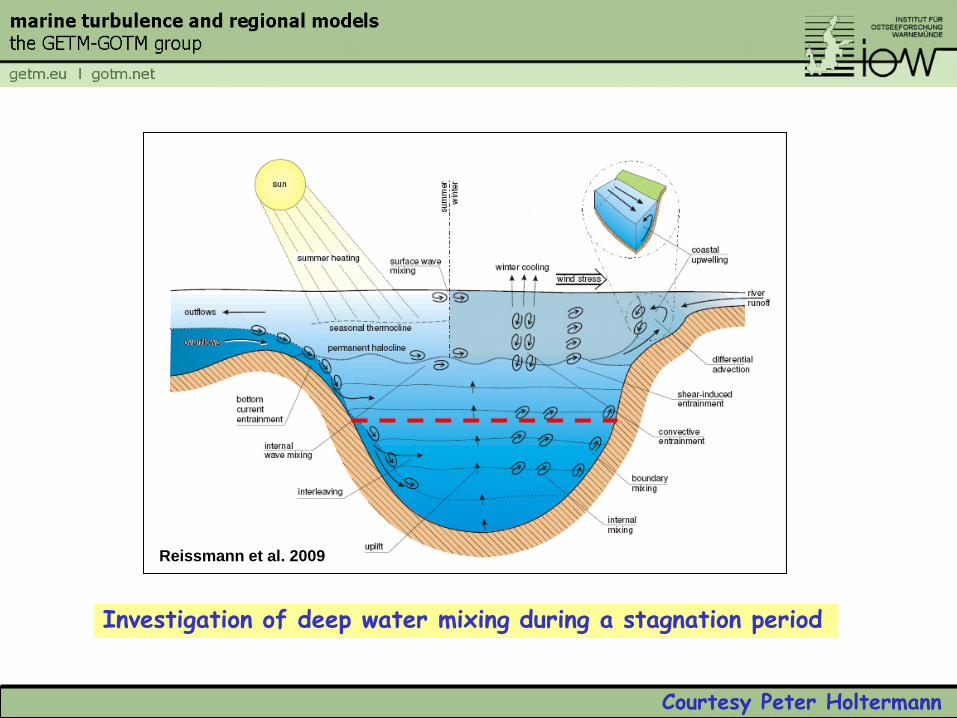
Investigation of deep water mixing during a stagnation period
Reissmann et al. 2009
Courtesy Peter Holtermann
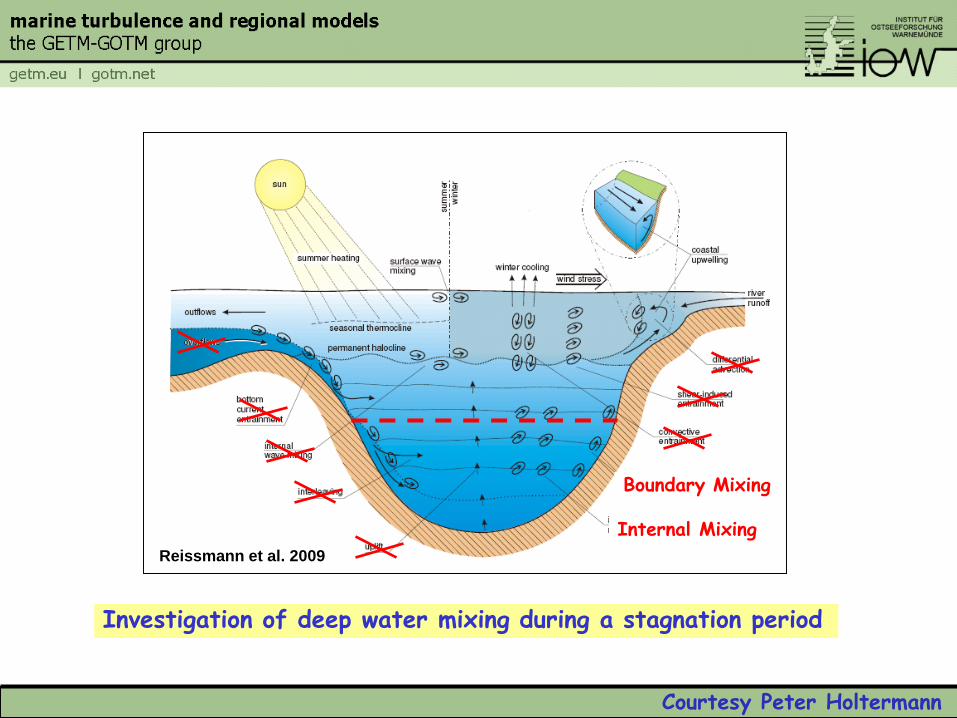
Reissmann et al. 2009
Boundary Mixing
Internal Mixing
Courtesy Peter Holtermann
Investigation of deep water mixing during a stagnation period
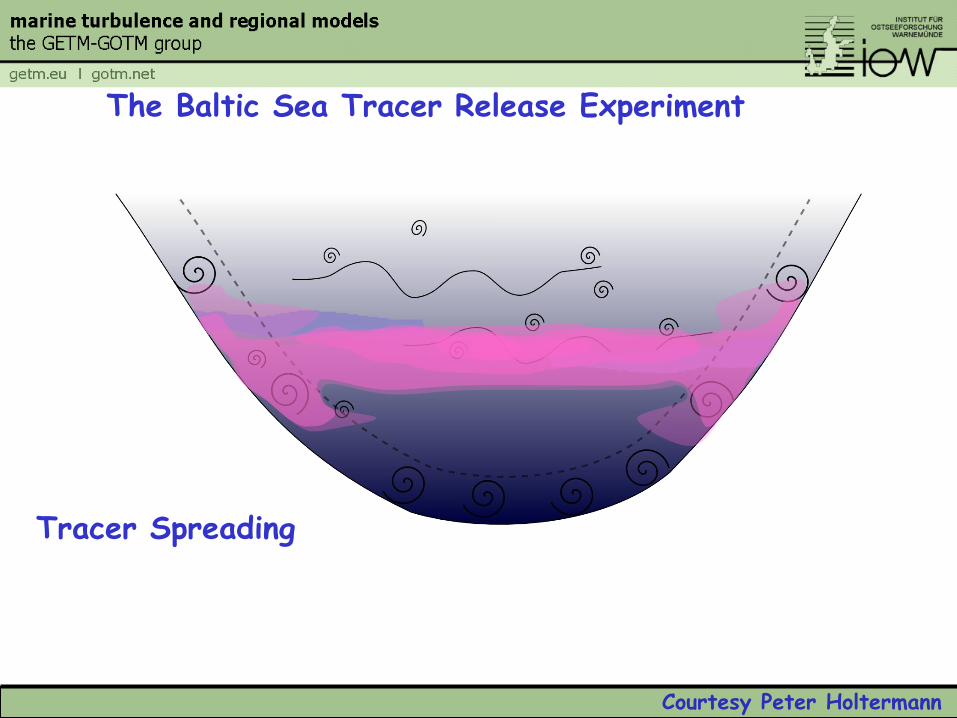
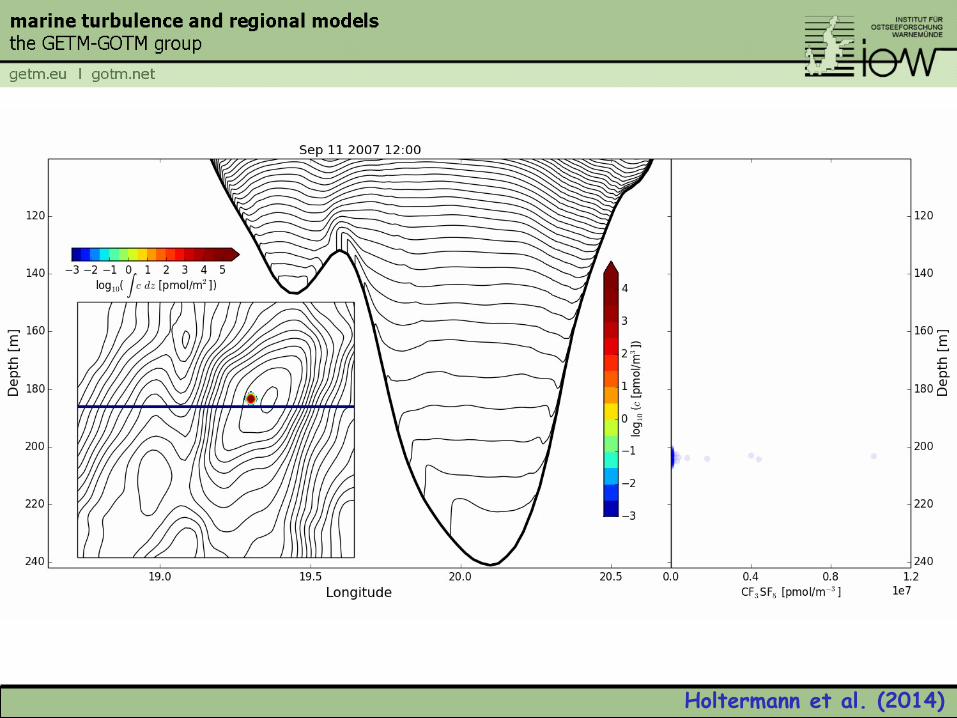
The Baltic Sea Tracer Release Experiment
Tracer Spreading
Courtesy Peter Holtermann
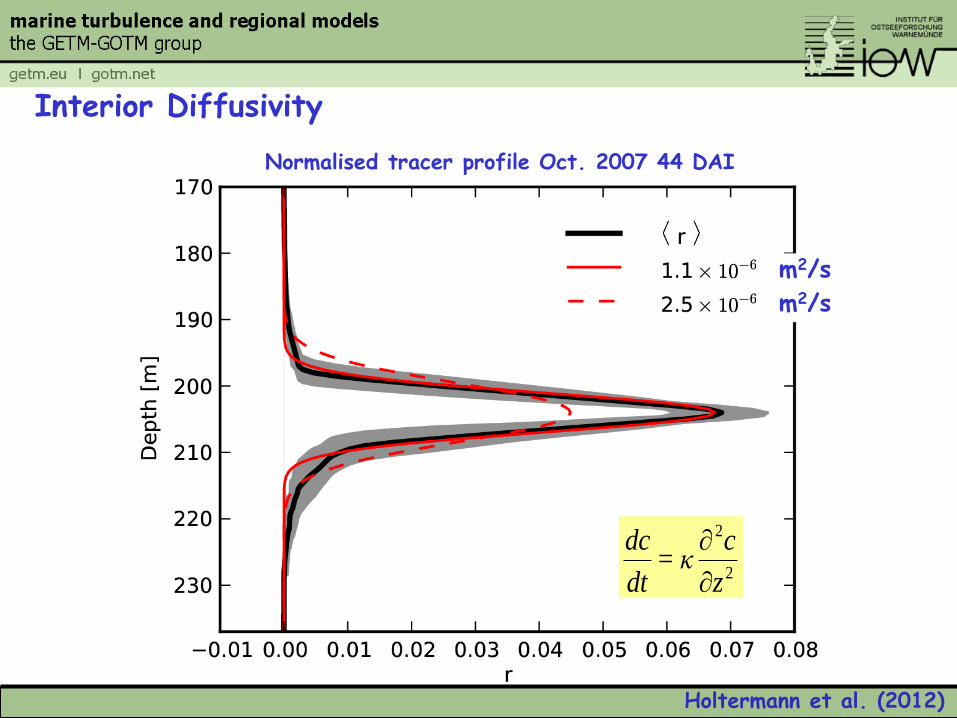
Interior Diffusivity
Normalised tracer profile Oct. 2007 44 DAI
2
2
z
cκ=
dt
dc
m2/s
m2/s
Holtermann et al. (2012)
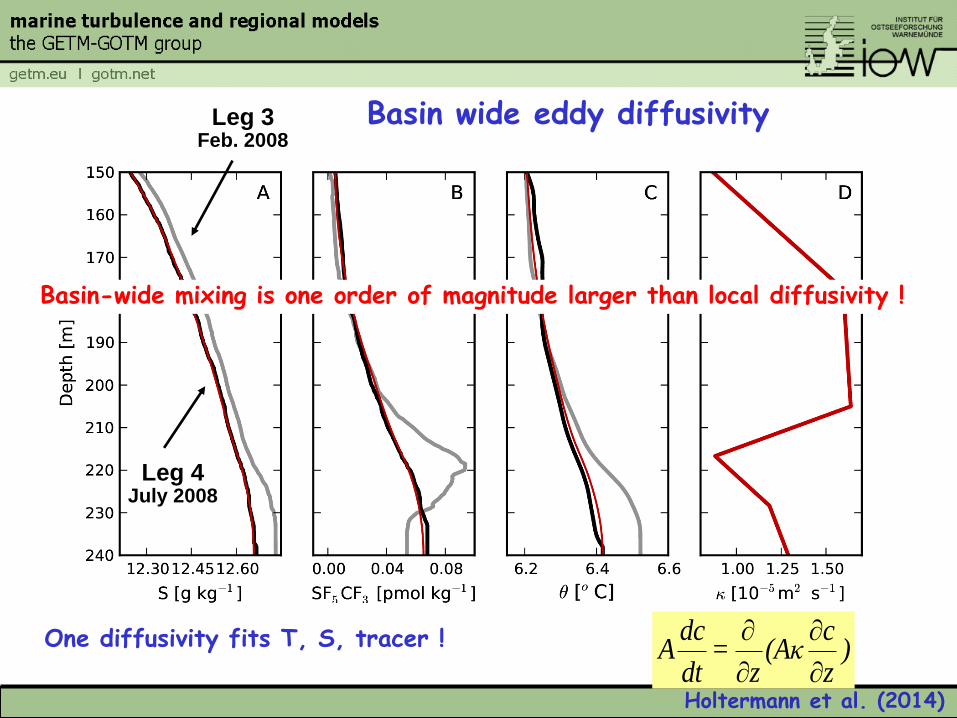
One diffusivity fits T, S, tracer !
Basin wide eddy diffusivity Leg 3 Feb. 2008
Leg 4 July 2008
)z
c(Aκ
z=
dt
dcA
Basin-wide mixing is one order of magnitude larger than local diffusivity !
Holtermann et al. (2014)
Holtermann et al. (2014)
A: Some fundamental hydrodynamics
B: Overturning circulation in the Baltic Sea
C: Overturning circulation in the Wadden Sea
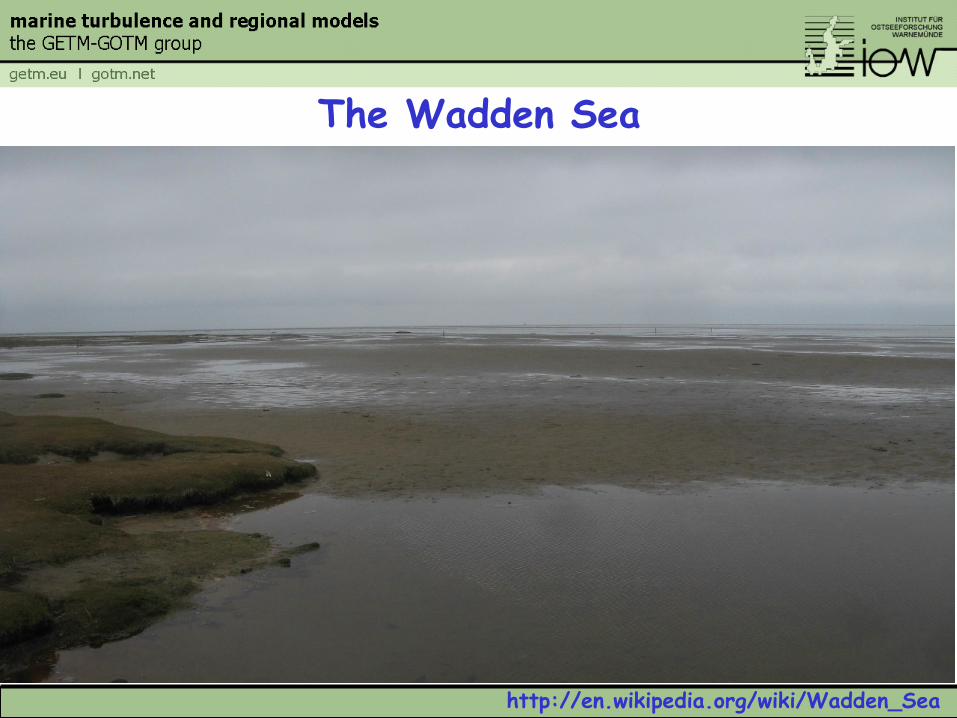
The Wadden Sea
http://en.wikipedia.org/wiki/Wadden_Sea
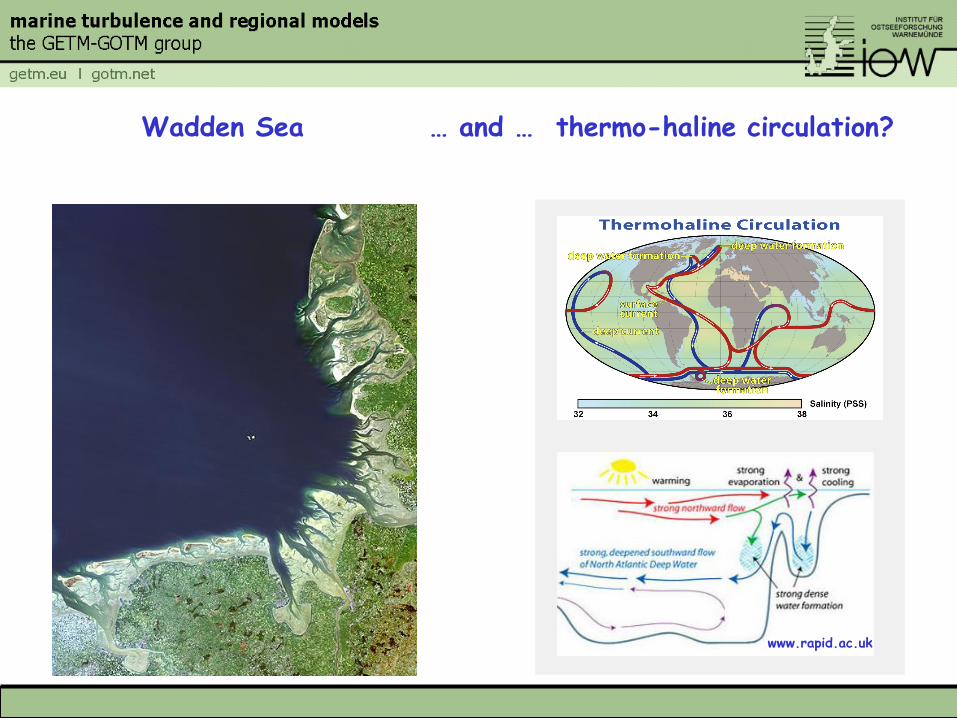
www.rapid.ac.uk
Wadden Sea … and … thermo-haline circulation?
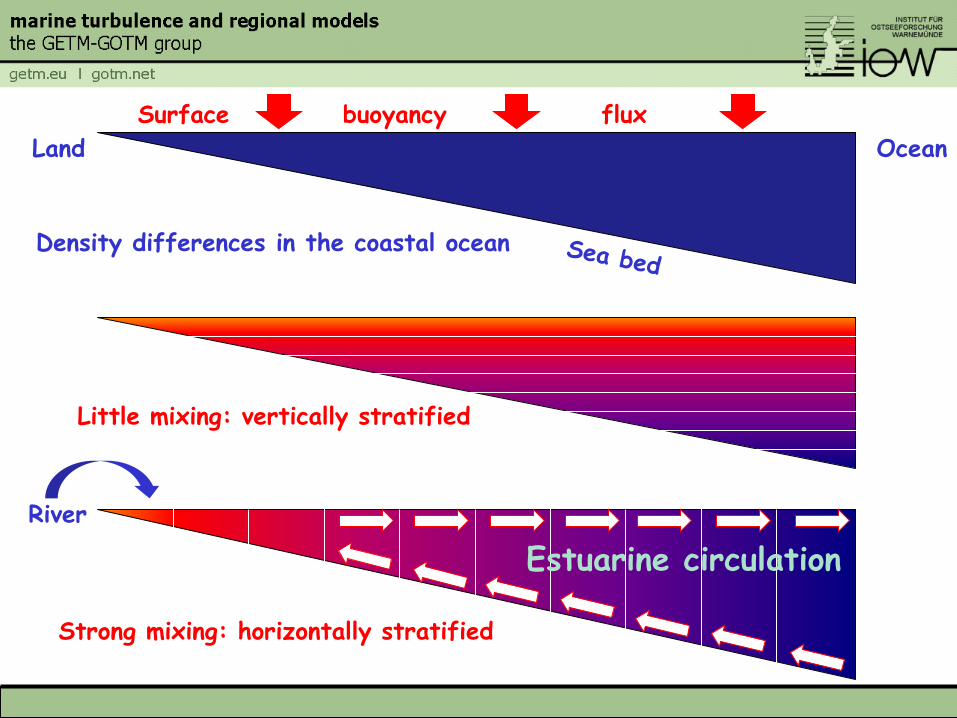
Surface buoyancy flux
Little mixing: vertically stratified
Strong mixing: horizontally stratified
Land Ocean
Density differences in the coastal ocean
Estuarine circulation
River
46
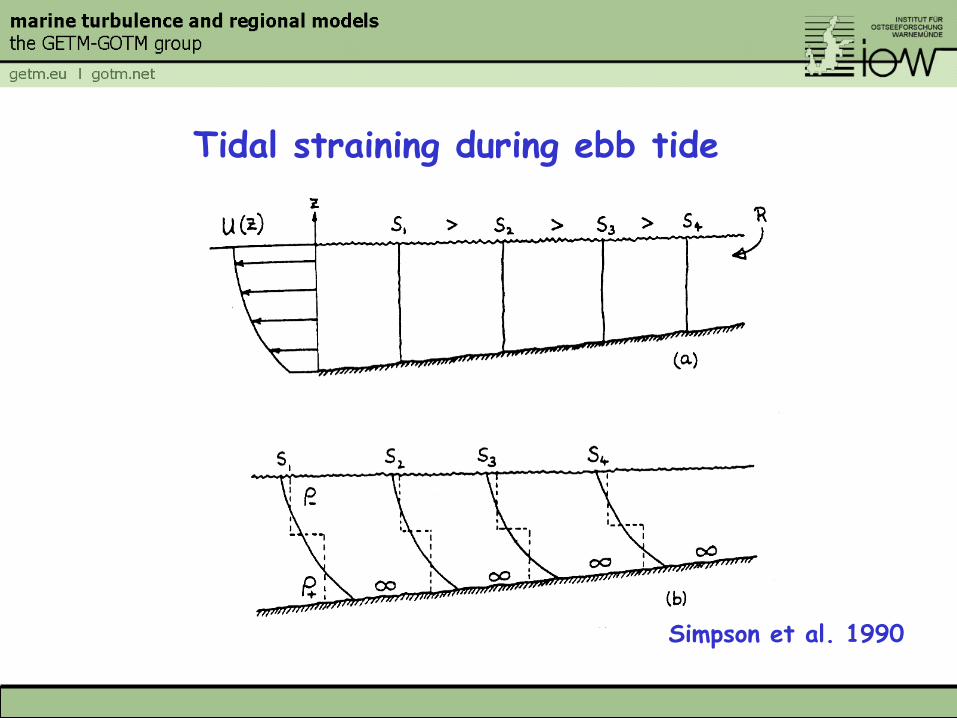
Tidal straining during ebb tide
Simpson et al. 1990
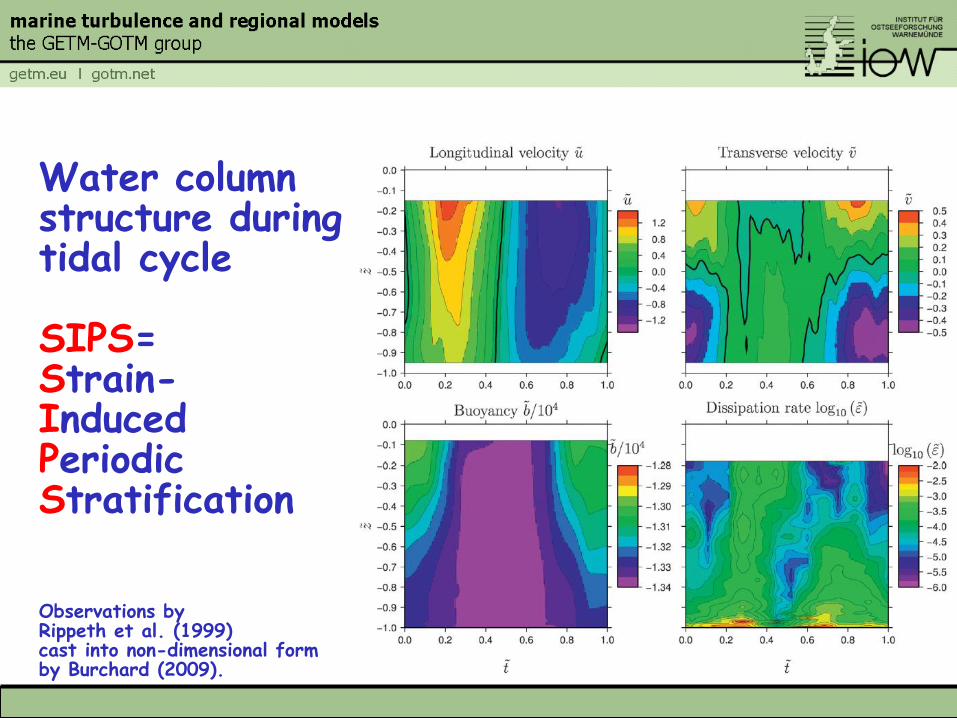
Water column structure during tidal cycle SIPS= Strain- Induced Periodic Stratification Observations by Rippeth et al. (1999) cast into non-dimensional form by Burchard (2009).
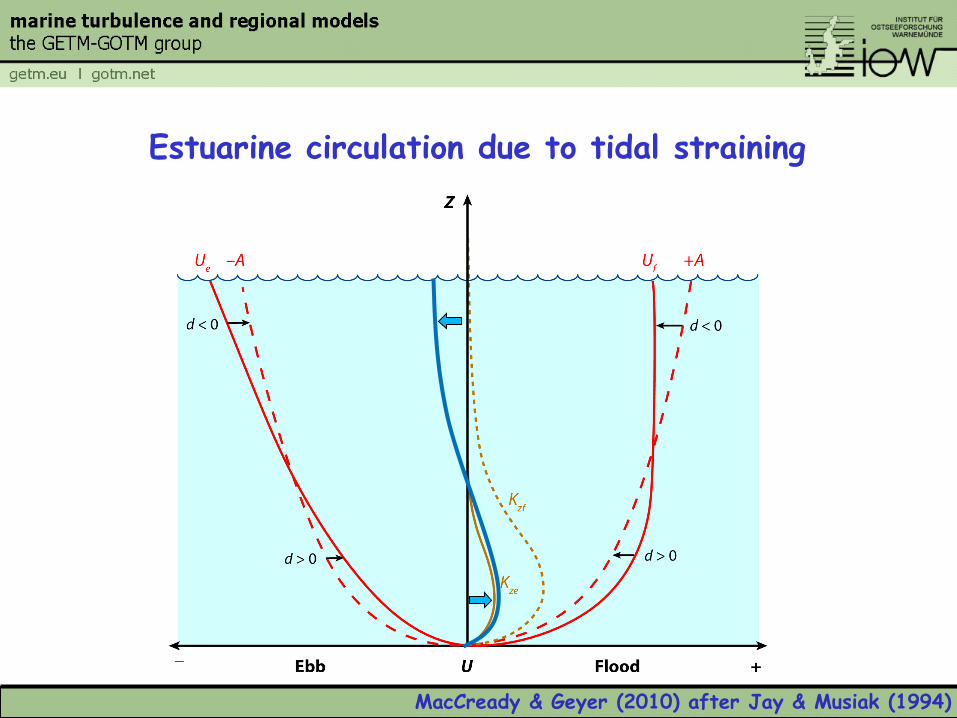
MacCready & Geyer (2010) after Jay & Musiak (1994)
Estuarine circulation due to tidal straining
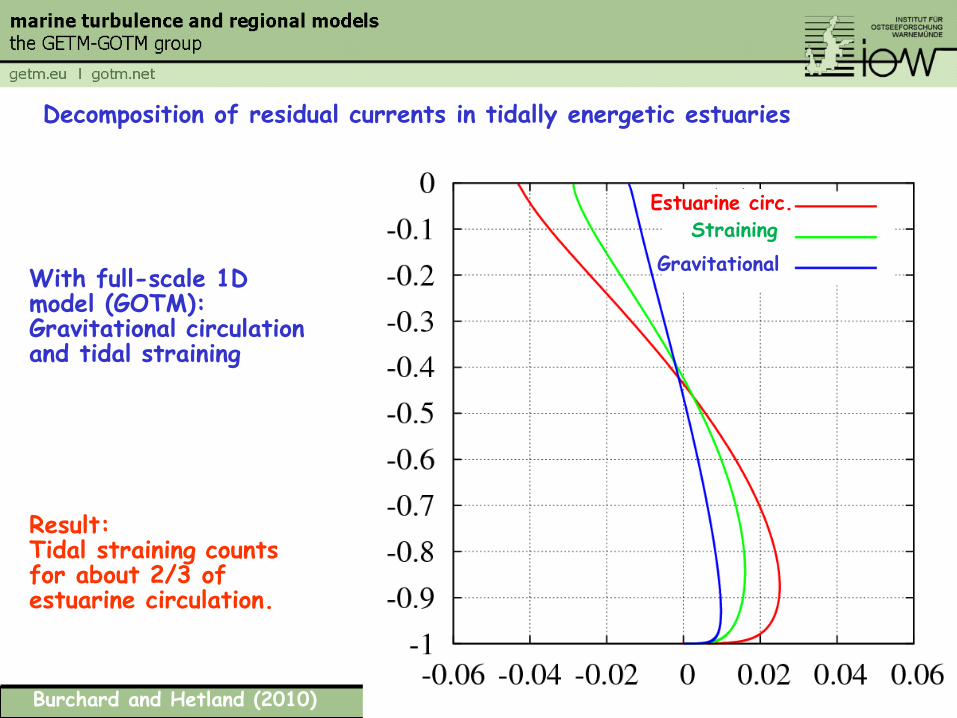
Result: Tidal straining counts for about 2/3 of estuarine circulation.
With full-scale 1D model (GOTM): Gravitational circulation and tidal straining
Burchard and Hetland (2010)
Estuarine circ.
Straining
Gravitational
Decomposition of residual currents in tidally energetic estuaries
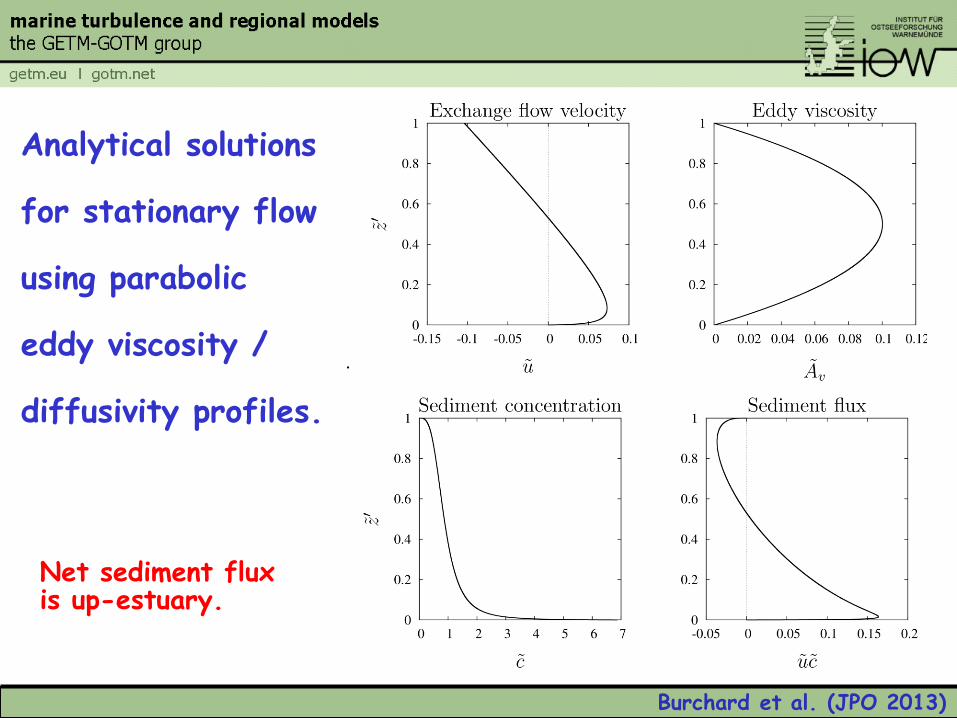
Net sediment flux is up-estuary.
Analytical solutions for stationary flow using parabolic eddy viscosity / diffusivity profiles.
Burchard et al. (JPO 2013)
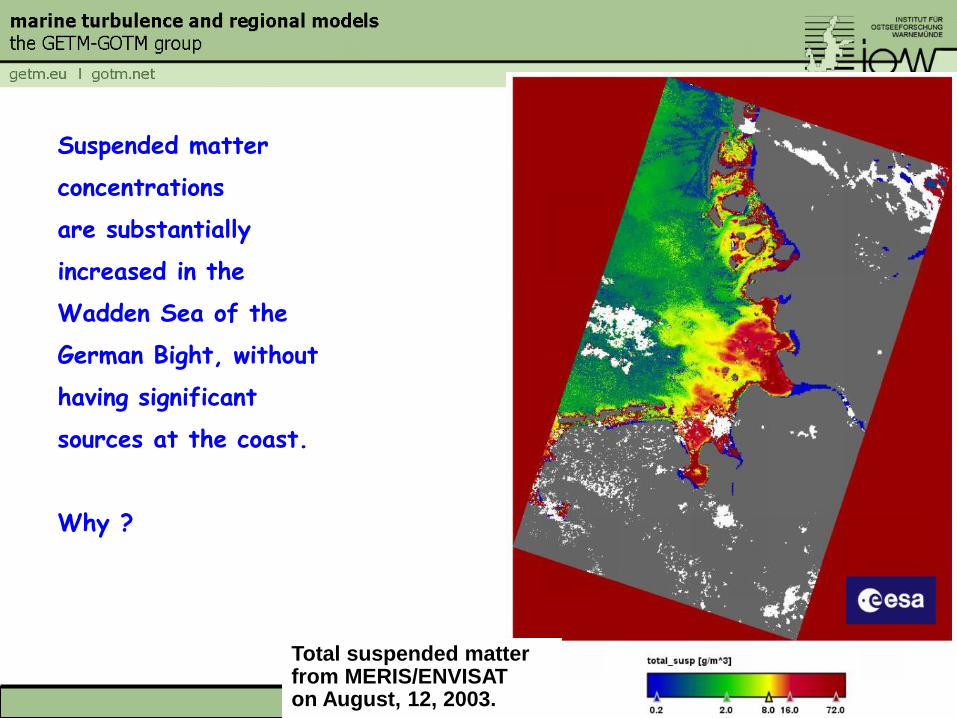
Suspended matter
concentrations
are substantially
increased in the
Wadden Sea of the
German Bight, without
having significant
sources at the coast.
Why ?
Total suspended matter from MERIS/ENVISAT on August, 12, 2003.
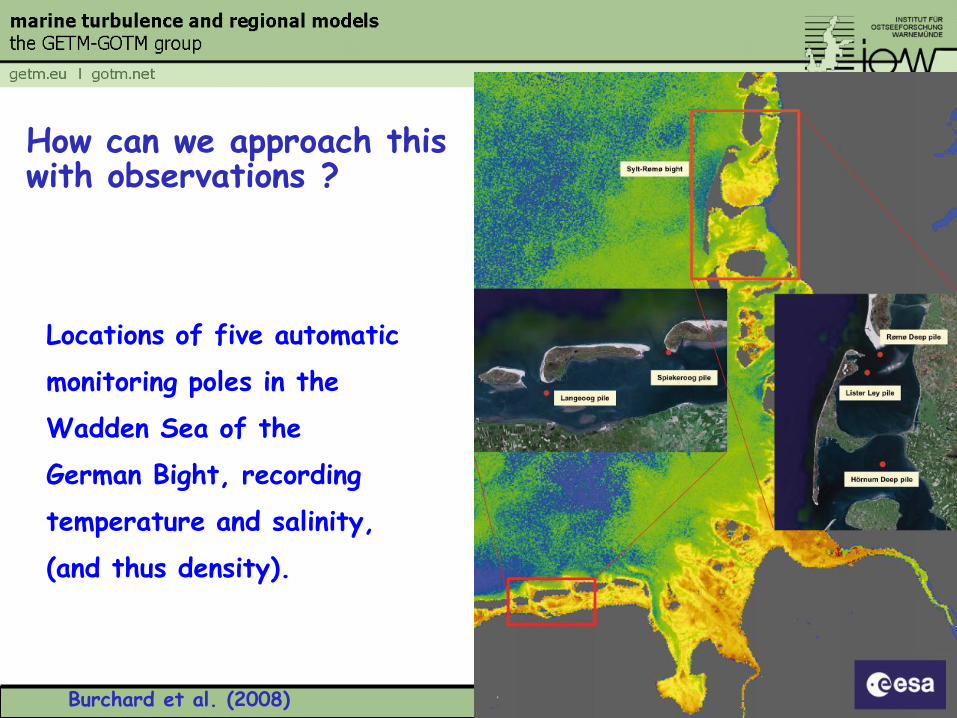
Locations of five automatic
monitoring poles in the
Wadden Sea of the
German Bight, recording
temperature and salinity,
(and thus density).
How can we approach this with observations ?
Burchard et al. (2008)
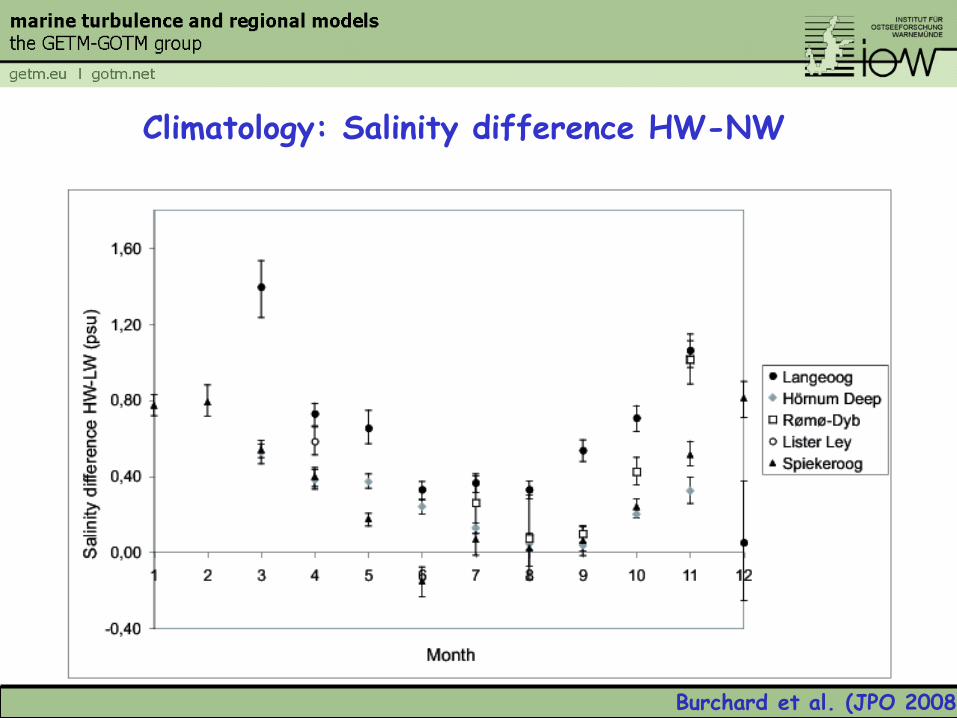
Climatology: Salinity difference HW-NW
Burchard et al. (JPO 2008)
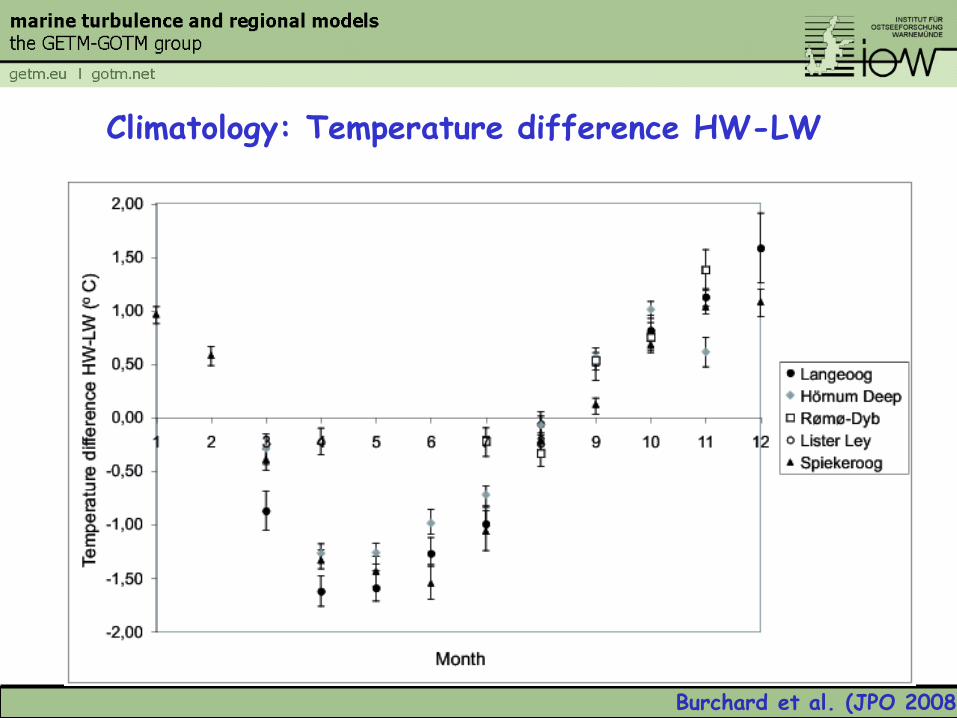
Climatology: Temperature difference HW-LW
Burchard et al. (JPO 2008)
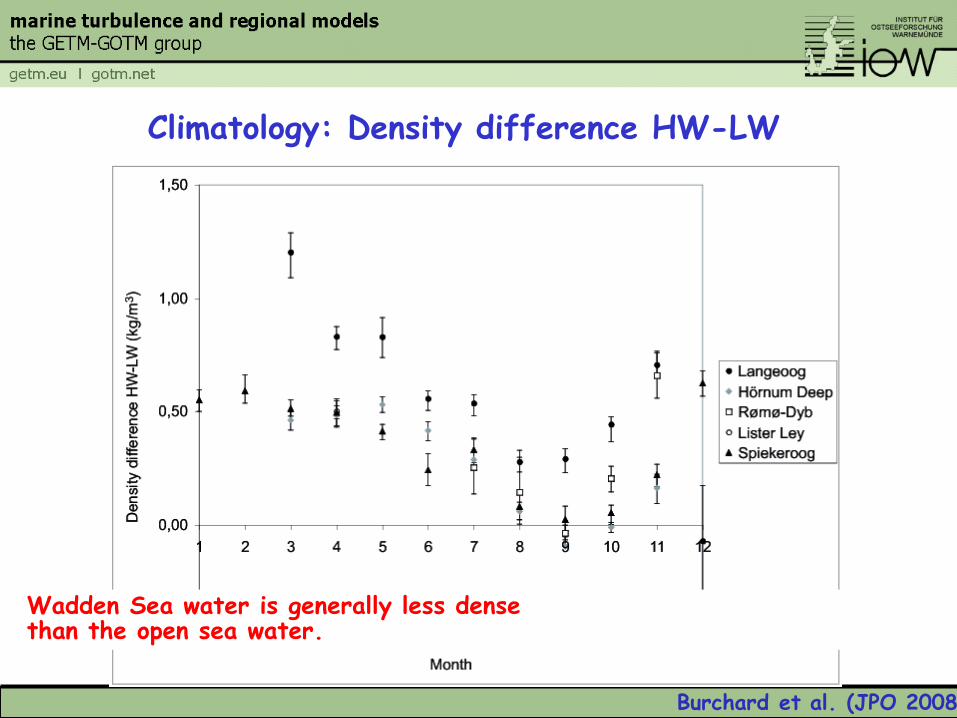
Climatology: Density difference HW-LW
Burchard et al. (JPO 2008)
Wadden Sea water is generally less dense than the open sea water.
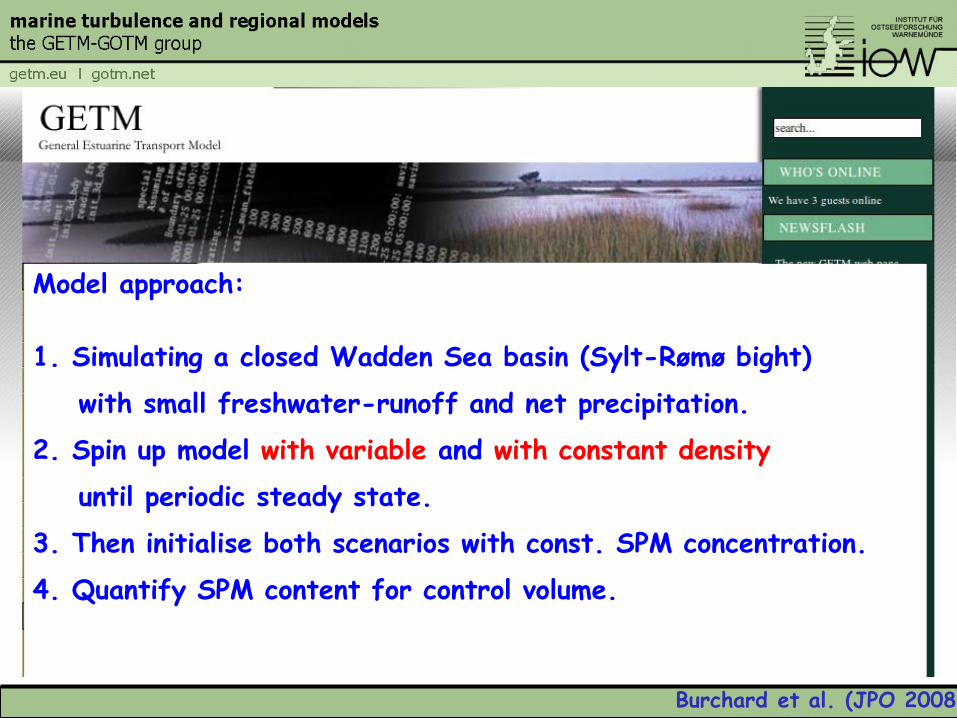
Model approach:
1. Simulating a closed Wadden Sea basin (Sylt-Rømø bight)
with small freshwater-runoff and net precipitation.
2. Spin up model with variable and with constant density
until periodic steady state.
3. Then initialise both scenarios with const. SPM concentration.
4. Quantify SPM content for control volume.
Burchard et al. (JPO 2008)
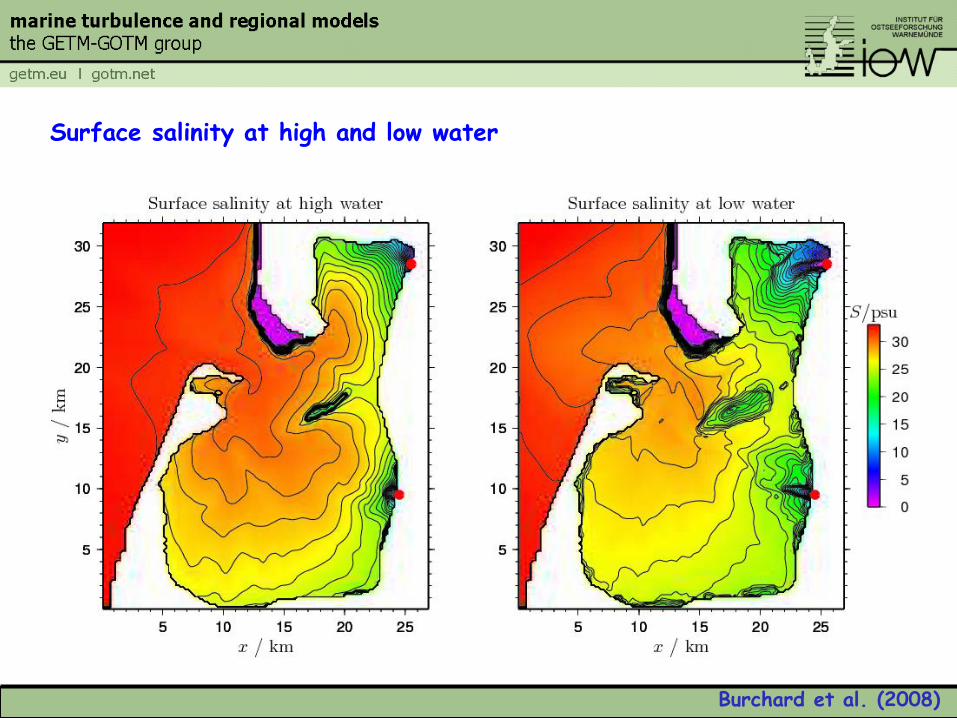
Surface salinity at high and low water
Burchard et al. (2008)
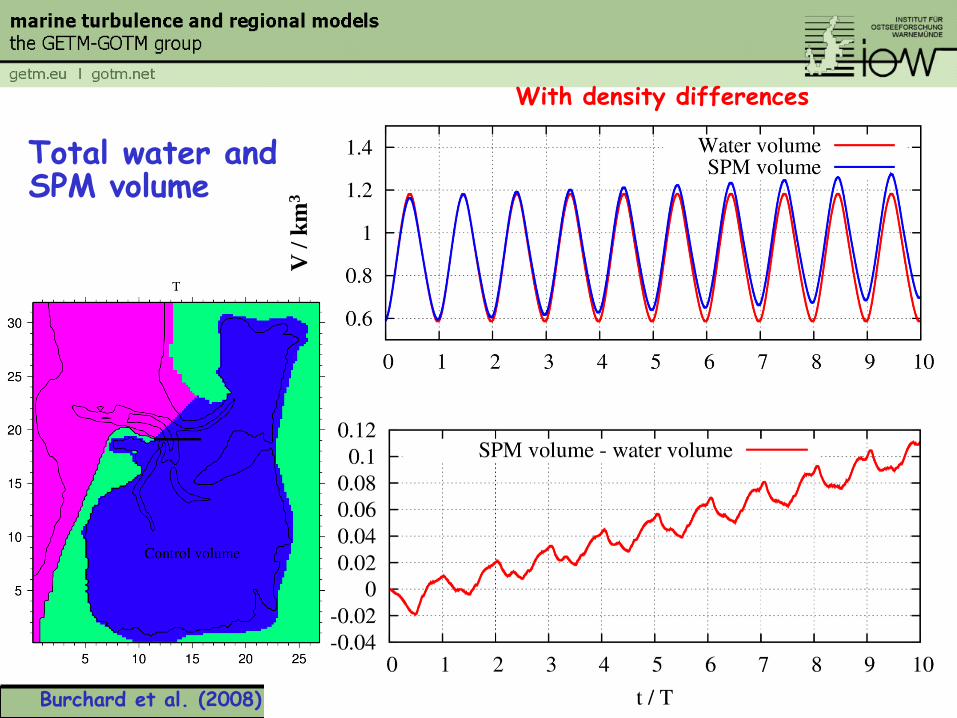
Total water and SPM volume
With density differences
V /
km
3
Burchard et al. (2008)
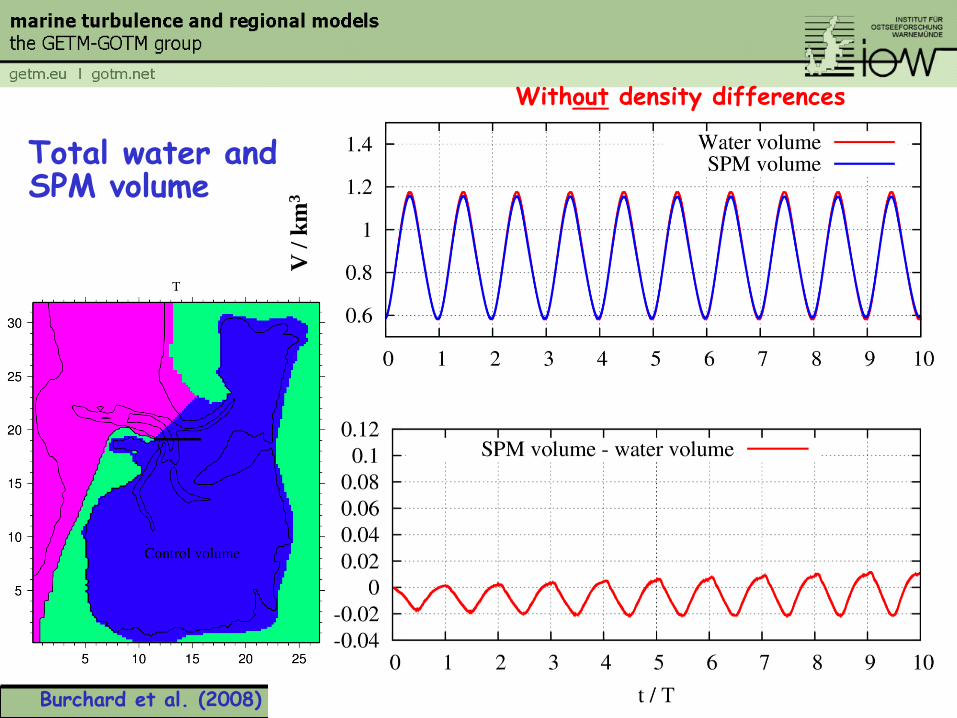
Total water and SPM volume
Without density differences
V /
km
3
Burchard et al. (2008)
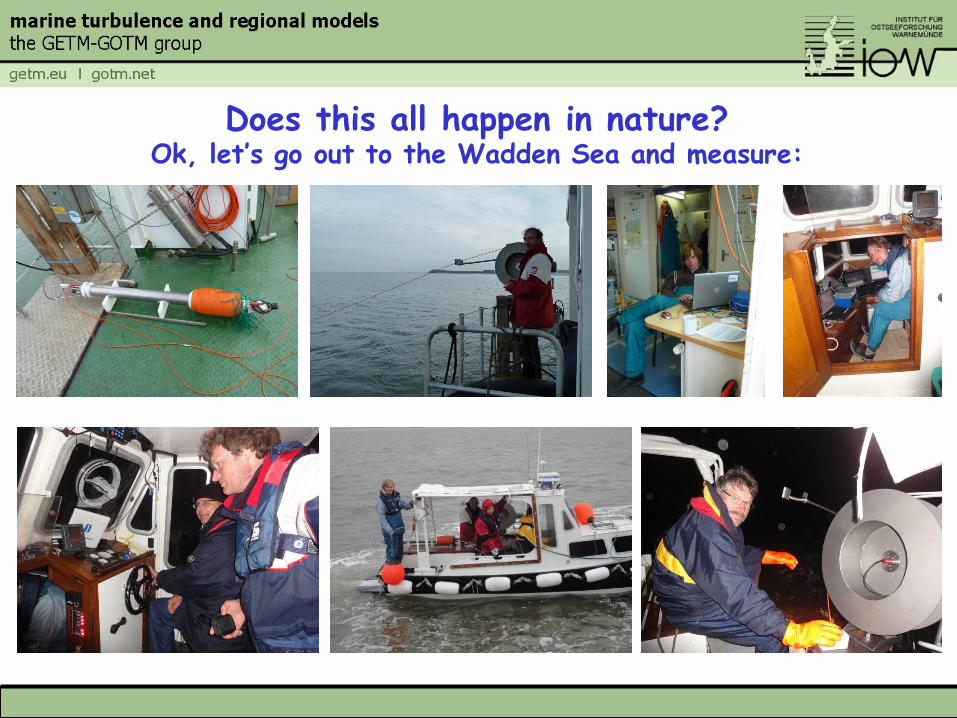
Does this all happen in nature? Ok, let’s go out to the Wadden Sea and measure:
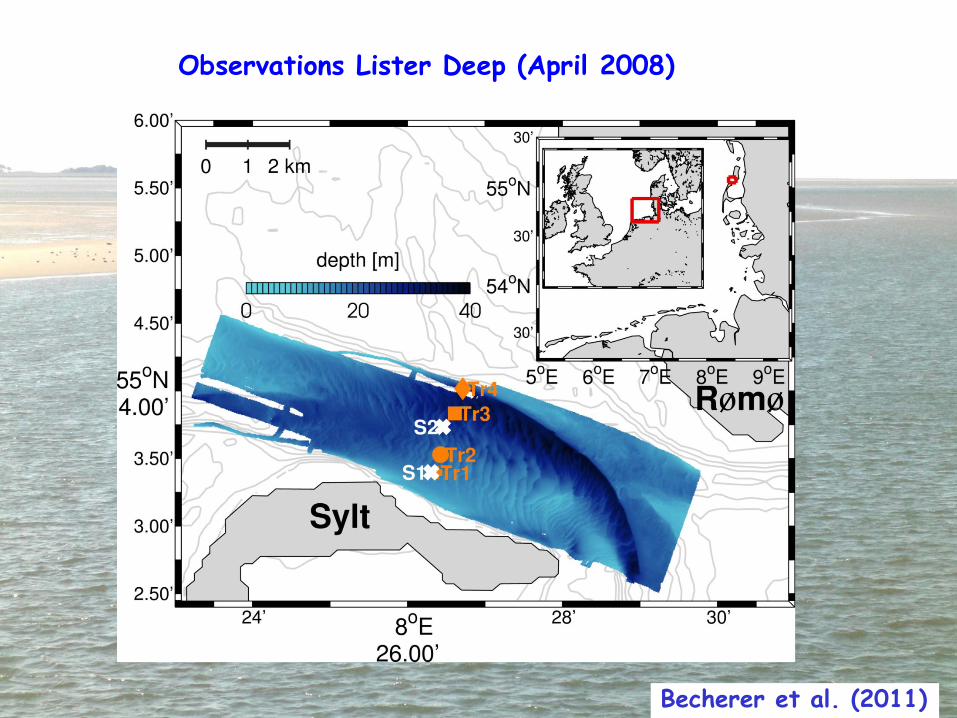
Observations Lister Deep (April 2008)
Becherer et al. (2011)
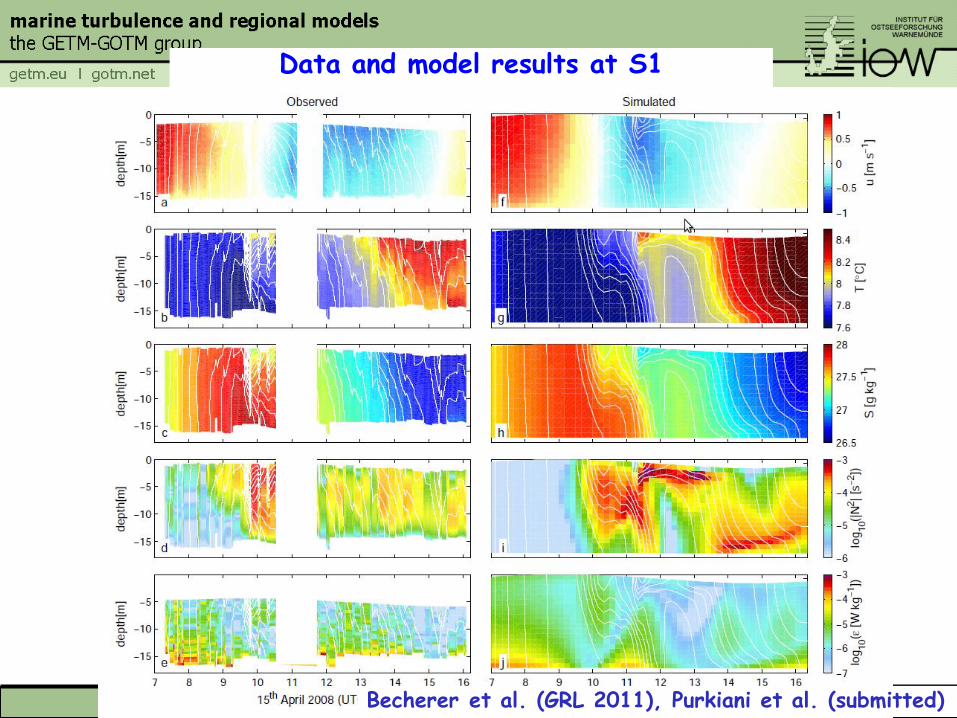
Becherer et al. (GRL 2011), Purkiani et al. (submitted)
Data and model results at S1
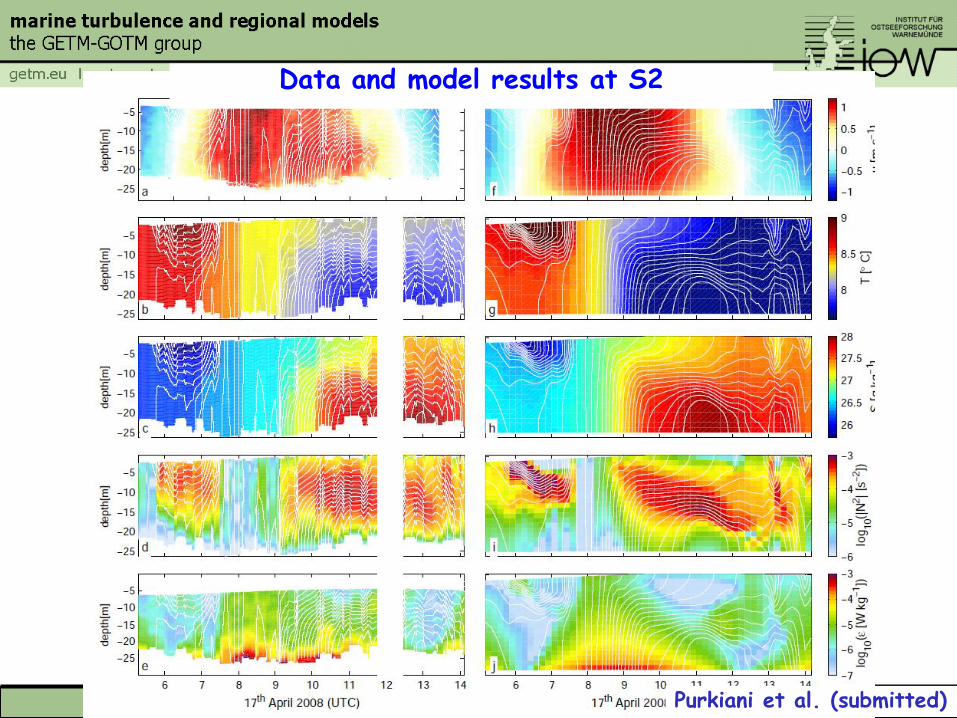
Data and model results at S2
Purkiani et al. (submitted)
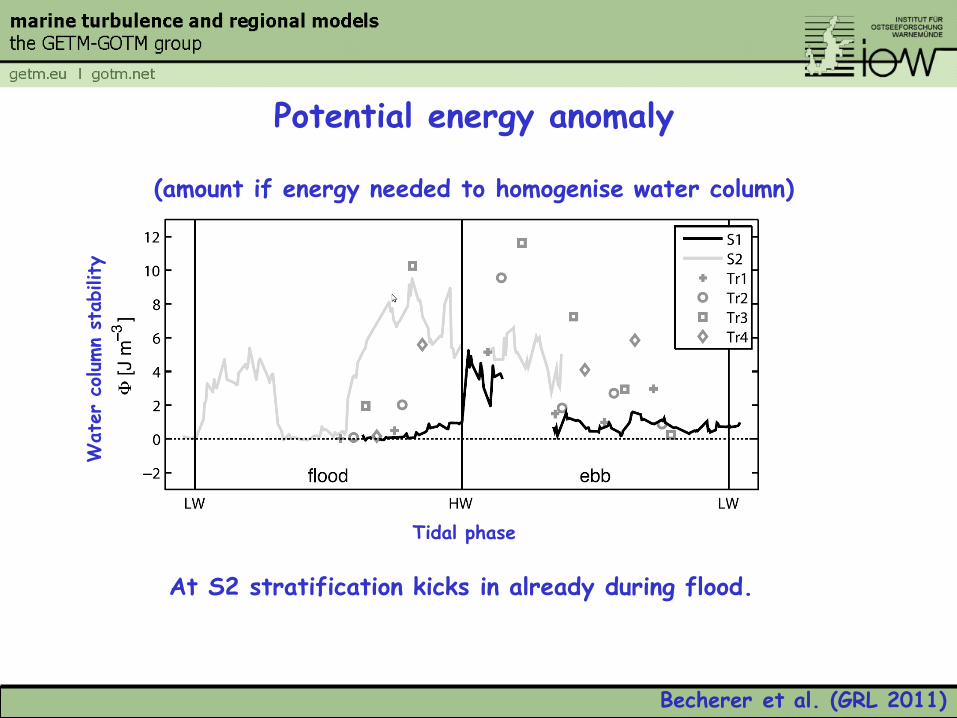
Potential energy anomaly
(amount if energy needed to homogenise water column)
Wate
r co
lumn
stability
Tidal phase
At S2 stratification kicks in already during flood.
Becherer et al. (GRL 2011)
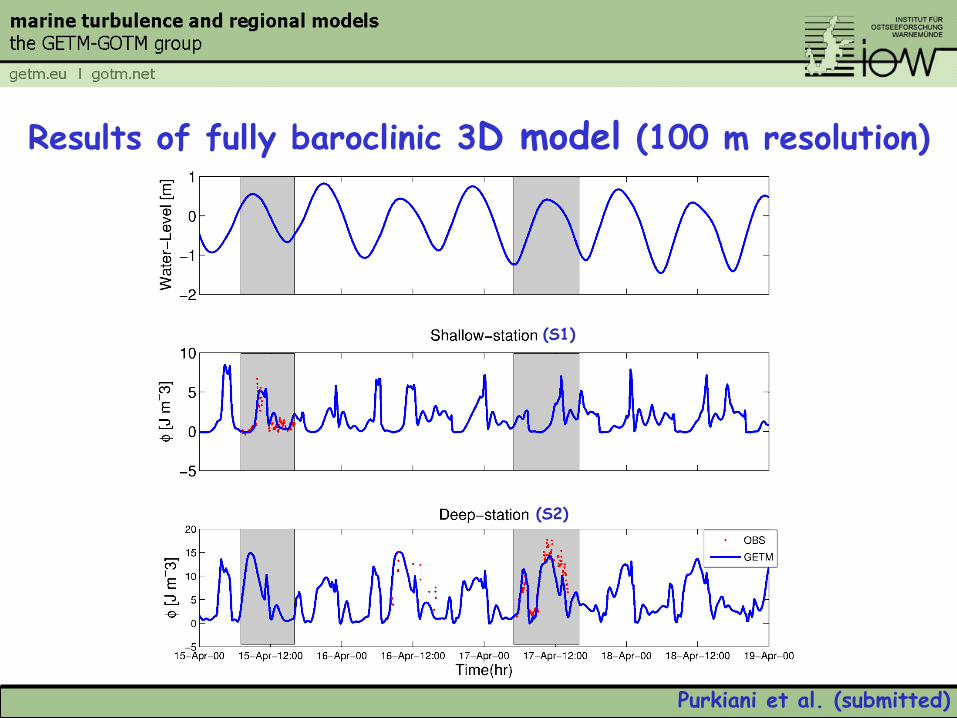
Results of fully baroclinic 3D model (100 m resolution)
Purkiani et al. (submitted)
(S1)
(S2)
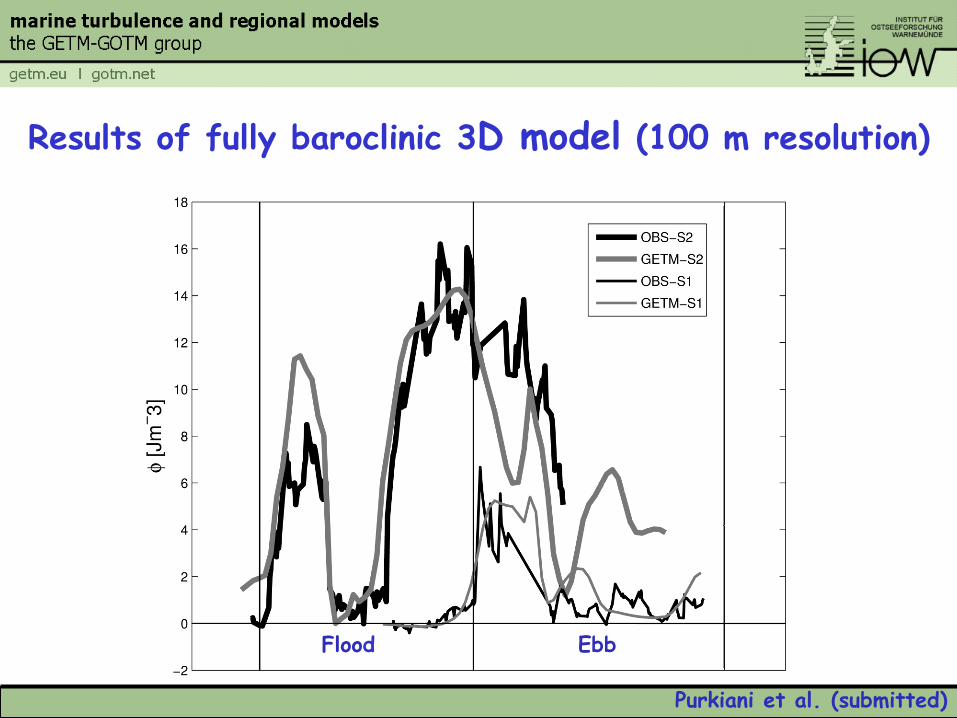
Results of fully baroclinic 3D model (100 m resolution)
Purkiani et al. (submitted)
Flood Ebb
Purkiani et al. (submitted)
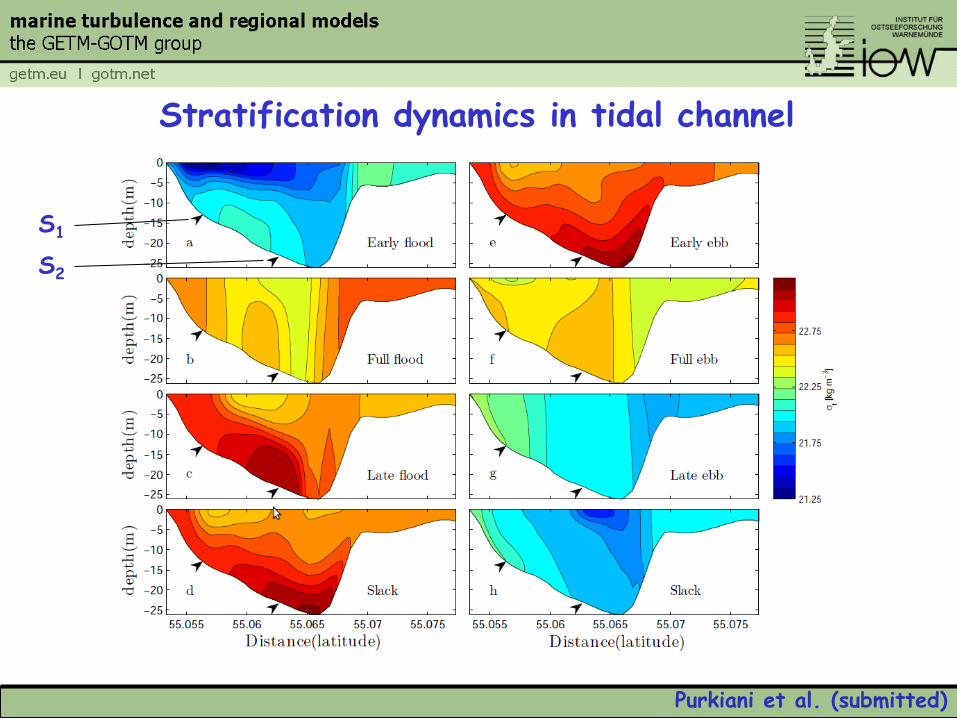
Stratification dynamics in tidal channel
S1
S2
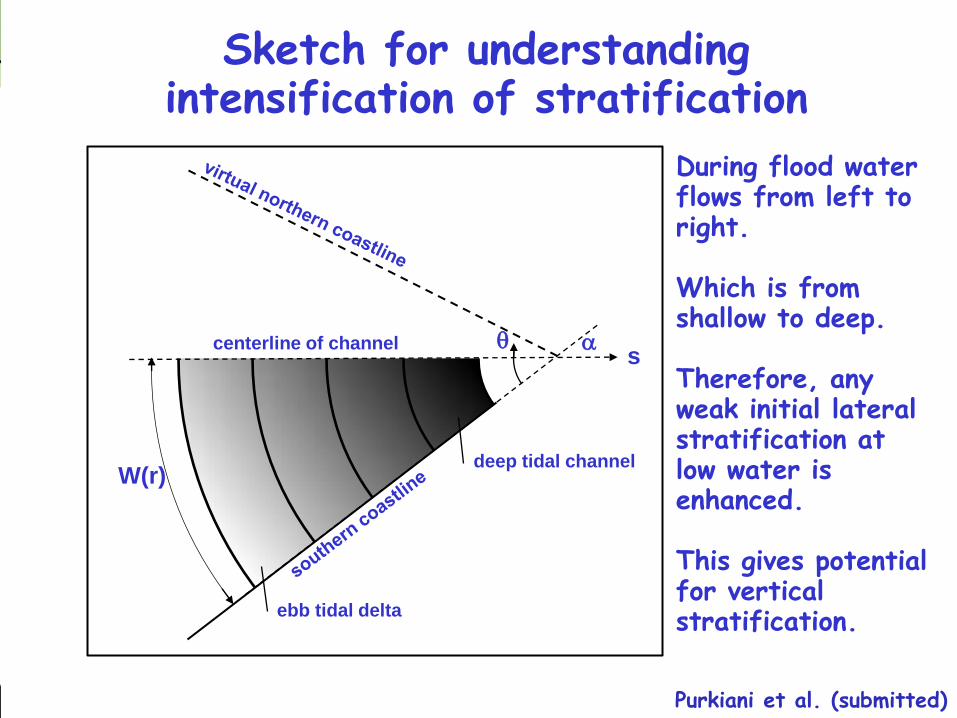
s q
W(r)
a centerline of channel
ebb tidal delta
deep tidal channel
Sketch for understanding intensification of stratification
Purkiani et al. (submitted)
During flood water flows from left to right. Which is from shallow to deep. Therefore, any weak initial lateral stratification at low water is enhanced. This gives potential for vertical stratification.
Wrap up
The coastal ocean dynamics is driven by • Surface buoyancy fluxes • Tides • Wind (just as the global ocean). Depending on the mix of these driving forces and their interaction with bathymetry all sorts of phenomena are observed. In many ways, the coastal ocean can be used as laboratory for the global ocean. Other than in the global ocean, these phenomena may be of immediate societal impact.
Literature: Burchard, H., P.D. Craig, J.R. Gemmrich, H. van Haren, P.-P. Mathieu, H.E.M. Meier, W.A.M. Nimmo Smith, H. Prandke, T.P. Rippeth, E.D. Skyllingstad, W.D. Smyth, D.J.S. Welsh, and H.W. Wijesekera, Observational and numerical modeling methods for quantifying coastal ocean turbulence and mixing, Progress in Oceanography 76, 399–442, 2008. Geyer, W. R., and P. MacCready, The estuarine circulation, Annu. Rev. Fluid Mech. 46, 175–97, 2014. MacCready, P., and W.R. Geyer, Advances in estuarine physics, Annual Review of Marine Science, 2, 35–58, 2010. Reissmann, J.H., H. Burchard, R. Feistel, E. Hagen, H.U. Lass, V. Mohrholz, G. Nausch, L. Umlauf, and G. Wieczorek, Vertical mixing in the Baltic Sea and consequences for eutrophication – A review, Progress in Oceanography, 82, 47–80, 2009. McLusky, D., and E. Wolanski (eds.), Treatise on Estuarine and Coastal Science, Elsevier, 12 volumes, 4590 pp., 2012.