Embed Size (px)
Citation preview

Kunden - Logo
Policy Deployment:“Hoshin Kanri” process
Gert Haar-Jorgensen
13 April 2012

© LeanCoaching090125_LC_PresentationTemplate_V6_DH
CONTENTS
Introduction
Hoshin Kanri
KPI and Targetsetting
Summary

© LeanCoaching090125_LC_PresentationTemplate_V6_DH
Gemba Kanri vs Hoshin Kanri
3
Problem: Gap between current target and current performance
Improvement: Lifting (and then achieving) target
Gemba Kanri Hoshin Kanri
**
First achieve Target (Standard) with Gemba Kanri and then improve Target with Hoshin Kanri
LEVE
L
Target (standard)
Problem
KAIZEN
New Target

© LeanCoaching090125_LC_PresentationTemplate_V6_DH
CONTENTS
Introduction
Hoshin Kanri
KPI and Targetsetting
Summary
© LeanCoaching090125_LC_PresentationTemplate_V6_DH
NN
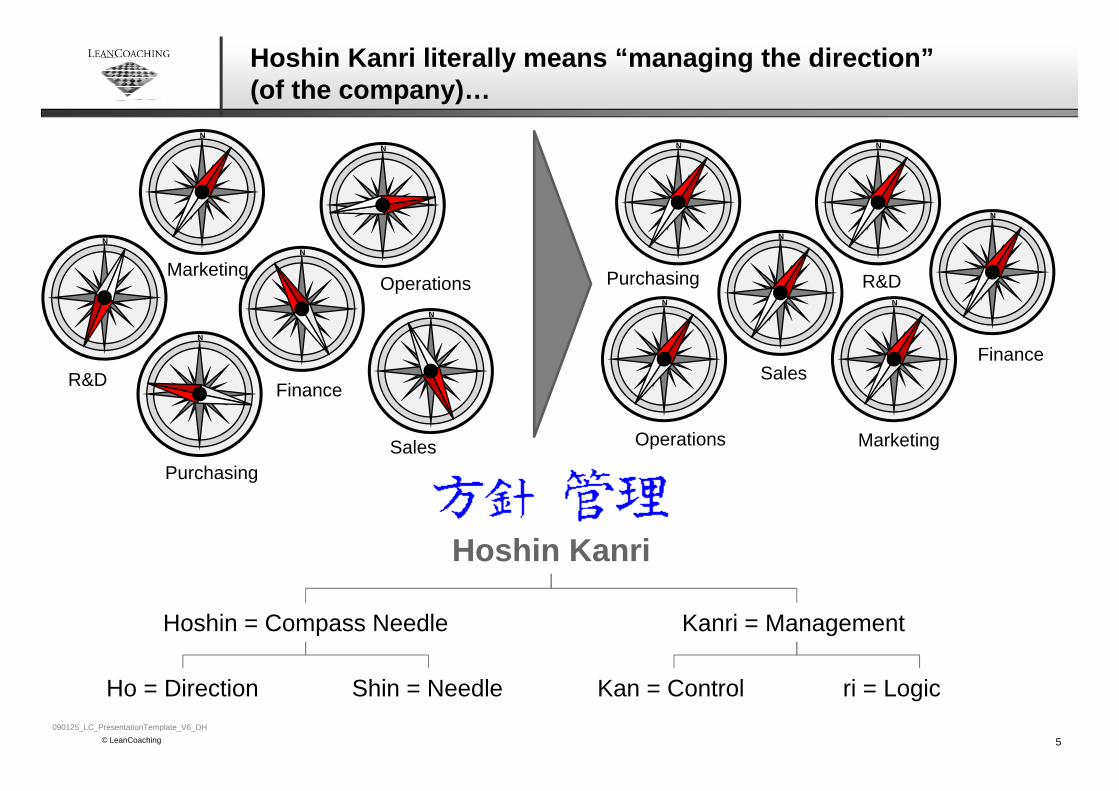
Hoshin Kanri literally means “managing the direction” (of the company)…
5
Hoshin = Compass Needle
Hoshin Kanri
Kanri = Management
Shin = Needle Kan = ControlHo = Direction ri = Logic
Purchasing
Operations
Sales
Marketing Purchasing
Operations
Sales
Marketing
N N
N N
NN
N
N
N
N
Finance
FinanceR&D
R&D

© LeanCoaching090125_LC_PresentationTemplate_V6_DH
Value-stream Analysis
Tactical Implementation Plans
Objectives & Key Performance Indicators
Business Problem Solving “A3“
Strategy
Blue Sky
Vision
Hoshin Kanri’s core process cascades vision to KPIs and then actions using rigorous PDCA feedback cycles
6
Plan
DoCheck
Adjust
BPS – Business Problem Solving
KPI – Key Performance Indicator
TIP – Tactical Implementation Plan

© LeanCoaching090125_LC_PresentationTemplate_V6_DH
Value-stream Analysis
Tactical Implementation Plans
Objectives & Key Performance Indicators
Business Problem Solving “A3“
Strategy
Blue Sky
Vision
Hoshin Kanri’s core process cascades vision to KPIs and then actions using rigorous PDCA feedback cycles
7
Plan
DoCheck
Adjust

© LeanCoaching090125_LC_PresentationTemplate_V6_DH
8
Toyota imbeds philosophy in daily activities
Toyota Motor Manufacturing North America Mission1
1. As an American company, contribute to the economic growth of the community and the United States.
2. As an independent company, contribute to the stability and well-being of team members.
3. As a Toyota group company, contribute to the overall growthof Toyota by adding value to our customers.
1 The Toyota Way, by Jeffery K. Liker, page 80.

© LeanCoaching090125_LC_PresentationTemplate_V6_DH
903.02.2009/OMCD TrainingCenter Mannheim
Blue Sky
Process: Blue Sky Workshop Result: Blue Sky

© LeanCoaching090125_LC_PresentationTemplate_V6_DH
Value-stream Analysis
Tactical Implementation Plans
Objectives & Key Performance Indicators
Business Problem Solving “A3“
Strategy
Blue Sky
Vision
Hoshin Kanri’s core process cascades vision to KPIs and then actions using rigorous PDCA feedback cycles
10
Plan
DoCheck
Adjust

© LeanCoaching090125_LC_PresentationTemplate_V6_DH
A common problem is translating the financial metrics of the ROCE tree into Process KPIs
11
VSM
TIP
KPIs
A3
Strategy
Blue Sky
VSM
TIP
KPIs
A3
Blue Sky
VSM
TIP
KPIs
A3
KPIs
Strategy
Blue Sky
VisionExecutive
Division
Factory
Production Area / Line

© LeanCoaching090125_LC_PresentationTemplate_V6_DH
Area/Line Targets
Mac
hini
ng
Std. Time Part A14 -7%
Std. Time Part A16 -9%
Line Availability +25%
Energy Costs -14%
Sub
Ass
embl
y
Std. Time Product X -7%
Std. Time Product Y -14%
OEE Assembly Eqpt -15%
Transport Costs -14%
Fina
l A
ssem
bly Std. Assembly Time -18%
Line Availability +14%
Labor Costs -12%
From each “Blue Sky”, KPIs define what needs to be measured, and specific targets can be cascaded to all levels
12
Business ObjectivesHuman Development
Quality Improvement
Lead Time Reduction
Cost Reduction
Factory TargetsP
rodu
ctio
nC
osts
Product A -10%
Product B -14%
Product C -15%
Mat
eria
lC
osts
Product A - 8%
Product B -11%
Product C -12%
Department* Targets
Pro
duct
A
Std. Time Product A
-8%
Downtime -25%
Overhead Costs
-12%
Pro
duct
B
Std. Time Product B
-10%
Downtime -15%
Overhead Costs
-12%P
rodu
ct C
Std. Time Product C
-9%
Downtime -17%
Overhead Costs
-11%
* Organised by Value stream

© LeanCoaching090125_LC_PresentationTemplate_V6_DH
Value-stream Analysis
Tactical Implementation Plans
Objectives & Key Performance Indicators
Business Problem Solving “A3“
Strategy
Blue Sky
Vision
Hoshin Kanri’s core process cascades vision to KPIs and then actions using rigorous PDCA feedback cycles
13
Plan
DoCheck
Adjust

© LeanCoaching090125_LC_PresentationTemplate_V6_DH
Business Problem Solving A3’s analyse objectives to develop a high level action plan for each unit or area
14
Factory Department A3 Title Sheet # Date Author Signatures
Wimbledon Assembly Example 1 28 Oct 2010 John Smith
Performance, Gaps & Targets
Key metric and current target:Dealer quote turnaround within 48 hoursShould consistently be at 95% or higherrReason:Competitor response: 100% within 48 hours, 95% within 24 hoursMunicipal fleets bids are time critical for dealer to respond to gov’t RFP
Business Objectives and Goals
What? How much and by when?
Dealer Quote turnaround time Consistent 95% within 48 hours by YE 2010 (this year)Consistent 95% within 24 hours by YE 2011 (next year)
Reflection
Past Activities Results and Lessons Learned
• Reduced SP21 compatibility discrepancies• Short Order Board• Surveyed Sterling dealers on time
expectations• Tried to increase applicability of standard
mode
• Saw improvement in # quotes requiring research; minimal impact on time
• Current process creates shortages and errors• 90% response; 24 hours turnaround expected
by majority of dealers• Fewer requests required evaluation time but
dealers didn’t like limits
Analysis & Rationale
Examples of tools used and information displayed here:Value Stream Map, Swimlane mapGraphs (eg from market studies)SWOT AnalysisRationale:(Conclusions – selected countermeasures to pursue; prioritised items for action focus)
Check
War room visual display of individual TIP plans and progress; key metrics and supporting metricsWeekly project reviews and monthly steering committee reviews initiated by BobInclude monthly turnaround time in monthly Scorecard reviewsBob send Market issues to Jane, Product Issues to ChristophEngage in best practice review with Sales and Trucks 2
Unresolved Issues
Unclear on who has authority to decide the allowed optionsResources needed for training teams on TOS tools may not be easy to scheduleIT solution on synchronization may depend on test systems vs. production systemsHow to identify and resolve contention for critical experts among competing initiatives
Business Problem Solving A3
Action Plan
Theme Activity Jan Feb Mar Apr May Jun Jul Aug Sep Oct Nov Dec
Policy Clarify delegated authority limits
Policy Publish decision tree for approvedproduct options
Metric Verify current turnaround data accuracy
Process Identify and address barriers to PreQuote
Process Complete appropriate segment process maps
Process Develop capacity plans and resource allocation
Process Improve ability to quickly detect request for quote
People Get appropriate resources to work
1
2
3
4
5
6
7
Fina
l As
sem
bly Std. Assembly Time -18%
Line Availability +14%
Labor Costs -12%

© LeanCoaching090125_LC_PresentationTemplate_V6_DH
Value-stream Analysis
Tactical Implementation Plans
Objectives & Key Performance Indicators
Business Problem Solving “A3“
Strategy
Blue Sky
Vision
Hoshin Kanri’s core process cascades vision to KPIs and then actions using rigorous PDCA feedback cycles
15
Plan
DoCheck
Adjust

© LeanCoaching090125_LC_PresentationTemplate_V6_DH
Analyse Current State
Identify Process Drivers
Quantify Potential
Define Lean
Levers
Design Future State
Value Stream Analysis forms the backbone for assessing the process capability and potential
16
Company
Factory
Line / Cell
• 5S• Standard Work• Line balance• Pull• OEE…
Loss Lever

© LeanCoaching090125_LC_PresentationTemplate_V6_DH
Value-stream Analysis
Tactical Implementation Plans
Objectives & Key Performance Indicators
Business Problem Solving “A3“
Strategy
Blue Sky
Vision
Hoshin Kanri’s core process cascades vision to KPIs and then actions using rigorous PDCA feedback cycles
17
Plan
DoCheck
Adjust

© LeanCoaching090125_LC_PresentationTemplate_V6_DH
Use of TIPs in the project
High level project TIP created early in project
High level TIP (Plant) broken down into specific Area TIP’s
Area TIP cascaded to and Supervisor TIP’s
AreaTIP’s and LPL TIP’s displayed in the information centre
TIPs designed to introduce tools in a structured way after a ‘need’ has been created
Tactical Implementation Plans (TIP)
Area C
Area B
Area A
PLANT
Early development,agreement and signing of TIP crucial to setting clear direction

© LeanCoaching090125_LC_PresentationTemplate_V6_DH
CONTENTS
Introduction
Hoshin Kanri
KPI and Targetsetting
Summary

© LeanCoaching090125_LC_PresentationTemplate_V6_DH
A common problem is translating the financial metrics of the ROCE tree into Process KPIs
20
VSM
TIP
KPIs
A3
Strategy
Blue Sky
VSM
TIP
KPIs
A3
Blue Sky
VSM
TIP
KPIs
A3
KPIs
Strategy
Blue Sky
VisionExecutive
Division
Factory
Production Area / Line
© LeanCoaching090125_LC_PresentationTemplate_V6_DH
21
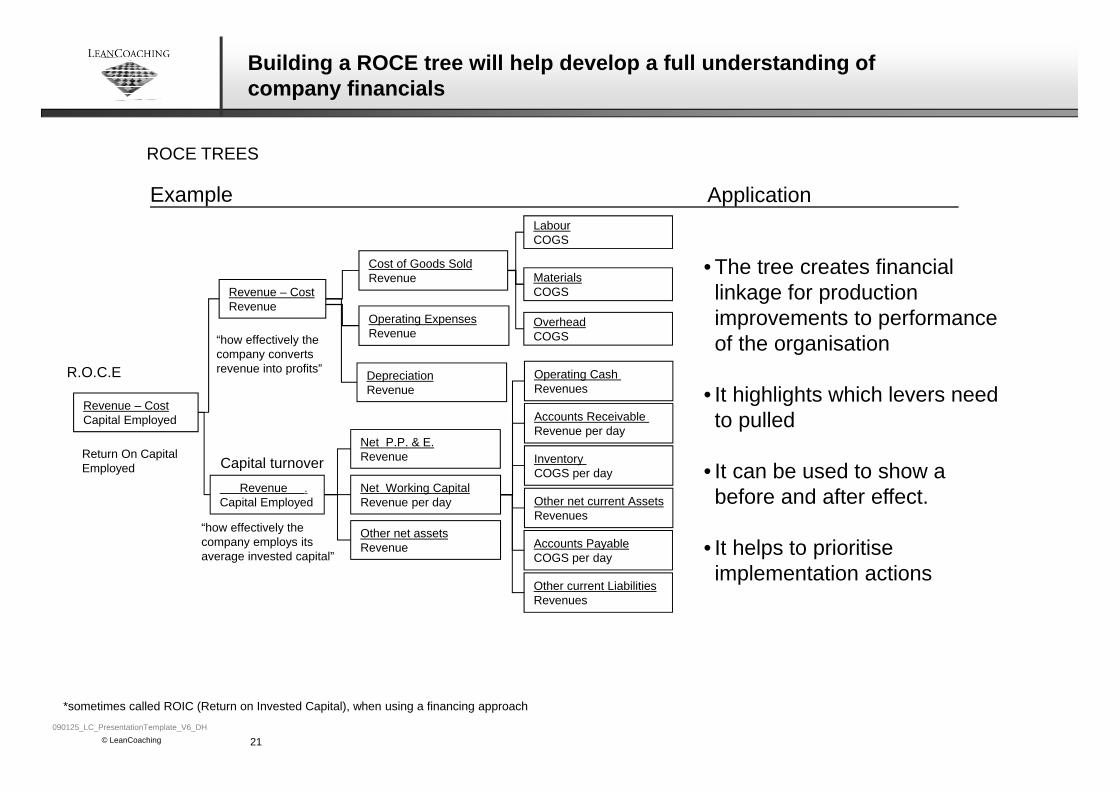
Building a ROCE tree will help develop a full understanding of company financials
ROCE TREES
*sometimes called ROIC (Return on Invested Capital), when using a financing approach
“how effectively the company employs its average invested capital”
Revenue – CostRevenue
Revenue .Capital Employed
Revenue – CostCapital Employed
“how effectively the company converts revenue into profits”R.O.C.E
Return On Capital Employed
Cost of Goods SoldRevenue
Operating ExpensesRevenue
Depreciation Revenue
Net P.P. & E. Revenue
Net Working Capital Revenue per day
Other net assets Revenue
LabourCOGS
MaterialsCOGS
OverheadCOGS
Operating Cash Revenues
Accounts Receivable Revenue per day
Inventory COGS per day
Other net current AssetsRevenues
Accounts PayableCOGS per day
Other current LiabilitiesRevenues
Capital turnover
Example Application
• The tree creates financial linkage for production improvements to performance of the organisation
• It highlights which levers need to pulled
• It can be used to show a before and after effect.
• It helps to prioritise implementation actions

© LeanCoaching090125_LC_PresentationTemplate_V6_DH
Actually, the problem is linking operational KPIs to improvement levers
22
RoCE
Gross Profit
Capital Employed
Workplace Organization
Flow and Leveling
“Pull” Production
Quick changeover
Team organization
Operational KPIFinancial KPI Lean Levers
OEE(%)
Manpower Productivity
(min/pc)
Defects(dpm)
Standardized Work
… & many more
Revenue
Costs
Property & Eqpt
Working Capital
Labor
Materials
Eqpt.
Inventory
Lead time(hrs)
Line / Cell Layout
Statistical Process Control
Root Cause Problem Solving

© LeanCoaching090125_LC_PresentationTemplate_V6_DH
KPI targets will be ineffective unless determined with an understanding of process limits and improvement potential
23
20% 20% 20% 20% 40% 15% 36% 33%
Arbitrary improvement targets Specific improvement targets

© LeanCoaching090125_LC_PresentationTemplate_V6_DH
S it 24
KPI’s have a Half-Life typically of 1 to 2 years, hence 50% of the gap between the current situation and limitcan be closed in, on average 1-2 years.
Current Potential Achievable Limiteg within 3-5 years
Current performance Only improvements with short payback (3-5 years*) are taken into accountNo technological or organizational breakthroughs
Typically:50% of the potential can be achieved in 1-2 years
Physical / Hard limit
- eg 100% Value Added- no Losses / 0 Defects
BASIC CONCEPT
Current - limit imposed by continuous improvement
Target Setting using Half-Life
50 40

© LeanCoaching090125_LC_PresentationTemplate_V6_DH
First, the potential of each lever is evaluated in one of three ways – loss, value added or benchmark
25
50
100
Current Potential Limit
Loss Analysis
Value AddedAnalysis
Benchmarking

© LeanCoaching090125_LC_PresentationTemplate_V6_DH
CONTENTS
Introduction
Hoshin Kanri
KPI and Targetsetting
Summary

© LeanCoaching090125_LC_PresentationTemplate_V6_DH
Classic planning weaknesses
Strategy = analysis
Process:- Event-driven- Single process- Analysis / decision making focus- Interim reviews often weak, missing or punitive
Breadth of application- Time-horizons often unsynchronized between levels- Limited cross-functional integration- Horizontal and vertical disconnects
Target setting- Too many objectives- Unrealistic targets- Hidden assumptions and safety buffers at each level
Hoshin Kanri countermeasures
Strategy = a process of hypothesis, analysis, feedback and adjustment
Process- Process-driven- Iterative cycles- Consensus focus- Interim reviews repeat the iterative cycle
Breadth of application- Clear time-horizons between levels- Cross-functional workshops- Extensive horizontal and vertical communications
and linked plans to align organization
Target setting- Objectives and priorities derived from strategy- Targets based on capability- Assumptions clarified
27*Catch ball = exchange of information about best means to accomplish goal until consensus is reached
Hoshin Kanri will allow you to set and manage the strategic direction with aligned KPIs and SMART targets

© LeanCoaching090125_LC_PresentationTemplate_V6_DH
Timely, rigorous feedback cycles are hypothesis driven, using cross-functional workshops to ensure consensus
28
Defined time
horizons
Hypothesis-driven iterations
Multi-levelCascades
Cross-functional workshops
VSM
TIP
KPIs
A3
Strategy
Blue Sky
VSM
TIP
KPIs
A3
Blue Sky
VSM
TIP
KPIs
A3
KPIs
Strategy
Blue Sky
Vision
HoshinKanri

© LeanCoaching090125_LC_PresentationTemplate_V6_DH
BACK UP