Embed Size (px)
Citation preview
Geographical Elements Affecting Quaintness in Tourist Town Developments-Topography and Transportation
Deborah A. Fitzwater-Dewey
Department of Geosciences University of Missouri Kansas City, Missouri 64110-2499
24
INTRODUCTION
An understanding of recreation geography is an important factor, now and in the future, as we strive to make the best decisions to serve the public. Although the roots of recreational geography extend into the 1920s in the United States, l there are few American articles devoted to the subject. Literature pertaining to the field is mainly from British, European, and Canadian sources. How transportation, topography, and planning affect tourist destination patterns is of utmost importance to recreation geographers. Prior studies 1-13 have not reached agreement on what methods may be used for determining the effects of transportation or topography on recreational areas or their influence on maintaining the character of the region.
Gearing, Swart, and Var's model2 used several factors in determining tourist attractiveness in Turkey, including climates, relief, and roads. Their test is to be used with caution, however, because for each region to which the test is applied, the independent variables will need to be redefined. Fesenmaier and Lieber3
also conducted a study to evaluate the reliability of outdoor research and concluded that human behavior is more consistent within a person's home region. Differences observed within the parameters of demand forecasting models reflected underlying regional variations. To these authors accessibility was a very important factor in determining the popularity of a region. Var, Beck, and Loftus4 predicted that sustained expansion of the travel industry over the next few years in British Columbia would occur, and that attractiveness could serve as a measure of popularity.
Recognition of exploitation and despoliation of vital natural or historic resources is one of the most serious problems affecting the outdoor recreation industry as found in a study by Wilbur Smith and Associates.s Their study found land use was greatly influenced by accessibility and that the design of a transportation system could have a major impact on a recreational area.
Miossec6 adopted a von Thunen-type
model for study of development of tourist facilities around towns and cities. In this study the author found that there was a decline in tourist trade away from population centers. Litton7 and Leopold8
developed methods for evaluating landscapes and the scenic nature of these landscapes.
Christalier9 reversed usage of his Central Place Theory and attempted to describe factors in recreational development in Europe. He inferred the growth of tourist areas results from people trying to avoid central places. He believed development of tourist areas thus occurs as far away from the population center as possible. According to Christaller, "The tourist searches for a position on the highest mountain, in the most lonely woods, along the remotest beaches
,,9
Daffell 'O stated that distance of car trips to countryside sites is a function of site attraction . One very important factor making recreation distinct is that a large portion of the actual out-of-pocket costs or recreation participation may be accounted for by travel costs. "
Smith' 2 states that a basic technique used to evaluate landscape aesthetics would be to employ a rating scale which evaluates scenic beauty. Taylor '3 used a random point system to provide a simple and accurate method to measure whether or not a particular resource area will satisfy its users. Garrison '4 drew three lines across each area and measured the airplane distance (X. ) along those lines. He then measured surface route distance (X. ). The airline distance became 100 percent of the total distance, and the surface distance was equal to or greater than airl ine distance. For each line, the surface distance was subtracted from the air distance (X. - X. ), and then the three differences were added and divided by three providing a numerical summary of relief.
Two towns are selected as case studies-Eureka Springs, Arkansas , and Branson, Missouri. Both are remote from large urban centers and offer attractions to tourists. The general study area is shown in Figure 1. The following provides a brief discussion of the geologic
and historical development of the two tourist towns.
HISTORY AND BACKGROUND
Found in the Interior Highlands Province, the two towns are located within a broad area known as the Ozark Dome. The boundary of the dome to the east is the Mississippi River and to the north, the Missouri River. To the west, the domal region blends into the plains of Oklahoma and Kansas and the southern border is formed b?, the Boston Mountains of Arkansas. ' The topography is underlain by limestones and dolomites. The soils are cherty and the presence of this chert in the limestone affects not only the character of the soil, but also the topographical forms. Solution valleys, sink holes, caverns, and springs dot the region. The tilt of the rock layers, porosity of the rocks, and the work of streams caused the differential resistance to weathering and erosion in this area. 's
Geological development in the area is arguable-the Old School (Davis) rests on the peneplanation theory and the New School (G ilbert) stresses process development. According to Fenneman,'5 the Davis School holds that the dome is due to incompleteness of base-leveling or rejuvenation. Ritter, '7 a member of the process-development school, contends that the topographic expression of this area results from the dynamic equilibrium associated with the processes of weathering, erosion, and mass wasting, and the geomorphologic agents-the transporting mechanisms of air, wind, and water.
Eureka Springs and Branson are located in the geographic region known as the Springfield Plain or Plateau. More specifically, Branson is located in the White River Hills, and Eureka Springs is on the Eureka Escarpment. Streams in the area form a radial drainage system. Entrenched stream valleys and forested slopes provide ideal topography for the development of dams and reservoirs.s
Several artificial lakes have been developed along the White River-Beaver, Table Rock, Taneycomo, Norfolk, and Bull Shoals.
Growth of Eureka Springs began in
25

'" 0)
Ci ty
o 80 160 ~ .
MILES
Figure 1. Location map of study area.
MILES
d id
the late 1800s because of the attraction of the area for health purposes. Dr. Alvah Jackson first laid claim to the springs and their curative powers in 1856. '8 During the next few years, word spread and by 1879, people migrated to the area in great numbers. Hillsides were clear cut to provide shelter and heat for thousands of people who came to Eureka Springs for its healing springs. The stagecoach line began in this year with 62 stagecoach arrivals and 25 departures a day but soon that figure rose to 100 arrivals and 30 departures a day.'8 Also that year, the city was platted and a post road constructed. By 1880, Eu reka Springs was incorporated with a population of approximately 3,000. In 1881, a turnpike was laid from Eureka Springs to Seligman, 18 miles away and the nearest railhead. By 1883, the track was extended to Eureka Springs and, beginning in February, six trains arrived daily bringing a new influx of people. The
population reached 10,000-15,000 people b~ the end of the nineteenth century.' During this time the streets remained unpaved and were essentially dirt trails winding around the mountainside. By the end of World War II, with the curative powers of the springs in doubt, Eureka Springs began to wane.
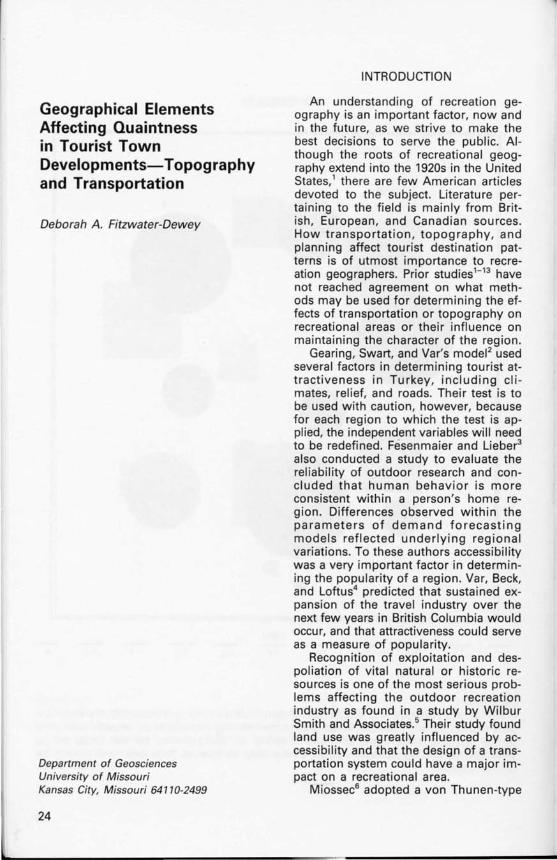
Today Eureka Springs is a town of approximately 2,000 people during the off season (Fig. 2). Two major transportation routes lead into the town-U.S 62 and Arkansas 23. Although a short rail line offers rides for tourists, there is no rail service between Eureka Springs and other towns. Of 238 named streets, there are no streets that cross at 90° angles indicating one of the reasons the natives have adopted the name, "Little Switzerland of the Ozarks," for their town. Twenty-five miles of streets and highways exist in a 415 acre area. '9 One-third of the streets are still dirt. The main attractions of Eureka Springs are the
Figure 2. View of downtown Eureka Springs, Arkansas, looking up Spring Street.
27
downtown historic district, the Passion Play, Beaver Lake, and a fine arts colony at Inspiration Point.
Branson developed originally in the 1880s as a mail stop. Although incorporated in 1912, it was not platted until the 1920s20 but extensive development did not begin until the late 1950s and early 1960s. Branson ' s Chamber of Commerce 20 indicated that this resort town had developed mainly because of three nearby lakes of the area-Table Rock, Bull Shoals, and Taneycomomajor recreational attractions in southwestern Missouri. At the time of main development, planning was under the Taney County authority and the U. S. Corps of Engineers. Modern construction tools and equipment which were lacking during Eureka Springs' development were available to Branson . Branson could build the access routes and manipulate the topography to suit its needs.
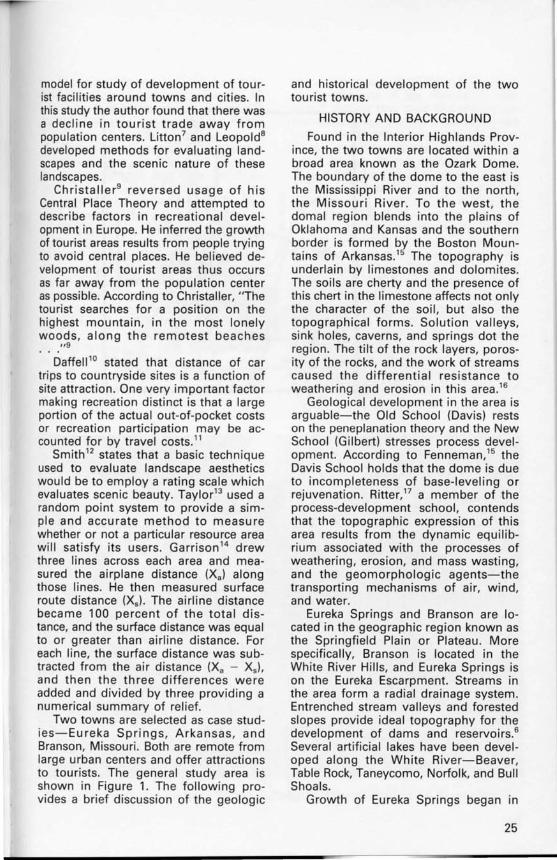
Branson today is a community of ap-
proximately 3,300 non-tourists during the off season (Fig . 3). It has four access routes-US 65, US 160, Missouri 76, and Missouri 248. No rail serves Branson although tracks run through nearby Holli ster. Its major attractions are Shepard of the Hills, Silver Dollar City, Whitewater, the School of the Ozarks, the lakes and caves of the region, and the numerous country music shows which crowd along Missouri 76 (Fig. 4). Tourists to the trilakes area in 1982 reached 3,600,000 with an income of $104,500,000. 21
METHODS AND DISCUSSION
Quaintness, as defined by Webster, describes an object or place that is unusual or old-fashioned in a pleasing way. For the purposes of this paper, the term will be used synonymously with distinct character or flavor of a region. Quaintness applies to many different items; for example, architectural style, historic buildings, accommodations, roads, etc.
Why are certain tourist towns able to
Figure 3. View of downtown Branson, Missouri.
28
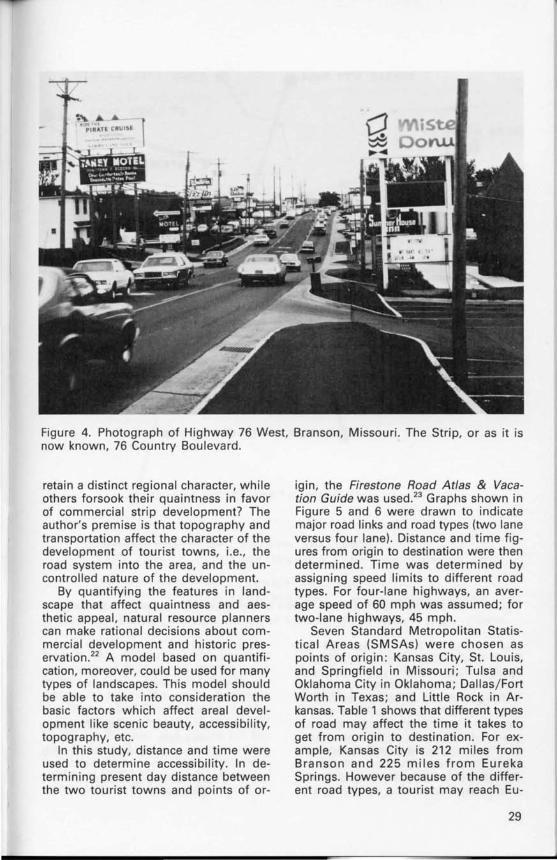
Figure 4. Photograph of Highway 76 West, Branson, Missouri. The Strip, or as it is now known, 76 Country Boulevard.
retain a distinct regional character, while others forsook their quaintness in favor of commercial strip development? The author's premise is that topography and transportation affect the character of the development of tourist towns, i.e., the road system into the area, and the uncontrolled nature of the development.
By quantifying the features in landscape that affect quaintness and aesthetic appeal, natural resource planners can make rational decisions about commercial development and historic preservation.22 A model based on quantification, moreover, could be used for many types of landscapes. This model should be able to take into consideration the basic factors which affect areal development like scenic beauty, accessibility, topography, etc.
In this study, distance and time were used to determine accessibility. In determining present day distance between the two tourist towns and points of or-
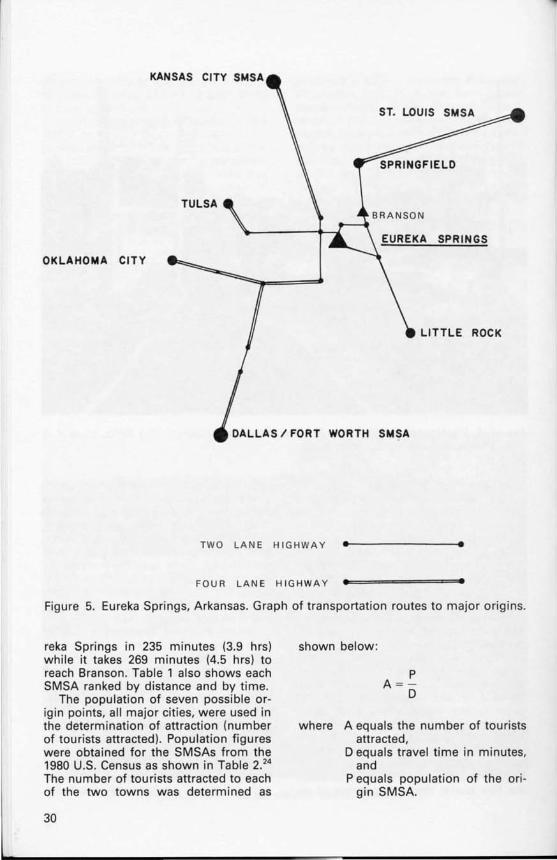
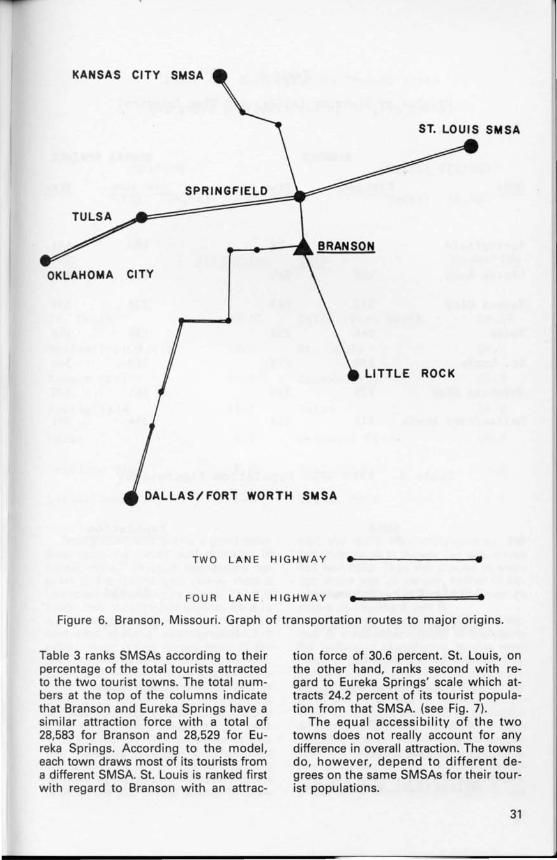
igin, the Firestone Road Atlas & Vacation Guide was used.23 Graphs shown in Figure 5 and 6 were drawn to indicate major road links and road types (two lane versus four lane). Distance and time figures from origin to destination were then determined. Time was determined by assigning speed limits to different road types. For four-lane highways, an average speed of 60 mph was assumed; for two-lane highways, 45 mph.
Seven Standard Metropolitan Statistical Areas (SMSAs) were chosen as points of origin : Kansas City, St. Louis, and Springfield in Missouri; Tulsa and Oklahoma City in Oklahoma; Dallas/Fort Worth in Texas; and Little Rock in Arkansas. Table 1 shows that different types of road may affect the time it takes to get from origin to destination. For example, Kansas City is 212 miles from Branson and 225 miles from Eureka Springs. However because of the different road types, a tourist may reach Eu-
29
KANSAS CITY SMSA
TULSA
SPRINGS
OKLAHOMA CITY
LITTLE ROCK
DALLAS/FORT WORTH SMSA
TWO LANE HIG HWA Y •• --------------••
FOUR LA NE HIG HW AY •• =======. Figure 5. Eureka Springs, Arkansas. Graph of transportation routes to major orig ins.
reka Springs in 235 minutes (3.9 hrs) while it takes 269 minutes (4.5 hrs) to reach Branson. Table 1 also shows each SMSA ranked by distance and by time.
The population of seven possible origin points, all major cities, were used in the determination of attraction (number of tourists attracted). Population figures were obtained for the SMSAs from the 1980 U.S. Census as shown in Table 2. 24
The number of tourists attracted to each of the two towns was determined as
30
shown below:
P A=
D
where A equals the number of tourists attracted,
D equals travel time in minutes, and
P equals population of the origin SMSA.
KANSAS CITY SMSA
SPRINGFIELD
OKLAHOMA CITY
LITTLE ROCK
DALLAS/FORT WORTH SMSA
TWO LANE HIGHWAY ..... ----------4.
FOUR LANE HIGHWAY •• __ =_=====-. Figure 6. Branson, Missouri. Graph of transportation routes to major origins.
Table 3 ranks SMSAs according to their percentage of the total tourists attracted to the two tourist towns. The total numbers at the top of the columns indicate that Branson and Eureka Springs have a similar attraction force with a total of 28,583 for Branson and 28,529 for Eureka Springs. According to the model, each town draws most of its tourists from a different SMSA. St. Louis is ranked first with regard to Branson with an attrac-
tion force of 30.6 percent. St. Louis, on the other hand, ranks second with regard to Eureka Springs' scale which attracts 24.2 percent of its tourist population from that SMSA. (see Fig. 7).
The equal accessibility of the two towns does not really account for any difference in overall attraction. The towns do, however, depend to different degrees on the same SMSAs for their tourist populations.
31
Table 1
Origins by Distance (miles) and Time (minutes)
BRANSON EUREKA SPRINGS
SMSA Distance Time Distance Time
Springfield 43 57 100 133
Little Rock 166 221 181 241
Kansas City 212 269 225 235
Tulsa 244 258 159 198
St. Louis 258 272 315 348
Oklahoma City 339 385 261 300
Dallas/Fort Worth 445 513 354 391
Table 2. 1980 SMSA Population Figures(26)
SMSA Population
Little Rock, Arkansas 74,484
Springfield, Missouri 207,704
Tulsa, Oklahoma 657,173
Oklahoma City, Oklahoma 860,969
Kansas City SMSA 1,443,458
St. Louis SMSA 2,376,998
Dallas/Fort Worth SMSA 2,930,516
32
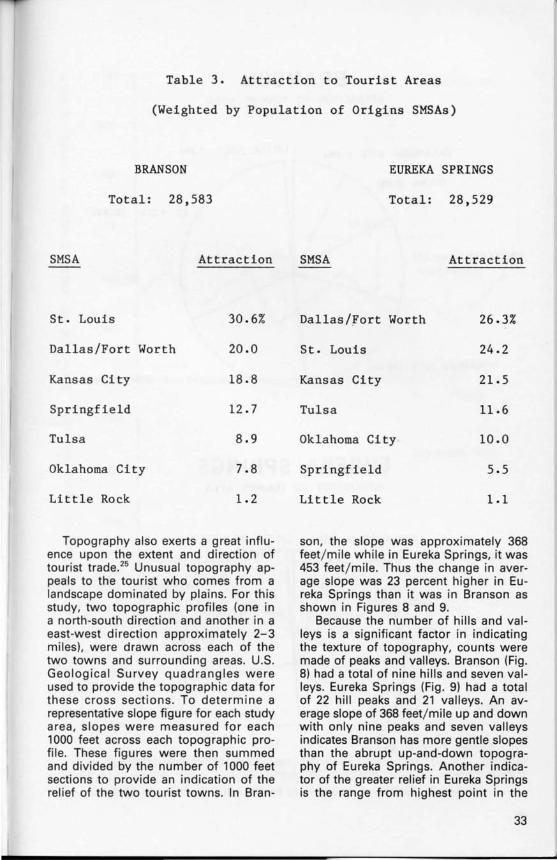
Table 3. Attraction to Tourist Areas
(Weighted by Population of Origins SMSAs)
BRANSON
Total: 28,583
SMSA Attraction
St. Louis 30.6%
Dallas/Fort Worth 20.0
Kansas City 18.8
Springfield 12.7
Tulsa 8.9
Oklahoma City 7.8
Little Rock 1.2
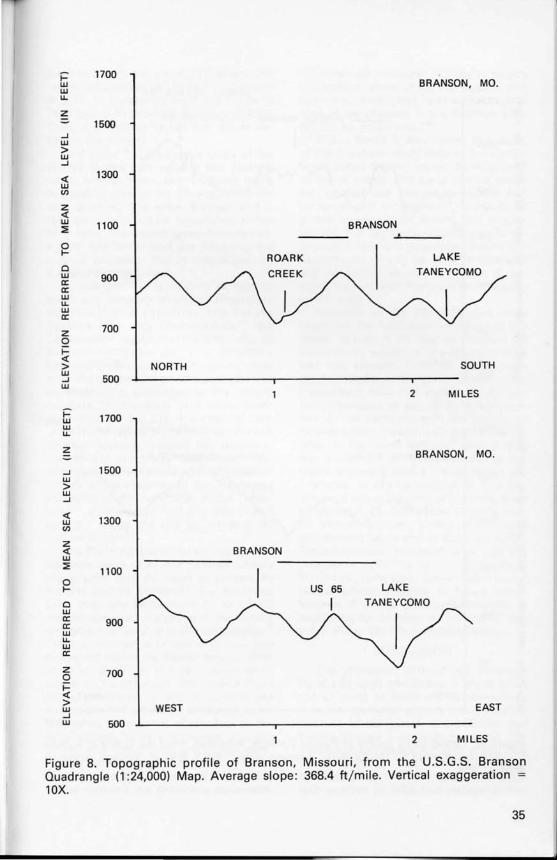
Topography also exerts a great influence upon the extent and direction of tourist trade.25 Unusual topography appeals to the tourist who comes from a landscape dominated by plains. For this study, two topographic profiles (one in a north-south direction and another in a east-west direction approximately 2-3 miles), were drawn across each of the two towns and surrounding areas. U.S. Geological Survey quadrangles were used to provide the topographic data for these cross sections. To determine a representative slope figure for each study area, slopes were measured for each 1000 feet across each topographic profile. These figures were then summed and divided by the number of 1000 feet sections to provide an indication of the relief of the two tourist towns. In Bran-
EUREKA SPRINGS
Total: 28,529
SMSA Attraction
Dallas/Fort Worth 26.3%
St. Louis 24.2
Kansas City 21.5
Tulsa 11.6
Oklahoma City 10.0
Springfield 5.5
Little Rock 1.1
son, the slope was approximately 368 feet/ mile while in Eureka Springs, it was 453 feet/mile. Thus the change in average slope was 23 percent higher in Eureka Springs than it was in Branson as shown in Figures 8 and 9.
Because the number of hills and valleys is a significant factor in indicating the texture of topography, counts were made of peaks and valleys. Branson (Fig. 8) had a total of nine hills and seven valleys. Eureka Springs (Fig. 9) had a total of 22 hill peaks and 21 valleys. An average slope of 368 feet/mile up and down with only nine peaks and seven valleys indicates Branson has more gentle slopes than the abrupt up-and-down topography of Eureka Springs. Another indicator of the greater relief in Eureka Springs is the range from highest point in the
33

BRANSON ATTRACTION TO TOURIST AREA
OKLAHOMA CITY (7.8%) ~--.-..,..lI_TT_LE ROCK (1.2%)
SPRINGFIELD (12.7%)
KANSAS CITY (18.8%)
DALLAS/ FORT WORTH (20.0%)
EUREKA SPRINGS ATTRACTION TO TOUR IST AREA
SPRINGFIELD (5.5%) LITTLE ROCK (1 .1%)
OKLAHOMA CITY (10.0%)
DALLAS/ FORT WORTH (26.2%)
TULSA (11 .6%)
KANSAS CITY (21 .5%) ST. LOUIS (24.2%)
Figure 7. Graphs of attraction to tourist areas from major SMSAs.
34
~ w w u.
z
.J W > W .J
« w (J)
z « w ~
~ Cl w a: a: w u. w a:
z o f= « > w .J W
~ w w u.
z
.J W > W .J
« w (J)
z « w ~
~ Cl w a: a: w u. w a:
z o f= « > w .J W
1700
1500
1300
1100
900
700
500
1700
1500
1300
1100
900
700
500
ROARK
NORTH
BRANSON
US
WEST
BRANSON
BRANSON, MO.
LAKE
TANEYCOMO
SOUTH
2 MILES
BRANSON, MO.
LAKE
TANEYCOMO
EAST
2 MILES
Figure 8. Topographic profile of Branson, Missouri, from the U.S.G.S. Branson Quadrangle (1 :24,000) Map. Average slope : 368.4 ft/mile. Vertical exaggeration = 1 Ox.
35

f=' w w u.
z
...J W > W ...J
oct w Vl
Z oct w :;:
~ o w a: a: w u. w a:
z a i= oct > W ...J W
f=' w w u.
z
...J W > W ...J
1700
1500
1300
1100
900
700
500
1700
1500
oct 1300 w Vl
z oct w :;: 1100
a I-
o w a: 900 a: w u. w a:
z a ~ > W ...J W
700
500
EUREKA SPRINGS, AR
___ EUREKA SPRINGS
I
NORTH SOUTH
2 MILES
EUREKA SPRINGS , AR
__ EUREKA SPRINGS
WEST
MOUNT OBERAMMERGAU I
2
EAST
3 MILES
Figure 9. Topographic profile of Eureka Springs, Arkansas, from the U.S,G.S, Eureka Springs Quadrangle (1 :24000) map. Average slope: 425.6 ft/mile. Vertical exaggeration = 10X.
36
town to the lowest point. In Branson the range is 1000 feet to 720 feet (difference of 280). In Eureka Springs, the range is 1520 feet to 1120 feet (difference of 400). Thus, a difference of 120 feet exists between the ranges.
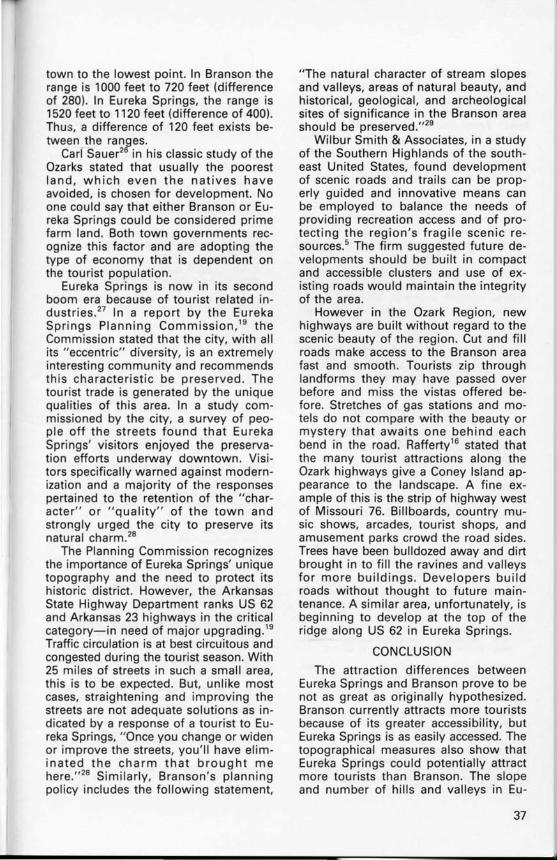
Carl Sauer26 in his classic study of the Ozarks stated that usually the poorest land, which even the natives have avoided, is chosen for development. No one could say that either Branson or Eureka Springs could be considered prime farm land. Both town governments recognize this factor and are adopting the type of economy that is dependent on the tourist population .
Eureka Springs is now in its second boom era because of tourist related industries. 27 In a report by the Eureka Springs Planning Commission, '9 the Commission stated that the city, with all its " eccentric" diversity, is an extremely interesting community and recommends this characteristic be preserved. The tourist trade is generated by the unique qualities of this area. In a study commissioned by the city, a survey of people off the streets found that Eureka Springs' visitors enjoyed the preservation efforts underway downtown. Visitors specifically warned against modernization and a majority of the responses pertained to the retention of the "character" or "quality" of the town and strongly urged the city to preserve its natural charm.28
The Planning Commission recognizes the importance of Eureka Springs' unique topography and the need to protect its historic district. However, the Arkansas State Highway Department ranks US 62 and Arkansas 23 highways in the critical category-in need of major upgrading. ' 9 Traffic circulation is at best circuitous and congested during the tourist season. With 25 miles of streets in such a small area, this is to be expected. But, unlike most cases, straightening and improving the streets are not adequate solutions as indicated by a response of a tourist to Eureka Springs, " Once you change or widen or improve the streets, you ' ll have eliminated the charm that brought me here.'t28 Similarly, Branson's planning pol icy includes the following statement,
"The natural character of stream slopes and valleys, areas of natural beauty, and historical, geological, and archeological sites of significance in the Branson area should be preserved.',29
Wilbur Smith & Associates, in a study of the Southern Highlands of the southeast United States, found development of scenic roads and trails can be properly guided and innovative means can be employed to balance the needs of providing recreation access and of protecting the region's fragile scenic resources.s The firm suggested future developments should be built in compact and accessible clusters and use of existing roads would maintain the integrity of the area.
However in the Ozark Region, new highways are built without regard to the scenic beauty of the region. Cut and fill roads make access to the Branson area fast and smooth. Tourists zip through landforms they may have passed over before and miss the vistas offered before. Stretches of gas stations and motels do not compare with the beauty or mystery that awaits one behind each bend in the road. Rafferty'6 stated that the many tourist attractions along the Ozark highways give a Coney Island appearance to the landscape. A fine example of this is the strip of highway west of Missouri 76. Billboards, country music shows, arcades, tourist shops, and amusement parks crowd the road sides. Trees have been bulldozed away and dirt brought in to fill the ravines and valleys for more buildings. Developers build roads without thought to future maintenance. A similar area, unfortunately, is beginning to develop at the top of the ridge along US 62 in Eureka Springs.
CONCLUSION
The attraction differences between Eureka Springs and Branson prove to be not as great as originally hypothesized. Branson currently attracts more tourists because of its greater accessibility, but Eureka Springs is as easily accessed. The topographical measures also show that Eureka Springs could potentially attract more tourists than Branson. The slope and number of hills and valleys in Eu-
37

reka Springs add to the excitement and mystery of the area aptly termed " Little Switzerland of the Ozarks." However, the diffe rences between the two towns and t he ir developments need to be expla ined by other variables as well. The development in downtown Eureka Spri ngs, unlike Branson, has been controlled to the benefit of the community. Preservation of the unique character of the region has added to its attraction . Branson's downtown development, admitted ly newer, shows signs of the circus-li ke atmosphere that exists along the Highway 76 to the west.
Accessibility and topography do play a role in the development of tour ist towns. Fu rther resea rch should be implemented so that the other variables affect ing tourist development in t hese towns can be identified. Then, perhaps planners and recreation geographe rs could take note of these find ings and use them to ma intain the integrity of scen ic regions.
ACKNOWLEDGMENTS
The author wou ld li ke to thank Assoc. Professor Steven Driever, Professor E. D. Goebel, and Professor Raymond Coveney Jr. fo r their opinions and encouragement. I would also like to thank Mr. Dan Chappell for his help. Special thanks goes for support from Mr. John Dewey.
REFERENCES
1. Mitchell . Lisle S., and Smith. R. V., 1985, " Aecreational geography: inventory and prospect," The Professional Geographer, v. 37, pp. 6-13.
2. Gearing, Charles E., Swart, William W., and Vart, Turgut. 1974, " Establish ing a mea sure of touristic attractiveness," Journal of Travel Research, v. 12, pp. 1-8.
3. Fesenmaier. Dan iel A. , and Lieber, Stanley A. , 1985, " Evaluating the stability of outdoor recreation participation models," The Professional Geographer, v. 37, pp. 15-21 .
4. Var, Turgut, Beck. R. A. D., and Loftus, Patrick, 1977, Determination of touristic attractiveness of the touristic areas in British Columbia, v. 15, pp. 23-29.
5. Wilbur Smith and Associates, Inc., 1974. Soulhern highlands mountain resources management plan, Executive Summary. for Georg ia Dept. of Natural Aesources, North Carolina Dept. of Administration, and South Carolina Dept. of Parks, Recreation, and Tourism.
38
6. Miossec. Jean-Marie, 1977. " Un modele de I'espace touristique." L'Espace Geographique, v. I , pp. 41-48.
7. Litton, A. B., 1973, Landscape control pain Is: A procedure for predicl ing and moniloring impacls, USDA Forest Service Aesearch paper, PSW-19, Pacific SW Forest & Aange Experiment Station, Berkeley, California.
8. Leopold, l. 8., 1969, " Landscape esthetics," Natural HislOry, v. 78, pp. 36-45.
9. Cristaller, W., 1964, " Some considerations of tourism location in Europe: The peripheral regions-underdevel oped countries-recreation areas," Papers of the Regional Science Associalion 12, pp. 95- 105.
10. Daffel, J. Roger, 1984, " The attraction of countryside sites," Transportalion Planning & Technology, v. 9, pp. 153- 179.
11 . Cicchetti, Charles J., Forecasling Recreal ion in the Uniled Slales, (Lexington MA: Lexington Books). 1973.
12. Smith, Stephen l. J., Recrealional Geography, (Essex, England: Longman Group Ltd), 1983.
13. Taylor, Gordon 0 .. 1965. " An approach to the inventory of recreational lands," The Canadian Geographer, v. 9, pp. 84-91.
14. Garrison, W. l., and Marble, D. F., 1974. " Graph theoretic concepts," in Michael E. Eliot Hurst (ed). Transporlalion Geography: Comments and Readings. pp. 58- 80.
15. Fenneman, N. V .• 1938, The Ozark Plateau. in Physiography of Easlern Uniled Slales, 1st ed., (New York: McGraw-Hili Books), pp. 631 - 662.
16. Rafferty, Milton D., 1980, The Ozarks : Land and Life, (Norman: Univ. of Oklahoma Press), p, 282.
17. Ritter, Dale F., 1978, Process Geomorphology. (Dubuque. IA: W. C. Brown).
18. Westphal, Jane, and Osterhage, Catharine, 1970, A Fame nOI Easily Forgotten, (Conway, Ark : River Road Press). p. 224.
19. Eureka Springs Planning Commission, Comprehensive Plan, November 1969.
20. Welcome to Branson : The City w ith Ozark Pride, 1984. Chamber of Commerce pamphlet.
21 . Blase, Jan M., City Planner, City of Branson, personal communication, March 20, 1985.
22. Shafer, Jr., E. G., Hamilton Jr., John F., and Schmidt, Elizabeth A., 1969, " Natural landscape preferences: A predictive model," Journal of Leisure Research, v. I , pp. 1- 19.
23. Fireslone Road Alias & Vacalion Guide. (Chicago: Rand McNally), 1983.
24. U.S. Bureau of the Census, 1983, 1980 County and Cily Dala Book. U.S. Department of Commerce (Washington DC: U.S. Government Printing Office).
25. Selke, Arthur C., 1936, " Geographic aspects of the German tourist trade," Economic Geographer. v. 12, pp. 205-216.
26. Sauer, CarlO., 1920, "The geography of the Ozark Highlands of Missouri," Geog. Soc. of Chicago Bull. 7, pp. 186-187.
27. Leisure and Recreation Concepts. Inc .• Profile of a proposed family theme park at Eureka Springs. Arkansas. September. 1977.
28. Comprehensive Planning Institute. 1981 . A tourist profile
analysis for Eureka Springs. Ark .• Appendix F. Dallas. Texas.
29. Land Use Policy Plan. City of Branson. Missouri. January. 1985.
39