Embed Size (px)
DESCRIPTION
What policies to support regional networking capabilities ? Evidence from a regional innovation policy framework 2002-2008. Annalisa Caloffi , Federica Ross i , Margherita Russo Università di Padova, Birkbeck College, Università di Modena e Reggio Emilia - PowerPoint PPT Presentation
Citation preview
What policies to support
regional networking capabilities?
Evidence from a regional innovation policy framework
2002-2008
Annalisa Caloffi, Federica Rossi, Margherita RussoUniversità di Padova, Birkbeck College, Università di Modena e Reggio Emilia
Complexity in the Real World: From policy intelligence to intelligent policyECCS’12, Bruxelles, 5-6 September 2012
Introduction
General features of a regional policy_SPD 2000-2006 (2002-2008)
Heterogeneity of project networks
Stability of participants and relationships over time
Effects of participation to policies on organizations’ ability to:
– form heterogeneous networks
– engage in stable relationships
– activate relationships in general
Some preliminary conclusions & further developments
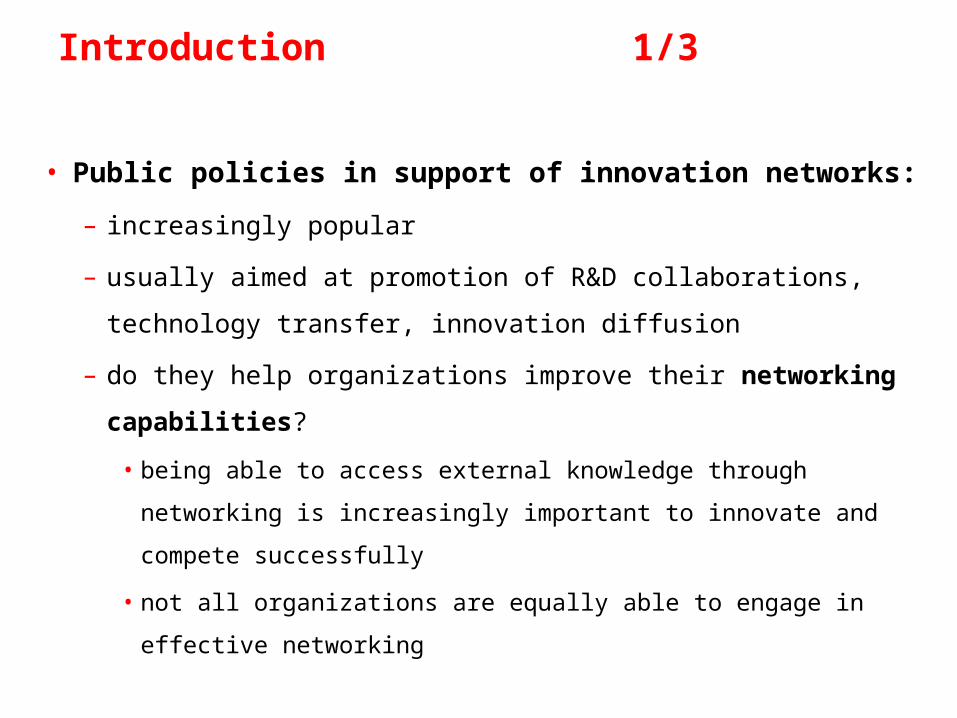
• Public policies in support of innovation networks:
– increasingly popular
– usually aimed at promotion of R&D collaborations, technology
transfer, innovation diffusion
– do they help organizations improve their networking
capabilities?
• being able to access external knowledge through networking is
increasingly important to innovate and compete successfully
• not all organizations are equally able to engage in effective
networking
Introduction 1/3
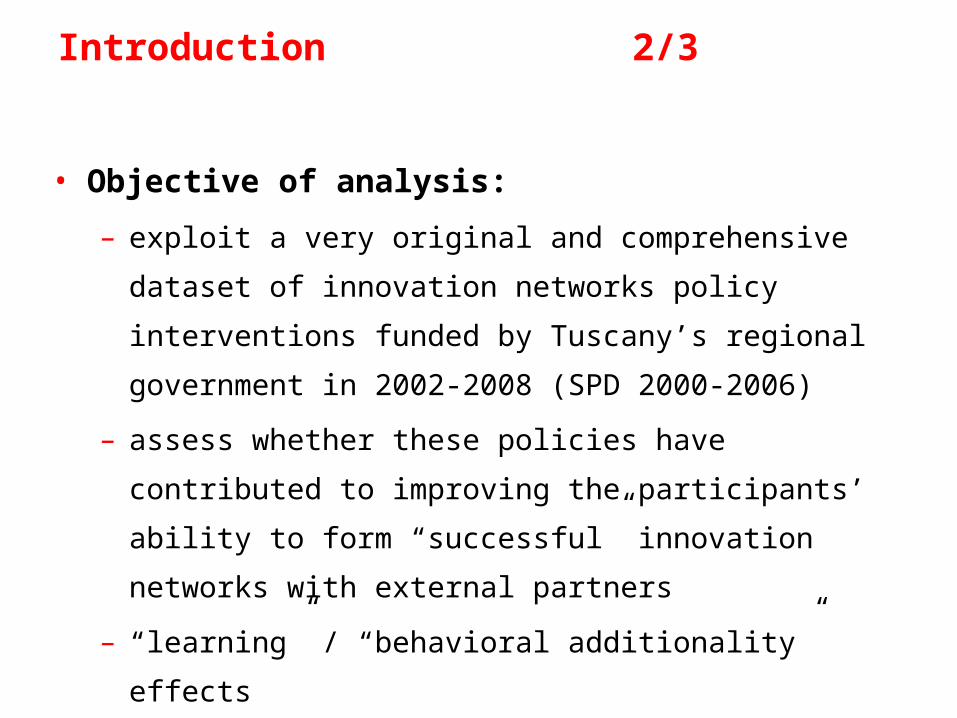
• Objective of analysis:
– exploit a very original and comprehensive dataset of innovation
networks policy interventions funded by Tuscany’s regional
government in 2002-2008 (SPD 2000-2006)
– assess whether these policies have contributed to improving the
participants’ ability to form “successful” innovation networks
with external partners
– “learning” / “behavioral additionality” effects
Introduction 2/3
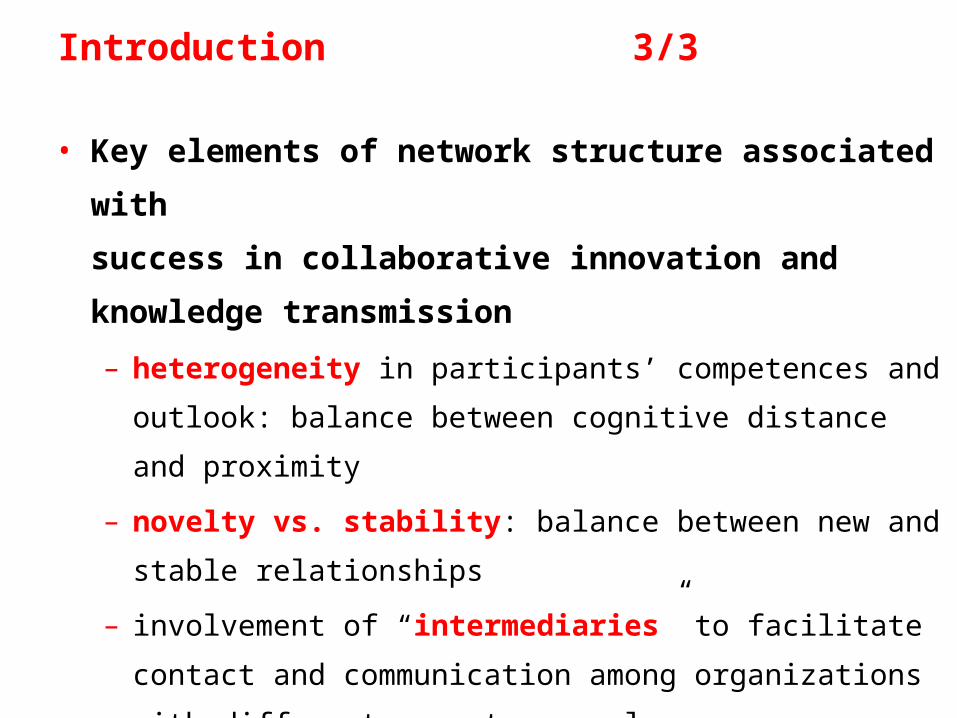
• Key elements of network structure associated with
success in collaborative innovation and knowledge transmission
– heterogeneity in participants’ competences and outlook: balance
between cognitive distance and proximity
– novelty vs. stability: balance between new and stable relationships
– involvement of “intermediaries” to facilitate contact and
communication among organizations with different competences,
languages, cognitive frameworks
• The policy programmes we analyze included some requirements
(“constraints”) aimed at promoting heterogeneity, repeated
collaborations and the involvement of intermediaries
Introduction 3/3
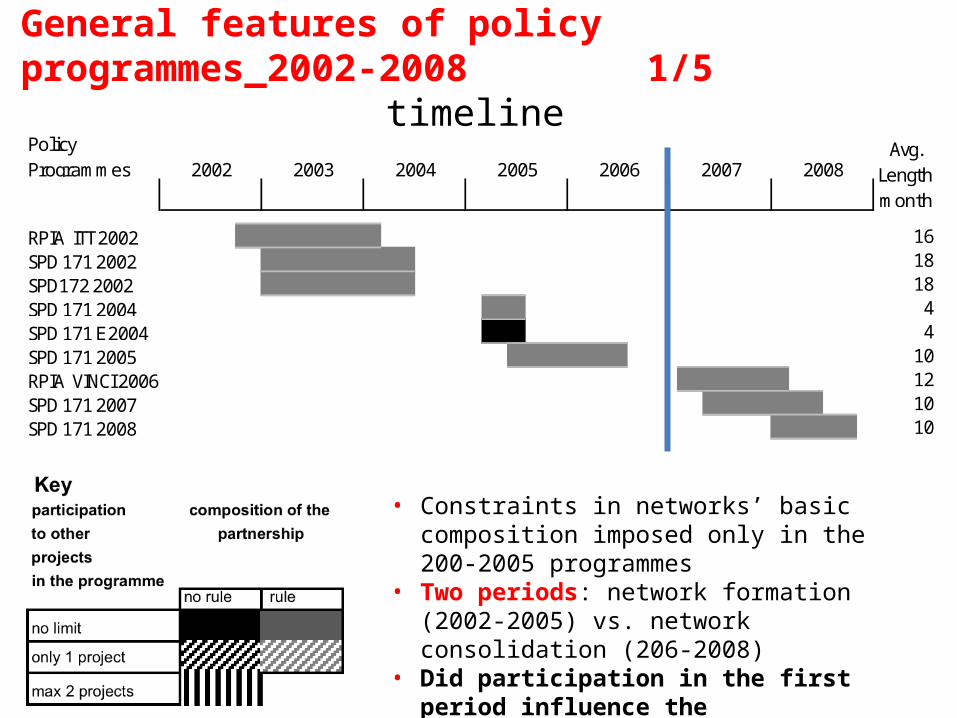
Policy Programmes
RPIA_ITT 2002 16SPD 171 2002 18SPD172 2002 18SPD 171 2004 4SPD 171 E 2004 4SPD 171 2005 10RPIA_VINCI 2006 12SPD 171 2007 10SPD 171 2008 10
2002 2003 2004 2005 2006 2007 2008Avg.
Lengthmonth
General features of policy programmes_2002-2008 1/5timeline
• Constraints in networks’ basic composition imposed only in the 200-2005 programmes
• Two periods: network formation (2002-2005) vs. network consolidation (206-2008)
• Did participation in the first period influence the organizations’ ability to network “successfully” in the second period?
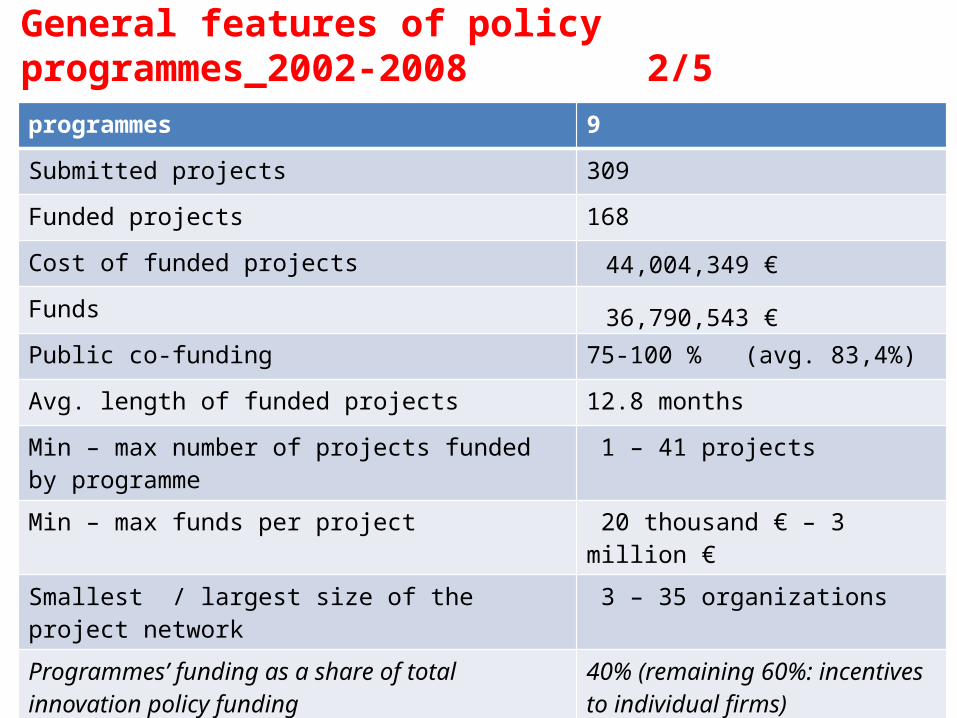
programmes 9
Submitted projects 309
Funded projects 168
Cost of funded projects 44,004,349 €
Funds 36,790,543 €
Public co-funding 75-100 % (avg. 83,4%)
Avg. length of funded projects 12.8 months
Min – max number of projects funded by programme 1 – 41 projects
Min – max funds per project 20 thousand € – 3 million €
Smallest / largest size of the project network 3 – 35 organizations
Programmes’ funding as a share of total innovation policy funding
40% (remaining 60%: incentives to individual firms)
Share of regional firms involved in these programmes 1%
General features of policy programmes_2002-2008 2/5
RPIA_ITT 2002
SPD 171 2002
SPD172 2002
SPD 171 2004
SPD 171 E 2004
SPD 171 2005
RPIA_VINCI 2006
SPD 171 2007
SPD 171 2008
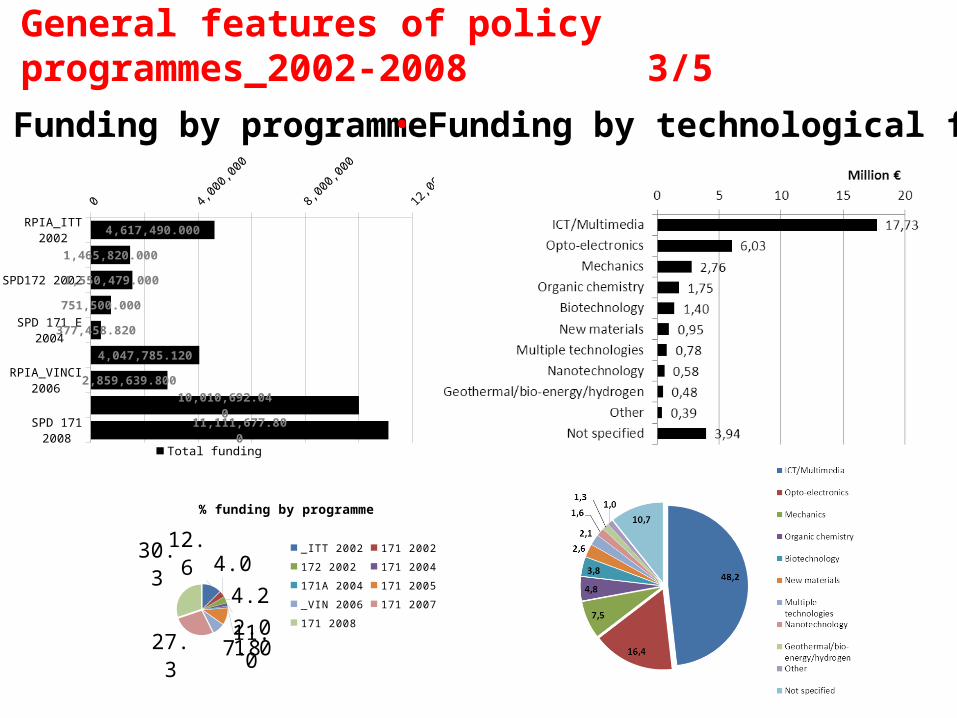
4,617,490.000
1,465,820.000
1,550,479.000
751,500.000
377,458.820
4,047,785.120
2,859,639.800
10,010,692.040
11,111,677.800
Total funding
12.6 4.04.22.01.011.0
7.827.3
30.3
% funding by programme_ITT 2002171 2002172 2002171 2004171A 2004171 2005_VIN 2006171 2007171 2008
• Funding by programme
General features of policy programmes_2002-2008 3/5
• Funding by technological field
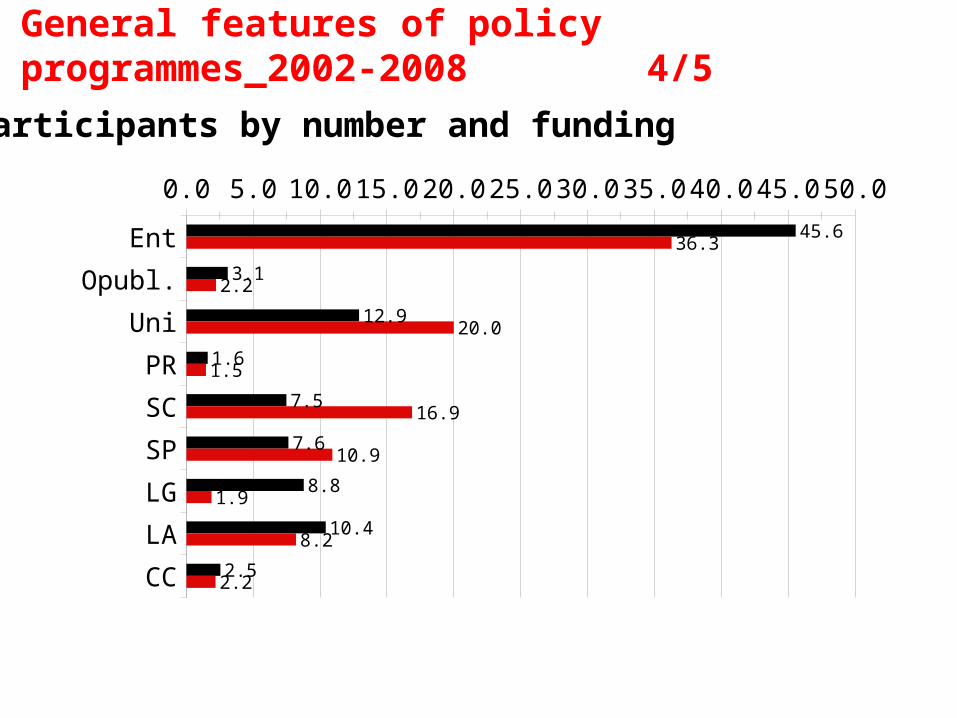
Ent
Opubl.
Uni
PR
SC
SP
LG
LA
CC
0.0 5.0 10.0 15.0 20.0 25.0 30.0 35.0 40.0 45.0 50.045.6
3.1
12.9
1.6
7.5
7.6
8.8
10.4
2.5
36.3
2.2
20.0
1.5
16.9
10.9
1.9
8.2
2.2
% funds % participants
• Participants by number and funding
General features of policy programmes_2002-2008 4/5
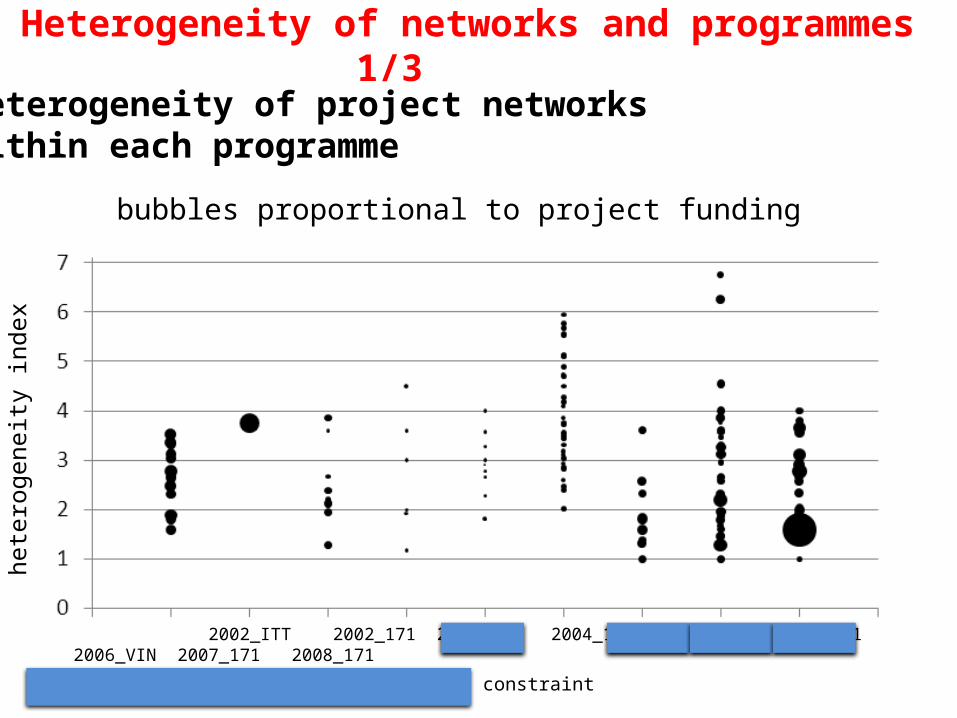
bubbles proportional to project funding
2002_ITT 2002_171 2002_172 2004_171 2004_171E 2005_171 2006_VIN 2007_171 2008_171
hete
roge
neity
inde
x
Heterogeneity of networks and programmes 1/3• Heterogeneity of project networks
within each programme
programme without minimum heterogeneity constraint
0
1
2
3
4
5
6
7
2002_ITT
Serie1 Serie2 Serie3 Serie4 Serie5
0
1
2
3
4
5
6
7
2002_171
Serie1 Serie2 Serie3 Serie4 Serie5
0
1
2
3
4
5
6
7
2002_172
Serie1 Serie2 Serie3 Serie4 Serie5
0
1
2
3
4
5
6
7
2004_171
Serie1 Serie2 Serie3 Serie4 Serie5
0
1
2
3
4
5
6
7
2004_171E
Serie1 Serie2 Serie3 Serie4 Serie5
0
1
2
3
4
5
6
7
2005_171
Serie1 Serie2 Serie3 Serie4 Serie5
0
1
2
3
4
5
6
7
2006_VIN
Serie1 Serie2 Serie3 Serie4
0
1
2
3
4
5
6
7
2007_171
Serie1 Serie2
0
1
2
3
4
5
6
7
2008_171
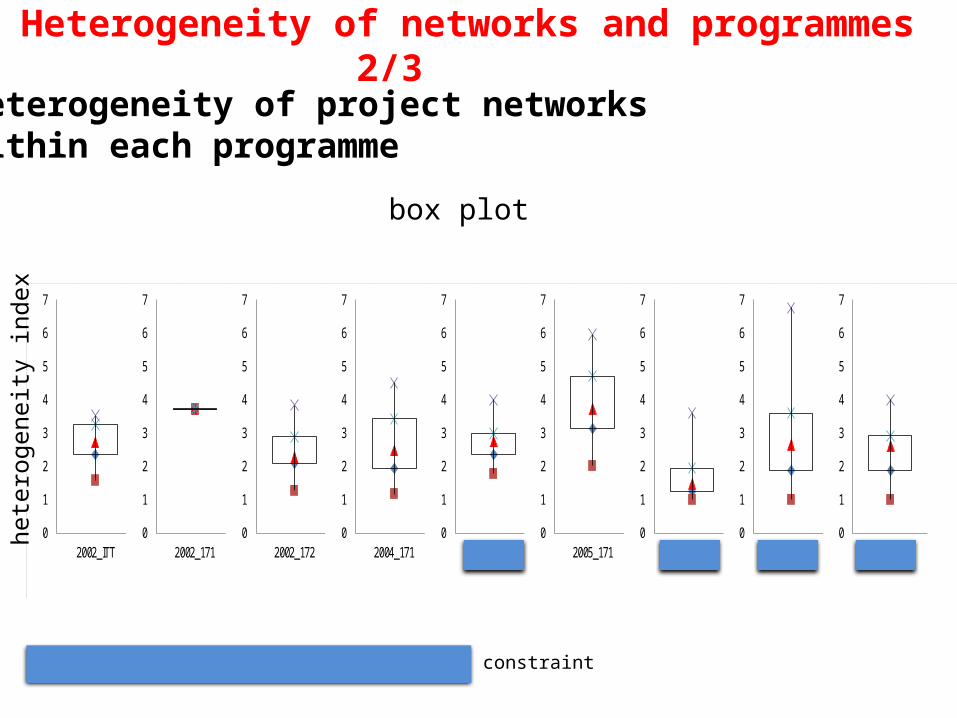
programme without minimum heterogeneity constraint
hete
roge
neity
inde
xHeterogeneity of networks and programmes 2/3• Heterogeneity of project networks
within each programme
box plot
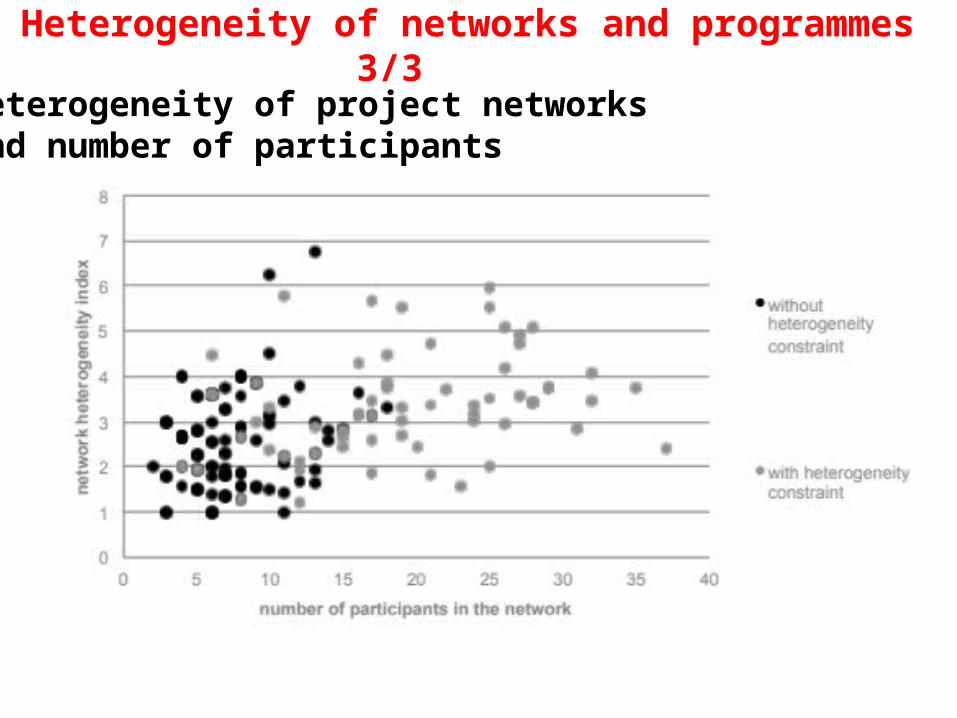
Heterogeneity of networks and programmes 3/3• Heterogeneity of project networks
and number of participants
2002
2002
2002
2004
2004
2005
2006
2007
2008
_IT
T1
71
17
21
71
17
1A
17
1_
VIN
17
11
71
0% 10% 20% 30% 40% 50% 60% 70% 80% 90% 100%
223
27
65
25
47
467
50
138
83
8
11
11
19
12
2
2
2
25
2
2
2
61
18
130
157
8
3
3
Since 2002 Since 2004
Since 2005 Since 2006
Since 2007 One (or more) of the previous year(s)
New participants
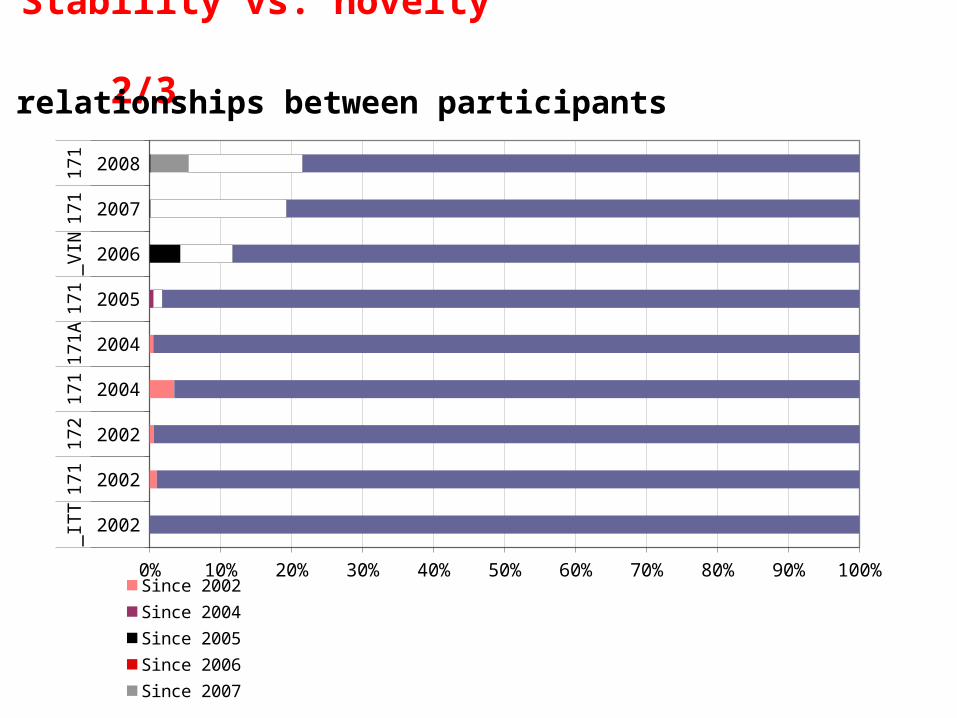
Stability vs. novelty 1/3• of network participants
2002
2002
2002
2004
2004
2005
2006
2007
2008
_IT
T1
71
17
21
71
17
1A
17
1_
VIN
17
11
71
0% 10% 20% 30% 40% 50% 60% 70% 80% 90% 100%Since 2002 Since 2004
Since 2005 Since 2006
Since 2007 One (or more) of the previous year(s)
New relations
Stability vs. novelty 2/3• of relationships between participants
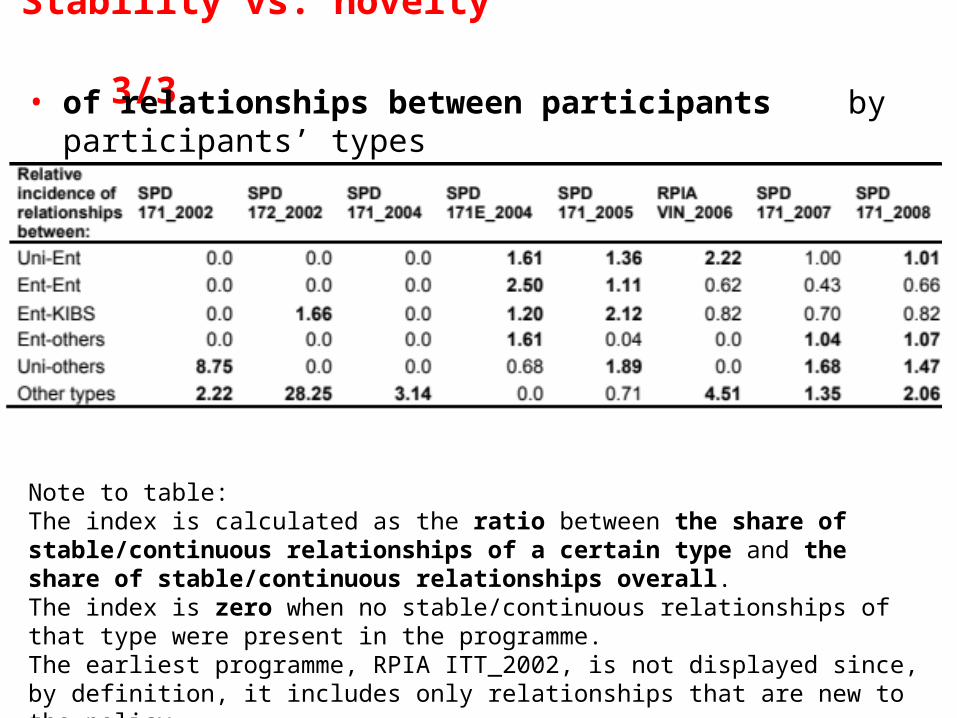
Note to table: The index is calculated as the ratio between the share of stable/continuous relationships of a certain type and the share of stable/continuous relationships overall. The index is zero when no stable/continuous relationships of that type were present in the programme. The earliest programme, RPIA ITT_2002, is not displayed since, by definition, it includes only relationships that are new to the policy.
Stability vs. novelty 3/3• of relationships between participants by participants’ types
By participating in policy-supported innovation networks,
do organizations improve their networking abilities?
• Effects of participation to policies on organizations’ ability to
– form innovative heterogeneous networks
– engage in stable relationships:
two periods analysis: formation vs. consolidation stage
The “learning effects” of policies 1/8
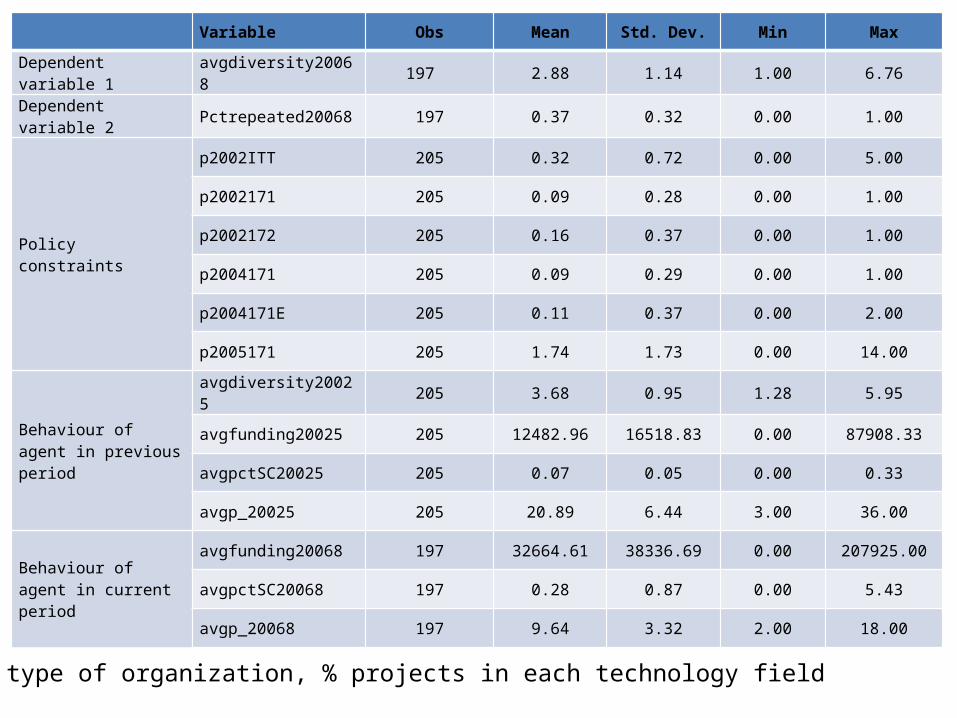
Variable Obs Mean Std. Dev. Min Max
Dependent variable 1 avgdiversity20068 197 2.88 1.14 1.00 6.76
Dependent variable 2 Pctrepeated20068 197 0.37 0.32 0.00 1.00
Policy constraints
p2002ITT 205 0.32 0.72 0.00 5.00
p2002171 205 0.09 0.28 0.00 1.00
p2002172 205 0.16 0.37 0.00 1.00
p2004171 205 0.09 0.29 0.00 1.00
p2004171E 205 0.11 0.37 0.00 2.00
p2005171 205 1.74 1.73 0.00 14.00
Behaviour of agent in previous period
avgdiversity20025 205 3.68 0.95 1.28 5.95
avgfunding20025 205 12482.96 16518.83 0.00 87908.33
avgpctSC20025 205 0.07 0.05 0.00 0.33
avgp_20025 205 20.89 6.44 3.00 36.00
Behaviour of agent in current period
avgfunding20068 197 32664.61 38336.69 0.00 207925.00
avgpctSC20068 197 0.28 0.87 0.00 5.43
avgp_20068 197 9.64 3.32 2.00 18.00
Controls: type of organization, % projects in each technology field 2/8
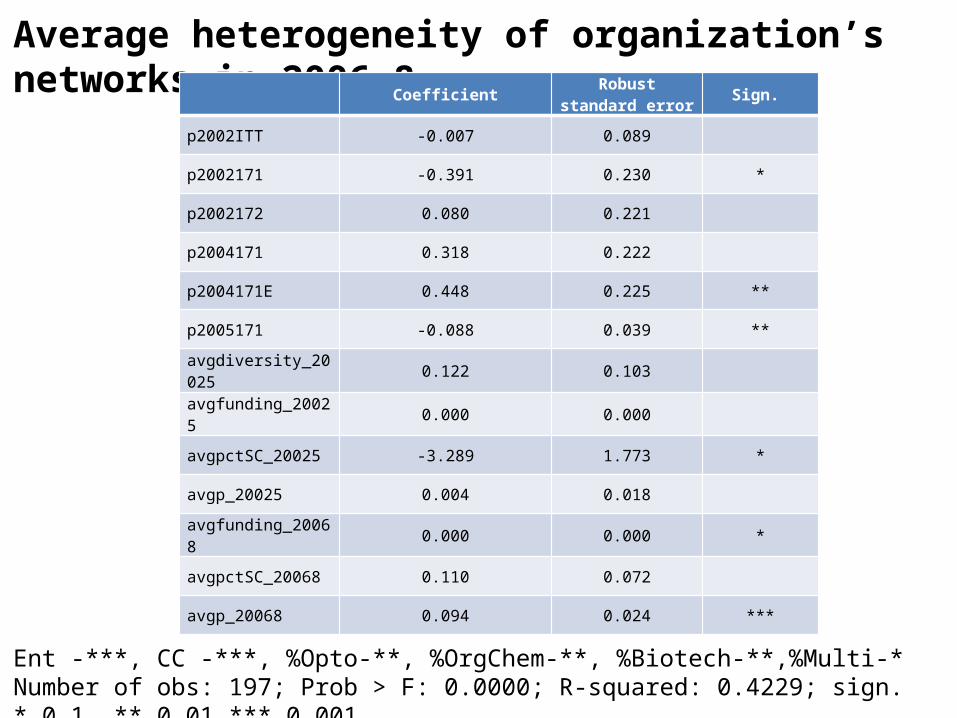
Average heterogeneity of organization’s networks in 2006-8 Coefficient
Robust standard error
Sign.
p2002ITT -0.007 0.089
p2002171 -0.391 0.230 *
p2002172 0.080 0.221
p2004171 0.318 0.222
p2004171E 0.448 0.225 **
p2005171 -0.088 0.039 **
avgdiversity_20025 0.122 0.103
avgfunding_20025 0.000 0.000
avgpctSC_20025 -3.289 1.773 *
avgp_20025 0.004 0.018
avgfunding_20068 0.000 0.000 *
avgpctSC_20068 0.110 0.072
avgp_20068 0.094 0.024 ***
Ent -***, CC -***, %Opto-**, %OrgChem-**, %Biotech-**,%Multi-*Number of obs: 197; Prob > F: 0.0000; R-squared: 0.4229; sign. * 0.1, ** 0.01 *** 0.001 3/8
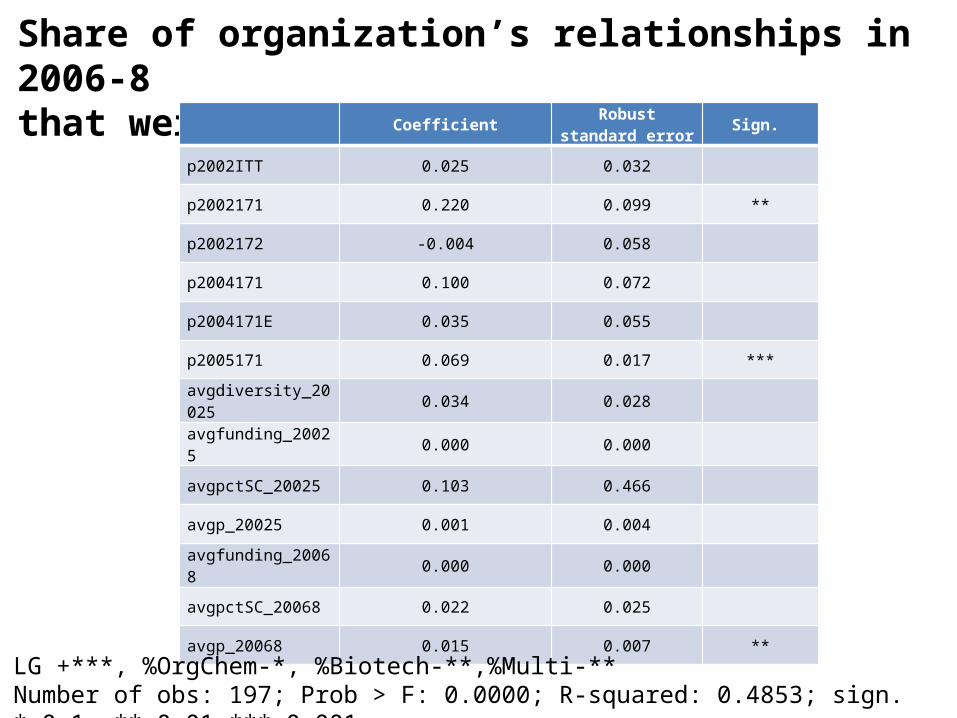
Share of organization’s relationships in 2006-8 that were already active in 2002-5
CoefficientRobust standard
errorSign.
p2002ITT 0.025 0.032
p2002171 0.220 0.099 **
p2002172 -0.004 0.058
p2004171 0.100 0.072
p2004171E 0.035 0.055
p2005171 0.069 0.017 ***
avgdiversity_20025 0.034 0.028
avgfunding_20025 0.000 0.000
avgpctSC_20025 0.103 0.466
avgp_20025 0.001 0.004
avgfunding_20068 0.000 0.000
avgpctSC_20068 0.022 0.025
avgp_20068 0.015 0.007 **
LG +***, %OrgChem-*, %Biotech-**,%Multi-**Number of obs: 197; Prob > F: 0.0000; R-squared: 0.4853; sign. * 0.1, ** 0.01 *** 0.001 4/8
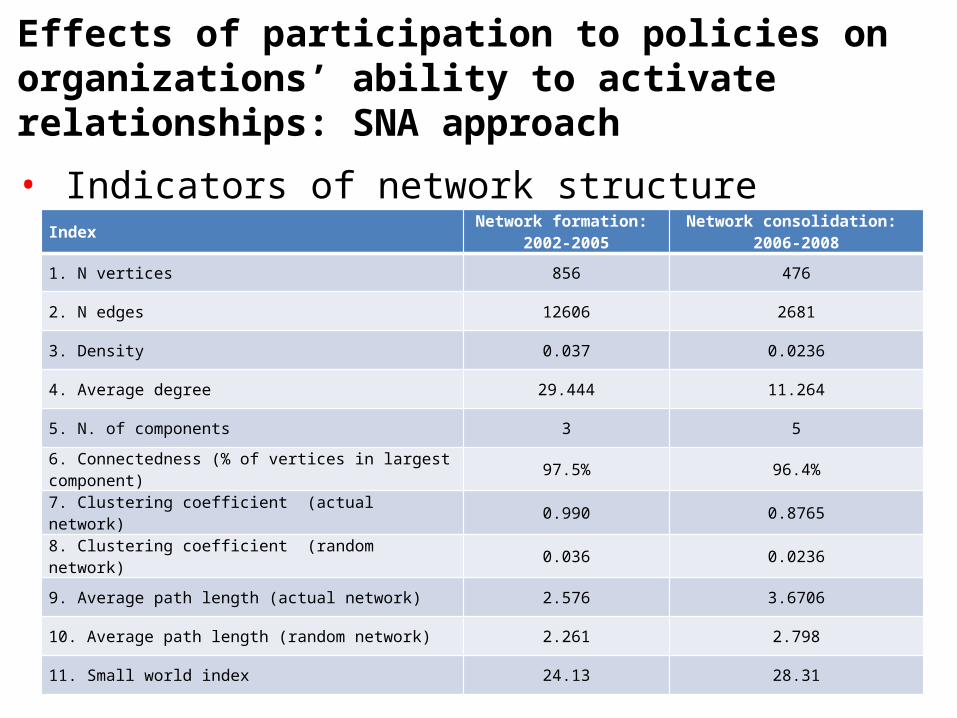
Effects of participation to policies on organizations’ ability to activate relationships: SNA approach
• Indicators of network structure
IndexNetwork formation:
2002-2005Network consolidation:
2006-2008
1. N vertices 856 476
2. N edges 12606 2681
3. Density 0.037 0.0236
4. Average degree 29.444 11.264
5. N. of components 3 5
6. Connectedness (% of vertices in largest component) 97.5% 96.4%
7. Clustering coefficient (actual network) 0.990 0.8765
8. Clustering coefficient (random network) 0.036 0.0236
9. Average path length (actual network) 2.576 3.6706
10. Average path length (random network) 2.261 2.798
11. Small world index 24.13 28.31
5/8
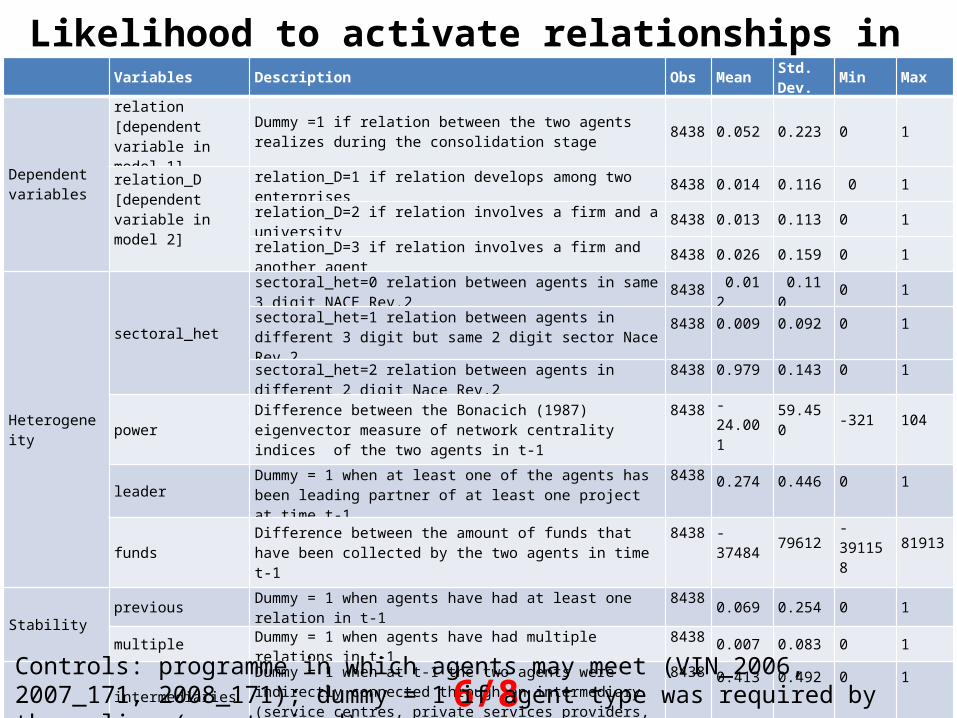
Likelihood to activate relationships in 2006-8 Variables Description Obs Mean Std.
Dev. Min Max
Dependent variables
relation [dependent variable in model 1]
Dummy =1 if relation between the two agents realizes during the consolidation stage 8438 0.052 0.223 0 1
relation_D [dependent variable in model 2]
relation_D=1 if relation develops among two enterprises 8438 0.014 0.116 0 1
relation_D=2 if relation involves a firm and a university 8438 0.013 0.113 0 1relation_D=3 if relation involves a firm and another agent 8438 0.026 0.159 0 1
Heterogeneity
sectoral_het
sectoral_het=0 relation between agents in same 3 digit NACE Rev.2 8438 0.012 0.110 0 1
sectoral_het=1 relation between agents in different 3 digit but same 2 digit sector Nace Rev.2
8438 0.009 0.092 0 1
sectoral_het=2 relation between agents in different 2 digit Nace Rev.2
8438 0.979 0.143 0 1
power Difference between the Bonacich (1987) eigenvector measure of network centrality indices of the two agents in t-1
8438 -24.001 59.450 -321 104
leader Dummy = 1 when at least one of the agents has been leading partner of at least one project at time t-1
8438 0.274 0.446 0 1
funds Difference between the amount of funds that have been collected by the two agents in time t-1
8438 -37484 79612 -391158 81913
Stability previous Dummy = 1 when agents have had at least one relation in t-1 8438 0.069 0.254 0 1
multiple Dummy = 1 when agents have had multiple relations in t-1 8438 0.007 0.083 0 1
Intermediaries
intermediariesDummy = 1 when at t-1 the two agents were indirectly connected through an intermediary (service centres, private services providers, business associations and chamber of commerce)
8438 0.413 0.492 0 1
sc Dummy = 1 when the two agents at t-1 were indirectly connected through an innovation centre.
8438 0.202 0.402 0 1
other_interm Dummy variable = 1 when the two agents at t-1 were indirectly connected through an intermediary which is not an innovation centre.
8438 0.146 0.353 0 1
6/8Controls: programme in which agents may meet (VIN_2006, 2007_171, 2008_171); dummy = 1 if agent type was required by the policy (constrained)
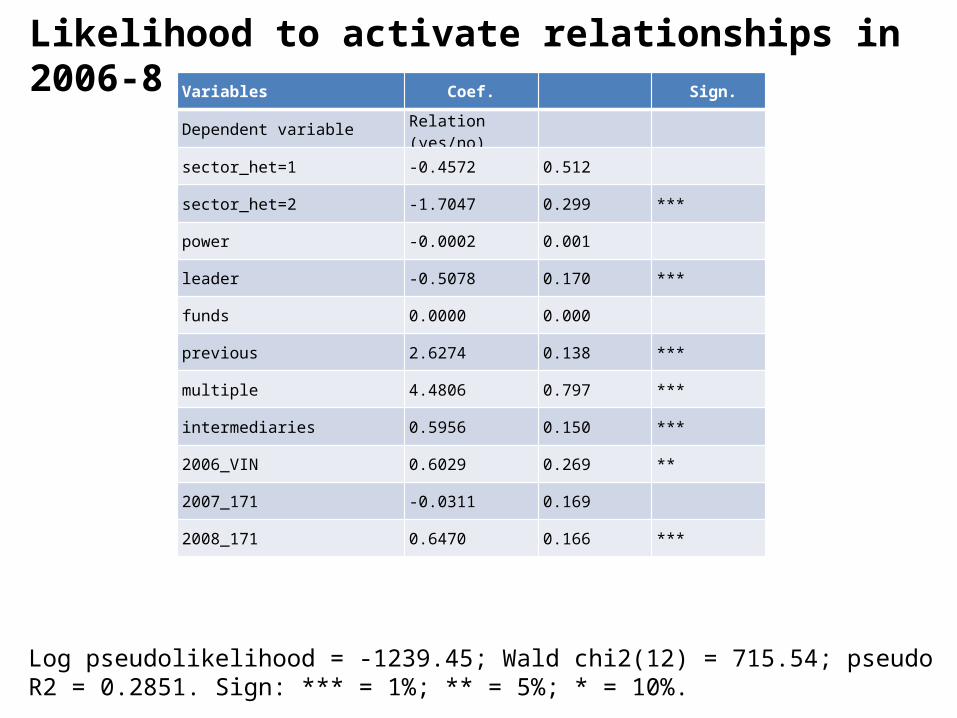
Likelihood to activate relationships in 2006-8 Variables Coef. Sign.
Dependent variable Relation (yes/no)
sector_het=1 -0.4572 0.512
sector_het=2 -1.7047 0.299 ***
power -0.0002 0.001
leader -0.5078 0.170 ***
funds 0.0000 0.000
previous 2.6274 0.138 ***
multiple 4.4806 0.797 ***
intermediaries 0.5956 0.150 ***
2006_VIN 0.6029 0.269 **
2007_171 -0.0311 0.169
2008_171 0.6470 0.166 ***
Log pseudolikelihood = -1239.45; Wald chi2(12) = 715.54; pseudo R2 = 0.2851. Sign: *** = 1%; ** = 5%; * = 10%. 7/8
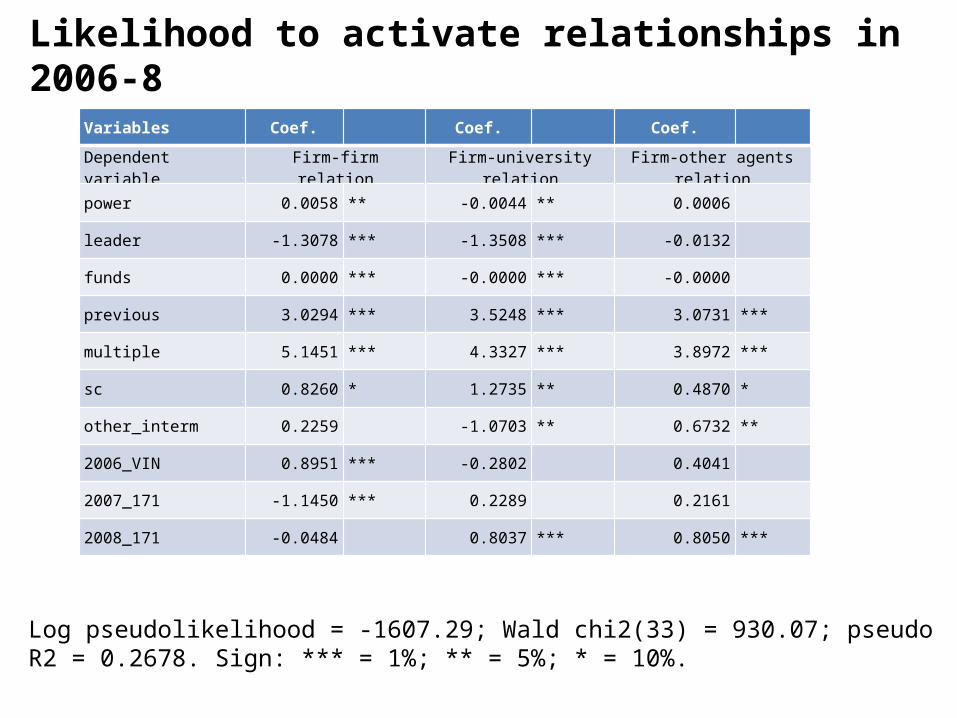
Likelihood to activate relationships in 2006-8
Variables Coef. Coef. Coef.
Dependent variable Firm-firm relation Firm-university relation Firm-other agents relation
power 0.0058 ** -0.0044 ** 0.0006
leader -1.3078 *** -1.3508 *** -0.0132
funds 0.0000 *** -0.0000 *** -0.0000
previous 3.0294 *** 3.5248 *** 3.0731 ***
multiple 5.1451 *** 4.3327 *** 3.8972 ***
sc 0.8260 * 1.2735 ** 0.4870 *
other_interm 0.2259 -1.0703 ** 0.6732 **
2006_VIN 0.8951 *** -0.2802 0.4041
2007_171 -1.1450 *** 0.2289 0.2161
2008_171 -0.0484 0.8037 *** 0.8050 ***
Log pseudolikelihood = -1607.29; Wald chi2(33) = 930.07; pseudo R2 = 0.2678. Sign: *** = 1%; ** = 5%; * = 10%.
8/8
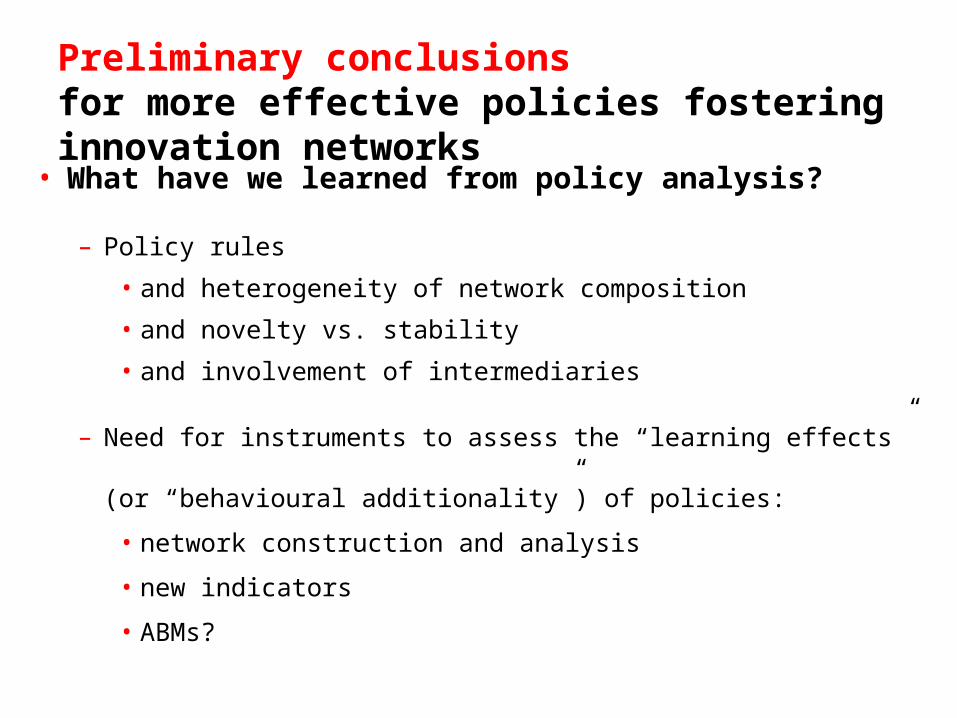
Preliminary conclusionsfor more effective policies fostering innovation networks
• What have we learned from policy analysis?
– Policy rules
• and heterogeneity of network composition
• and novelty vs. stability
• and involvement of intermediaries
– Need for instruments to assess the “learning effects”
(or “behavioural additionality”) of policies:
• network construction and analysis
• new indicators
• ABMs?
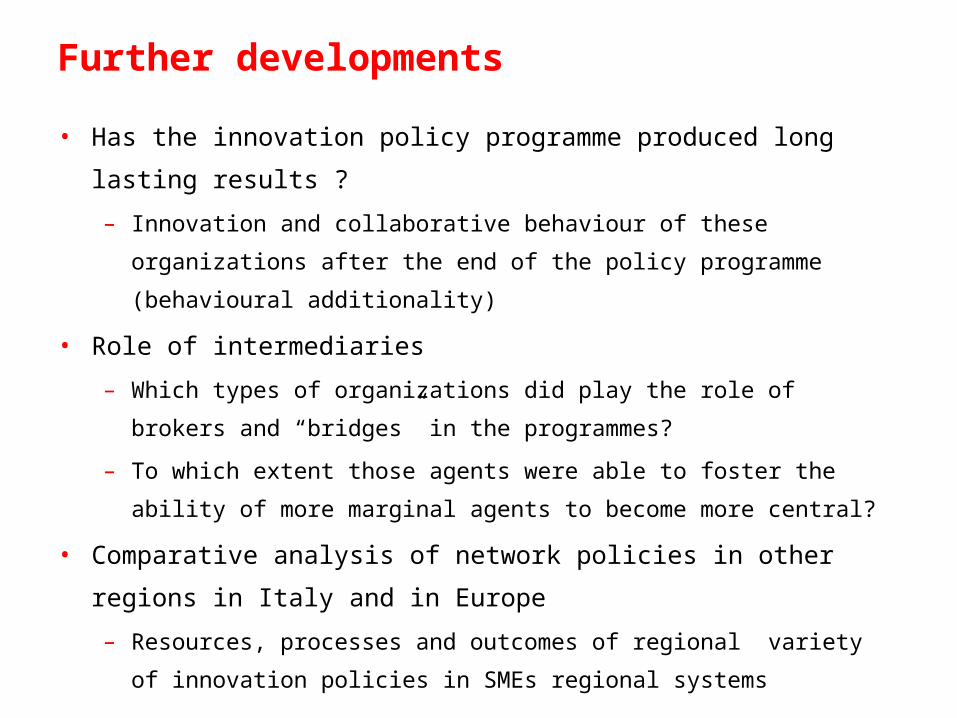
Further developments
• Has the innovation policy programme produced long lasting results ?
– Innovation and collaborative behaviour of these organizations after the end of
the policy programme (behavioural additionality)
• Role of intermediaries
– Which types of organizations did play the role of brokers and “bridges” in the
programmes?
– To which extent those agents were able to foster the ability of more marginal
agents to become more central?
• Comparative analysis of network policies in other regions in Italy and in
Europe
– Resources, processes and outcomes of regional variety of innovation policies
in SMEs regional systems