Embed Size (px)
Citation preview
IntroductionPolymer Analysis Techniques
Types of Projects
Research Goals
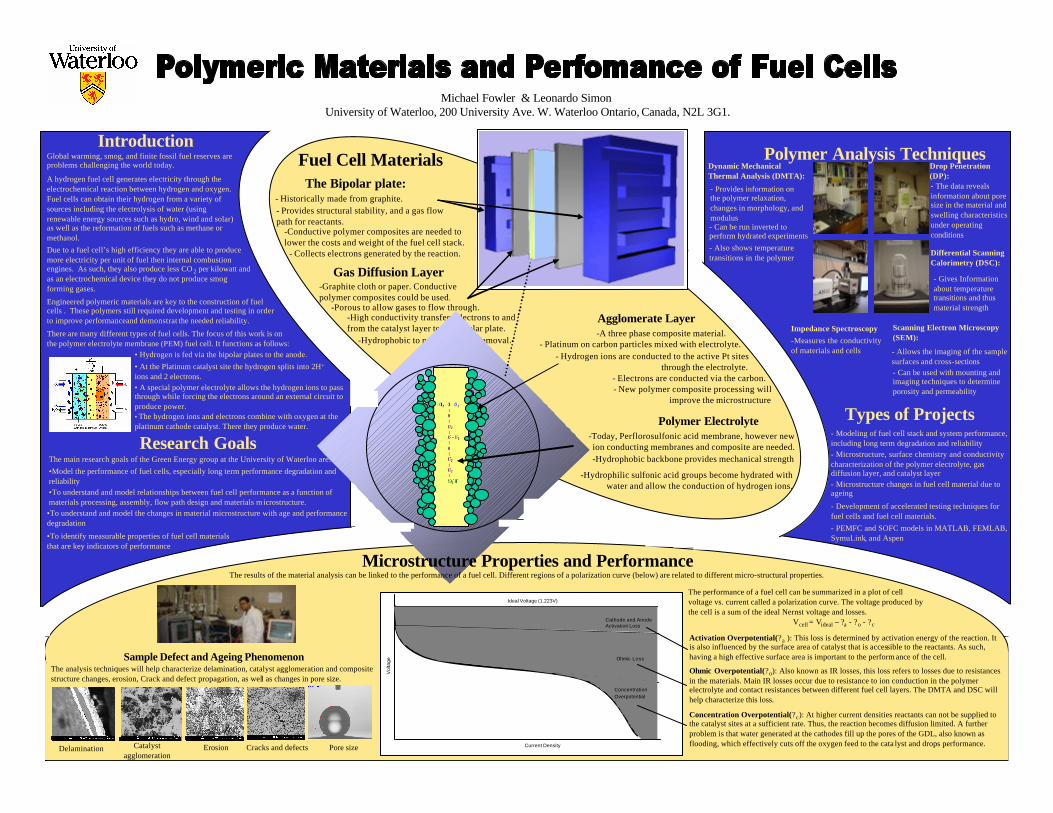
Michael Fowler & Leonardo Simon
The main research goals of the Green Energy group at the University of Waterloo are:•Model the performance of fuel cells, especially long term performance degradation and reliability
Sample Defect and Ageing Phenomenon The analysis techniques will help characterize delamination, catalyst agglomeration and composite structure changes, erosion, Crack and defect propagation, as well as changes in pore size.
Catalyst agglomeration
Pore sizeCracks and defectsErosion
Impedance Spectroscopy
Fuel Cell MaterialsThe Bipolar plate:
University of Waterloo, 200 University Ave. W. Waterloo Ontario, Canada, N2L 3G1.
- Historically made from graphite.- Provides structural stability, and a gas flow path for reactants.
-Conductive polymer composites are needed to lower the costs and weight of the fuel cell stack.
- Collects electrons generated by the reaction.
Gas Diffusion Layer-Graphite cloth or paper. Conductive polymer composites could be used.
-Porous to allow gases to flow through.-High conductivity transfers electrons to and from the catalyst layer to the bipolar plate.
-Hydrophobic to promote water removal.
Agglomerate Layer -A three phase composite material.
- Hydrogen ions are conducted to the active Pt sites through the electrolyte.
- New polymer composite processing will improve the microstructure
Polymer Electrolyte -Today, Perflorosulfonic acid membrane, however new ion conducting membranes and composite are needed.-Hydrophobic backbone provides mechanical strength
-Hydrophilic sulfonic acid groups become hydrated with water and allow the conduction of hydrogen ions.
- Platinum on carbon particles mixed with electrolyte.
- Electrons are conducted via the carbon.
• Hydrogen is fed via the bipolar plates to the anode.
There are many different types of fuel cells. The focus of this work is on the polymer electrolyte membrane (PEM) fuel cell. It functions as follows:
• At the Platinum catalyst site the hydrogen splits into 2H+
ions and 2 electrons.• A special polymer electrolyte allows the hydrogen ions to pass through while forcing the electrons around an external circuit to produce power.• The hydrogen ions and electrons combine with oxygen at the platinum cathode catalyst. There they produce water.
Global warming, smog, and finite fossil fuel reserves are problems challenging the world today.
A hydrogen fuel cell generates electricity through the electrochemical reaction between hydrogen and oxygen. Fuel cells can obtain their hydrogen from a variety of sources including the electrolysis of water (using renewable energy sources such as hydro, wind and solar) as well as the reformation of fuels such as methane or methanol.Due to a fuel cell’s high efficiency they are able to produce more electricity per unit of fuel then internal combustion engines. As such, they also produce less CO 2 per kilowatt and as an electrochemical device they do not produce smog forming gases.
Engineered polymeric materials are key to the construction of fuel cells . These polymers still required development and testing in order to improve performanceand demonstrat the needed reliability.
•To identify measurable properties of fuel cell materials that are key indicators of performance
•To understand and model the changes in material microstructure with age and performance degradation
•To understand and model relationships between fuel cell performance as a function of materials processing, assembly, flow path design and materials m icrostructure.
Dynamic Mechanical Thermal Analysis (DMTA):
Differential Scanning Calorimetry (DSC):
Drop Penetration (DP):
- Also shows temperature transitions in the polymer
- Can be run inverted to perform hydrated experiments
- Provides information on the polymer relaxation, changes in morphology, and modulus
- The data reveals information about pore size in the material and swelling characteristics under operating conditions
- Gives Information about temperature transitions and thus material strength
Scanning Electron Microscopy (SEM):
- Allows the imaging of the sample surfaces and cross-sections- Can be used with mounting and imaging techniques to determine porosity and permeability
-Measures the conductivity of materials and cells
- Modeling of fuel cell stack and system performance, including long term degradation and reliability- Microstructure, surface chemistry and conductivity characterization of the polymer electrolyte, gas diffusion layer, and catalyst layer- Microstructure changes in fuel cell material due to ageing
- Development of accelerated testing techniques for fuel cells and fuel cell materials.- PEMFC and SOFC models in MATLAB, FEMLAB, SymuLink, and Aspen
Microstructure Properties and Performance
Activation Overpotential(?a ): This loss is determined by activation energy of the reaction. It is also influenced by the surface area of catalyst that is accessible to the reactants. As such, having a high effective surface area is important to the perform ance of the cell.
Ohmic Overpotential(?o): Also known as IR losses, this loss refers to losses due to resistances in the materials. Main IR losses occur due to resistance to ion conduction in the polymer electrolyte and contact resistances between different fuel cell layers. The DMTA and DSC will help characterize this loss.
Concentration Overpotential(?c): At higher current densities reactants can not be supplied to the catalyst sites at a sufficient rate. Thus, the reaction becomes diffusion limited. A further problem is that water generated at the cathodes fill up the pores of the GDL, also known as flooding, which effectively cuts off the oxygen feed to the cata lyst and drops performance.
The results of the material analysis can be linked to the performance of a fuel cell. Different regions of a polarization curve (below) are related to different micro-structural properties.
The performance of a fuel cell can be summarized in a plot of cell voltage vs. current called a polarization curve. The voltage produced by the cell is a sum of the ideal Nernst voltage and losses.
Vcell = Videal – ?a - ?o - ?c
Vol
tage
Current Density
Ideal Voltage (1.223V)
Cathode and Anode Activation Loss
Ohmic Loss
Concentration Overpotential
Delamination