Embed Size (px)
Citation preview
In this fashion we havenow identified the HLA-restriction for fouradditional immuno-dominant epitopes that
Conclusions
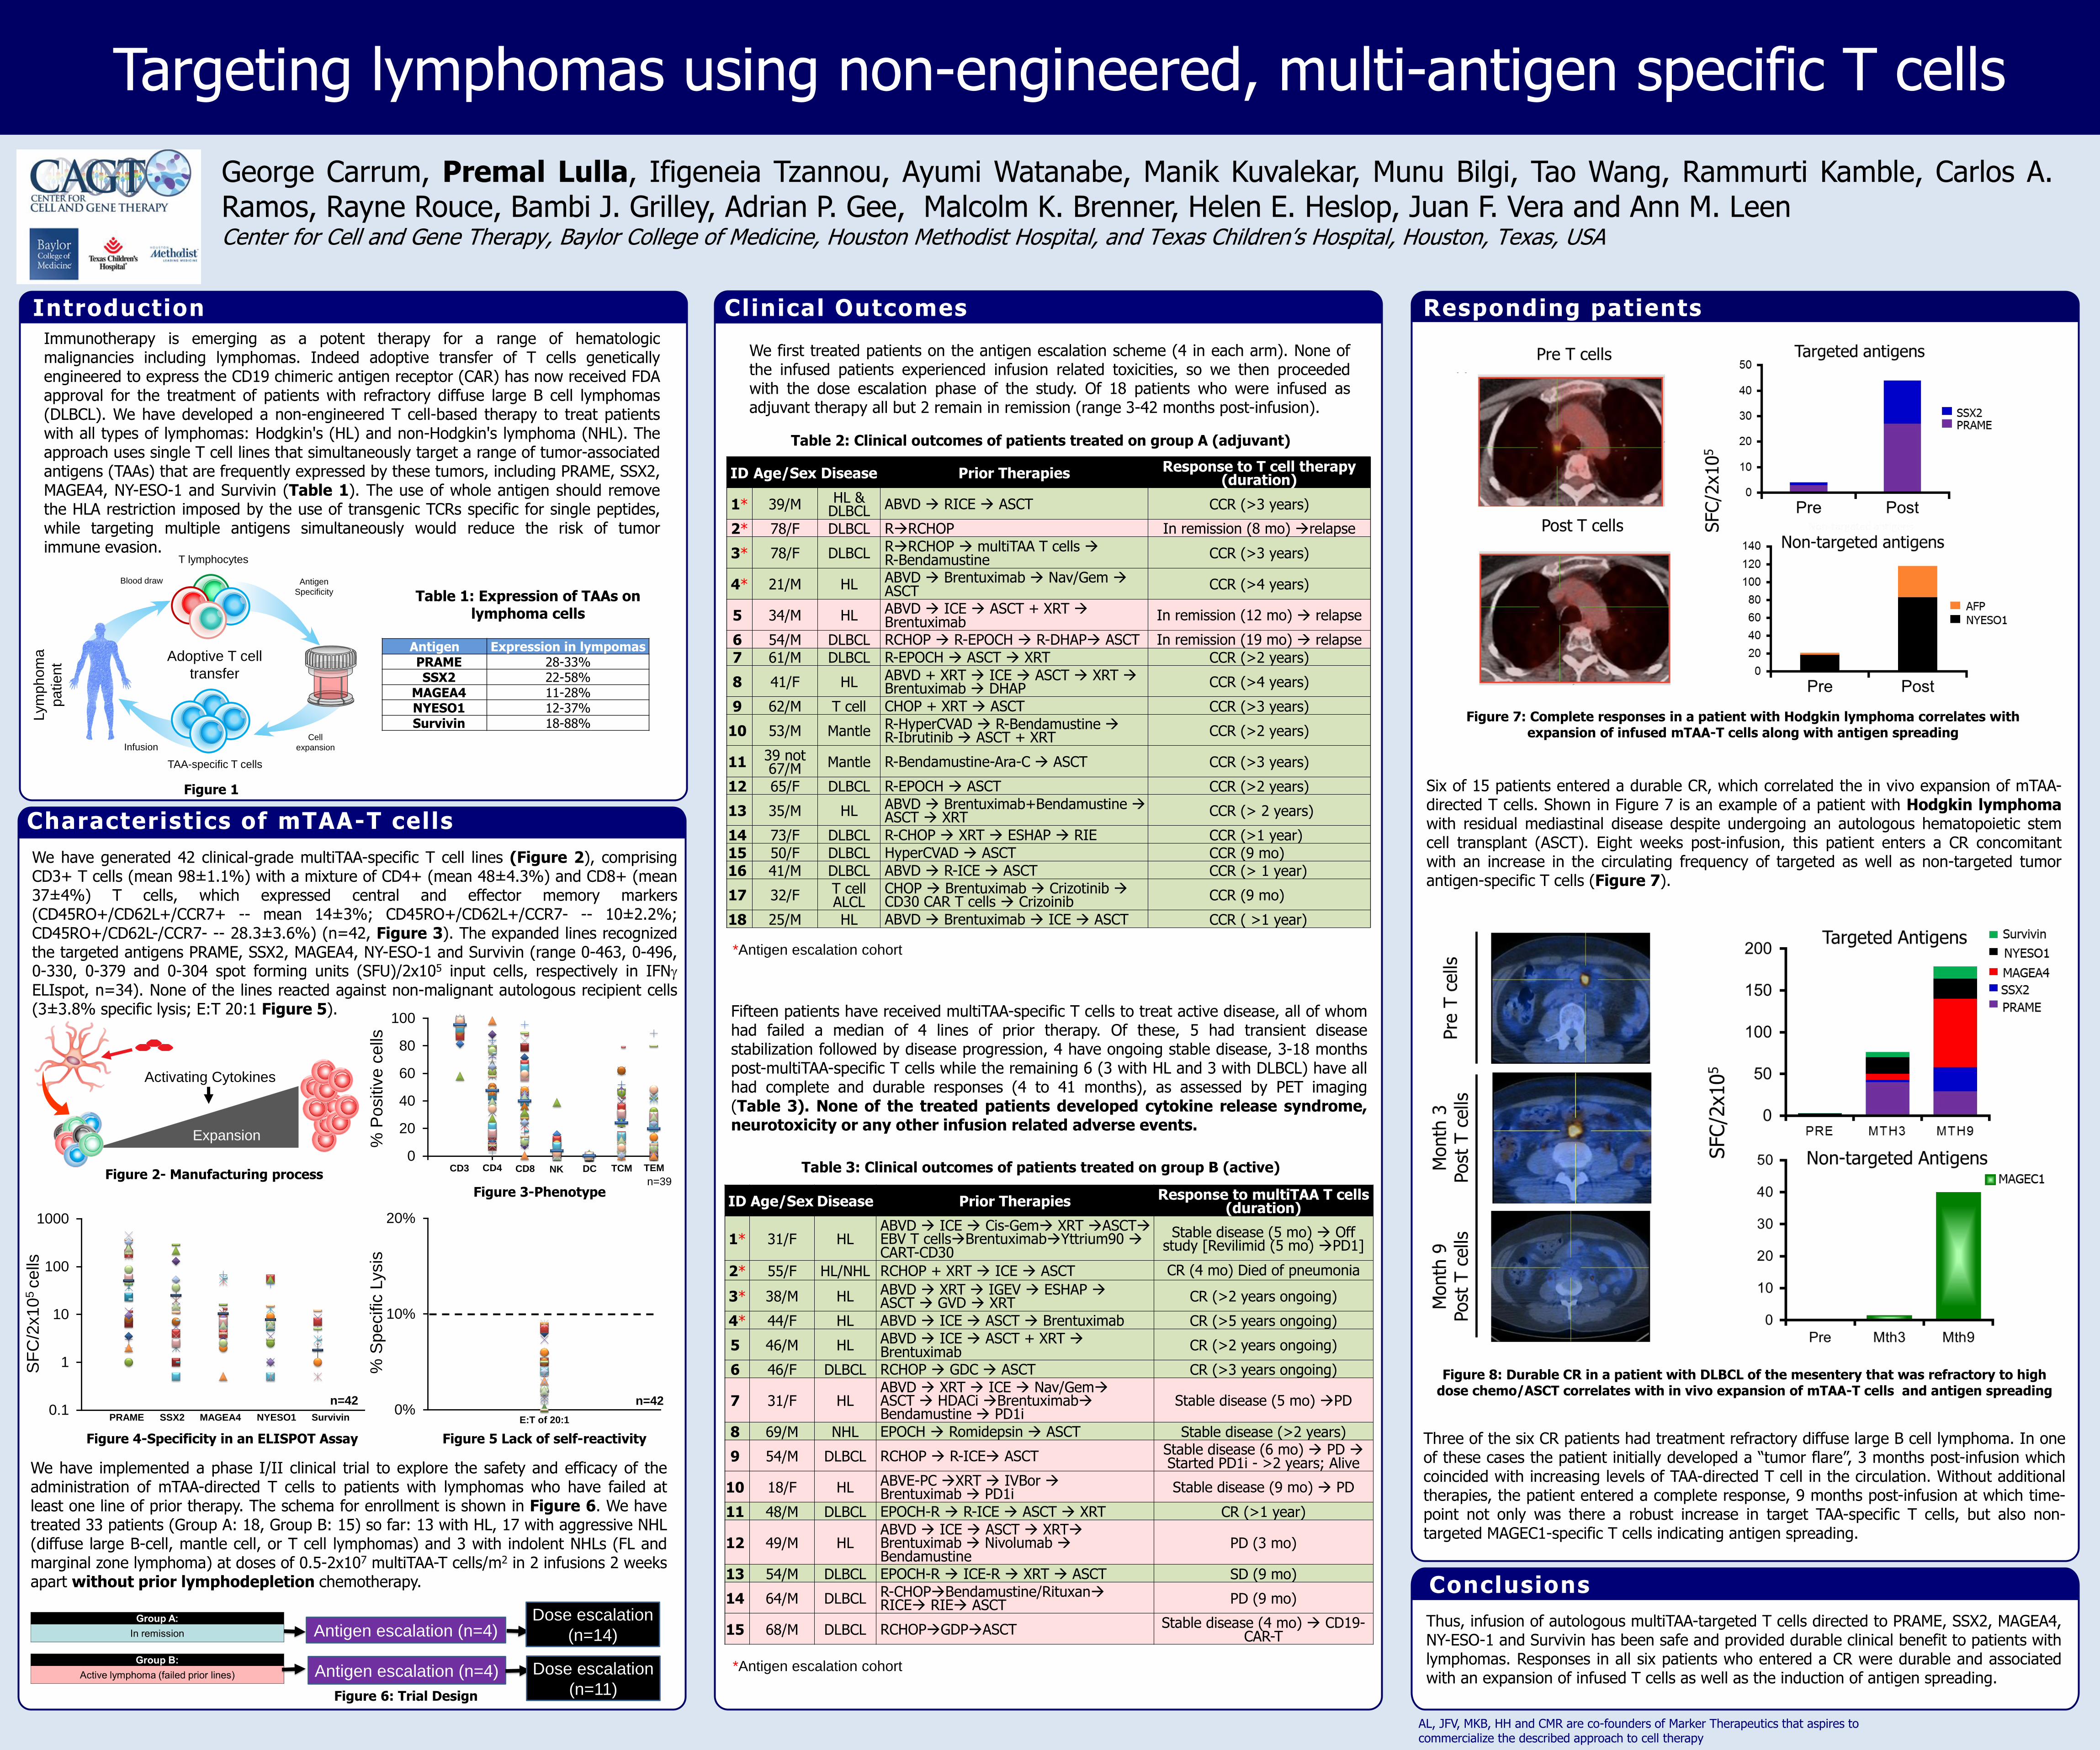
Targeting lymphomas using non-engineered, multi-antigen specific T cells
Thus, infusion of autologous multiTAA-targeted T cells directed to PRAME, SSX2, MAGEA4,NY-ESO-1 and Survivin has been safe and provided durable clinical benefit to patients withlymphomas. Responses in all six patients who entered a CR were durable and associatedwith an expansion of infused T cells as well as the induction of antigen spreading.
Characteristics of mTAA-T cells
Figure 1
George Carrum, Premal Lulla, Ifigeneia Tzannou, Ayumi Watanabe, Manik Kuvalekar, Munu Bilgi, Tao Wang, Rammurti Kamble, Carlos A.Ramos, Rayne Rouce, Bambi J. Grilley, Adrian P. Gee, Malcolm K. Brenner, Helen E. Heslop, Juan F. Vera and Ann M. LeenCenter for Cell and Gene Therapy, Baylor College of Medicine, Houston Methodist Hospital, and Texas Children’s Hospital, Houston, Texas, USA
AL, JFV, MKB, HH and CMR are co-founders of Marker Therapeutics that aspires to commercialize the described approach to cell therapy
Clinical Outcomes Responding patients
InfusionCell
expansion
TAA-specific T cells
Antigen
Specificity
Adoptive T cell
transfer
Blood draw
T lymphocytes
Lym
phom
a
patient
Immunotherapy is emerging as a potent therapy for a range of hematologicmalignancies including lymphomas. Indeed adoptive transfer of T cells geneticallyengineered to express the CD19 chimeric antigen receptor (CAR) has now received FDAapproval for the treatment of patients with refractory diffuse large B cell lymphomas(DLBCL). We have developed a non-engineered T cell-based therapy to treat patientswith all types of lymphomas: Hodgkin's (HL) and non-Hodgkin's lymphoma (NHL). Theapproach uses single T cell lines that simultaneously target a range of tumor-associatedantigens (TAAs) that are frequently expressed by these tumors, including PRAME, SSX2,MAGEA4, NY-ESO-1 and Survivin (Table 1). The use of whole antigen should removethe HLA restriction imposed by the use of transgenic TCRs specific for single peptides,while targeting multiple antigens simultaneously would reduce the risk of tumorimmune evasion.
Figure 2- Manufacturing process
Antigen Expression in lympomasPRAME 28-33%SSX2 22-58%
MAGEA4 11-28%NYESO1 12-37%Survivin 18-88%
Table 1: Expression of TAAs on lymphoma cells
Expansion
7 days
Activating Cytokines
Introduction
Figure 4-Specificity in an ELISPOT Assay
Figure 7: Complete responses in a patient with Hodgkin lymphoma correlates with expansion of infused mTAA-T cells along with antigen spreading
Fifteen patients have received multiTAA-specific T cells to treat active disease, all of whomhad failed a median of 4 lines of prior therapy. Of these, 5 had transient diseasestabilization followed by disease progression, 4 have ongoing stable disease, 3-18 monthspost-multiTAA-specific T cells while the remaining 6 (3 with HL and 3 with DLBCL) have allhad complete and durable responses (4 to 41 months), as assessed by PET imaging(Table 3). None of the treated patients developed cytokine release syndrome,neurotoxicity or any other infusion related adverse events.
We first treated patients on the antigen escalation scheme (4 in each arm). None ofthe infused patients experienced infusion related toxicities, so we then proceededwith the dose escalation phase of the study. Of 18 patients who were infused asadjuvant therapy all but 2 remain in remission (range 3-42 months post-infusion).
Figure 5 Lack of self-reactivity
Antigen escalation (n=4)
Antigen escalation (n=4)
Dose escalation
(n=14)
Dose escalation
(n=11)
We have generated 42 clinical-grade multiTAA-specific T cell lines (Figure 2), comprisingCD3+ T cells (mean 98±1.1%) with a mixture of CD4+ (mean 48±4.3%) and CD8+ (mean37±4%) T cells, which expressed central and effector memory markers(CD45RO+/CD62L+/CCR7+ -- mean 14±3%; CD45RO+/CD62L+/CCR7- -- 10±2.2%;CD45RO+/CD62L-/CCR7- -- 28.3±3.6%) (n=42, Figure 3). The expanded lines recognizedthe targeted antigens PRAME, SSX2, MAGEA4, NY-ESO-1 and Survivin (range 0-463, 0-496,0-330, 0-379 and 0-304 spot forming units (SFU)/2x105 input cells, respectively in IFNELIspot, n=34). None of the lines reacted against non-malignant autologous recipient cells(3±3.8% specific lysis; E:T 20:1 Figure 5).
We have implemented a phase I/II clinical trial to explore the safety and efficacy of theadministration of mTAA-directed T cells to patients with lymphomas who have failed atleast one line of prior therapy. The schema for enrollment is shown in Figure 6. We havetreated 33 patients (Group A: 18, Group B: 15) so far: 13 with HL, 17 with aggressive NHL(diffuse large B-cell, mantle cell, or T cell lymphomas) and 3 with indolent NHLs (FL andmarginal zone lymphoma) at doses of 0.5-2x10⁷ multiTAA-T cells/m2 in 2 infusions 2 weeksapart without prior lymphodepletion chemotherapy.
Table 2: Clinical outcomes of patients treated on group A (adjuvant)
Figure 6: Trial Design
Table 3: Clinical outcomes of patients treated on group B (active)
Figure 8: Durable CR in a patient with DLBCL of the mesentery that was refractory to high dose chemo/ASCT correlates with in vivo expansion of mTAA-T cells and antigen spreading
Six of 15 patients entered a durable CR, which correlated the in vivo expansion of mTAA-directed T cells. Shown in Figure 7 is an example of a patient with Hodgkin lymphomawith residual mediastinal disease despite undergoing an autologous hematopoietic stemcell transplant (ASCT). Eight weeks post-infusion, this patient enters a CR concomitantwith an increase in the circulating frequency of targeted as well as non-targeted tumorantigen-specific T cells (Figure 7).
Three of the six CR patients had treatment refractory diffuse large B cell lymphoma. In oneof these cases the patient initially developed a “tumor flare”, 3 months post-infusion whichcoincided with increasing levels of TAA-directed T cell in the circulation. Without additionaltherapies, the patient entered a complete response, 9 months post-infusion at which time-point not only was there a robust increase in target TAA-specific T cells, but also non-targeted MAGEC1-specific T cells indicating antigen spreading.
0
20
40
60
80
100
0 2 4 6
% P
ositiv
e c
ells
CD4 CD8CD3 DC TCM TEMNK
n=39
0.1
1
10
100
1000
PRAME SSX2 MAGEA4 SurvivinNYESO1
SF
C/2
x10
5 c
ells
0%
10%
20%
% S
pecific
Lysis
E:T of 20:1
n=42
Figure 3-Phenotype
n=42
ID Age/Sex Disease Prior Therapies Response to multiTAA T cells (duration)
1* 31/F HLABVD ICE Cis-Gem XRT ASCTEBV T cellsBrentuximabYttrium90 CART-CD30
Stable disease (5 mo) Off study [Revilimid (5 mo) PD1]
2* 55/F HL/NHL RCHOP + XRT ICE ASCT CR (4 mo) Died of pneumonia
3* 38/M HL ABVD XRT IGEV ESHAP ASCT GVD XRT CR (>2 years ongoing)
4* 44/F HL ABVD ICE ASCT Brentuximab CR (>5 years ongoing)
5 46/M HL ABVD ICE ASCT + XRT Brentuximab CR (>2 years ongoing)
6 46/F DLBCL RCHOP GDC ASCT CR (>3 years ongoing)
7 31/F HLABVD XRT ICE Nav/GemASCT HDACi BrentuximabBendamustine PD1i
Stable disease (5 mo) PD
8 69/M NHL EPOCH Romidepsin ASCT Stable disease (>2 years)
9 54/M DLBCL RCHOP R-ICE ASCT Stable disease (6 mo) PD Started PD1i - >2 years; Alive
10 18/F HL ABVE-PC XRT IVBor Brentuximab PD1i Stable disease (9 mo) PD
11 48/M DLBCL EPOCH-R R-ICE ASCT XRT CR (>1 year)
12 49/M HLABVD ICE ASCT XRTBrentuximab Nivolumab Bendamustine
PD (3 mo)
13 54/M DLBCL EPOCH-R ICE-R XRT ASCT SD (9 mo)
14 64/M DLBCL R-CHOPBendamustine/RituxanRICE RIE ASCT PD (9 mo)
15 68/M DLBCL RCHOPGDPASCT Stable disease (4 mo) CD19-CAR-T
ID Age/Sex Disease Prior Therapies Response to T cell therapy (duration)
1* 39/M HL & DLBCL ABVD RICE ASCT CCR (>3 years)
2* 78/F DLBCL RRCHOP In remission (8 mo) relapse
3* 78/F DLBCL RRCHOP multiTAA T cells R-Bendamustine CCR (>3 years)
4* 21/M HL ABVD Brentuximab Nav/Gem ASCT CCR (>4 years)
5 34/M HL ABVD ICE ASCT + XRT Brentuximab In remission (12 mo) relapse
6 54/M DLBCL RCHOP R-EPOCH R-DHAP ASCT In remission (19 mo) relapse
7 61/M DLBCL R-EPOCH ASCT XRT CCR (>2 years)
8 41/F HL ABVD + XRT ICE ASCT XRT Brentuximab DHAP CCR (>4 years)
9 62/M T cell CHOP + XRT ASCT CCR (>3 years)
10 53/M Mantle R-HyperCVAD R-Bendamustine R-Ibrutinib ASCT + XRT CCR (>2 years)
11 39 not 67/M Mantle R-Bendamustine-Ara-C ASCT CCR (>3 years)
12 65/F DLBCL R-EPOCH ASCT CCR (>2 years)
13 35/M HL ABVD Brentuximab+Bendamustine ASCT XRT CCR (> 2 years)
14 73/F DLBCL R-CHOP XRT ESHAP RIE CCR (>1 year)
15 50/F DLBCL HyperCVAD ASCT CCR (9 mo)
16 41/M DLBCL ABVD R-ICE ASCT CCR (> 1 year)
17 32/F T cell ALCL
CHOP Brentuximab Crizotinib CD30 CAR T cells Crizoinib CCR (9 mo)
18 25/M HL ABVD Brentuximab ICE ASCT CCR ( >1 year)
*Antigen escalation cohort
*Antigen escalation cohort

BACKGROUND
ADOPTIVE T-CELL THERAPY FOR ACUTE LEUKEMIA TARGETING MULTIPLE
TUMOR ASSOCIATED ANTIGENSNaik S, Lulla P, Tzannou I, Velasquez M, Vera JF, Gee AG, Liu H, Krance R, Brenner MK, Rooney CM, Heslop HE, Gottschalk S, Leen AM.
Center for Cell and Gene Therapy, Texas Children’s Hospital, Baylor College of Medicine, Houston, Texas.
DESIGN AND METHODS
•Leukemic relapse remains the major cause of treatment failure in
hematopoietic stem cell transplant (HSCT) recipients
•Donor lymphocyte infusions (DLIs) are not always effective and
are associated with the risk of life-threatening graft-versus-host
disease (GVHD)
•The adoptive transfer of T cells, genetically modified to express
CD19-specific chimeric antigen receptors (CARs), has shown
potent anti-leukemia activity in HSCT recipients with recurrent
disease.
•However, CD19-CAR T cells carry the inherent risk of immune
escape since a single antigen is targeted, and is limited to
malignancies of B-cell lineage
•To overcome these limitations, we now propose to target multiple
tumor associated antigens (multiTAAs) expressed in B- and T-cell
ALL with donor-derived, multiTAA-specific T cells.
CLINICAL TRANSLATION
• Safe to date and feasible for both B-cell and T-cell ALL
• In-vivo expansion of tumor-antigen associated T-cells directed to
target antigens and evidence of antigen spreading which may
contribute to disease control.
• Adoptive transfer of multi TAA-specific T cells may present a
promising addition to current immunotherapeutic approaches for
prophylaxis for leukemic relapse in HSCT recipients.
CONCLUSIONS
•We choose the following tumor associated antigens that are over
expressed on the surface of leukemic cells
TAA Function Expression in leukemia
WT1 Zn finger transcription factor ALL : 70-90%
Survivin Inhibitor of apoptosis ALL : 65-70%
PRAME Repressor of retinoic acid receptor function ALL : 40-45%
Fig 1. Dendritic cells loaded with pepmixes are used as APCs. In the presence of a
Th1-polarizing/pro-proliferative cytokine cocktail T-cells are repeatedly stimulated to
activate multi TAA specific T-cells.
7 days 16 days 23 days
Initiation Expansion
Pepmix loaded DC
Choosing optimal TAA
Generating multi TAA specific T-cells
•Designed a Phase 1 study for patients with high-risk ALL who
undergo allogeneic HSCT.
•Donor-derived mTAA specific T-cells are infused after day +30
following allogeneic HSCT in 3 escalating dose levels : 1) DL1 :
5x10⁶ cells/m2 2) DL2 : 1x10⁷ cells/m2 3) DL3 : 2x10⁷ cells/m2
•Eligible patients can receive up to 6 mTAA specific T-cell infusions,
4-6 weeks apart
•There are 2 groups on study : 1) Group A : As Adjuvant therapy for
patients in remission and 2) Group B : Patients with relapsed
disease after transplant
Study outline
Preliminary data
• All infusions were well tolerated without any adverse events
• To date, infused patients have not experienced any Dose
Limiting Toxicities, Graft-versus-Host disease or CRS
, NCT02494167)
PBMC
ID Age/G Disease Prior TreatmentsDose
level
1 5/F Ph+ ALL Induction chemo Primary induction failure MRD SCT 1
2 18/F HR- ALL Completed therapy for HR- ALL Relapse MRD SCT 1
3 18/F Ph+ ALLCompleted therapy for HR- ALL Relapse MRDSCT Relapse
Chemo CD34+ top -off1
4 41/M HR- ALL HyperCVAD + Ofatumumab x 5 cycles MRD SCT 1
5 8/M Ph+ ALL Completed therapy for HR- ALL Relapse MRD SCT 1
6 48/F HR- ALL Induction chemo Primary induction failure MRD SCT 2
9 12/F T-cell ALL Completed therapy for T- ALL Relapse MRD SCT 2
10 18/M HR-ALL Induction chemo Primary induction failure MRD SCT 2
11 12/F MPAL Induction chemotherapy MRD SCT 3
12 16/M Ph+ ALL Relapsed on therapy for HR- ALL MRD SCT 3
% P
ositiv
e c
ells
SF
C/2
x10
5
1
10
100
1000
0 0 . 5 1 1 . 5 2 2 . 5 3 3 . 5
Fig 3 Donor-derived multi TAA
specific T cell lines (n= 11) show
antigen specificity as assessed by
Elispot assay,
Prame Survivin WT1
Fig 2. Donor-derived multi TAA specific T
cell lines are predominantly comprised of
T-cells and have polyclonal repertoire as
assessed by Flow Cytometry
To date, we have enrolled 14 patients and infused 10 patients with
ALL with multiTAA specific T-cell lines on Group A
Specificity Phenotype
Characterization of Multi TAA specific T-cells
Clinical outcome
ID Age/G Disease Dose level Outcome
1 5/F Ph+ ALL 1 Not evaluable*
2 18/F HR- ALL 1 CR with mixed chimerism for 6 months Relapse
3 18/F Ph+ ALL 1 Remains in CR (16 months)
4 41/M HR- ALL 1 Remains in CR (22.4 months)
5 8/M Ph+ ALL 1 Remains in CR (9 months)
6 48/F HR- ALL 2 Not evaluable*
9 12/F T-cell ALL 2 Remains in CR (11 month)
10 18/M HR-ALL 2 Remains in CR (9 months)
11 12/F MPAL 3 Remains in CR - recent infusion
12 16/M Ph+ ALL 3 Remains in CR – recent infusion
SF
C/5
x1
05
0
50
100
150
200
250
300
350
Preinf Wk 4
WT1
Survivin
Prame
Pt 3 - CR
0
5
10
15
20
25
30
35
Preinf Wk 4
WT1
Survivin
Prame
Pt 4 - CR
SF
C/5
x1
05
0
10
20
30
40
50
60
Preinf Wk 4
WT1
Survivin
Prame
Pt 5 - CR
SF
C/5
x1
05
0
5
10
15
20
Preinf Wk 4
WT1
Survivin
Prame
Pt 2 - Relapse
SF
C/5
x1
05
SF
C/5
x10
5
Target Antigens Antigen spreading
0
50
100
150
200
250
300
350
Preinf Wk 4
WT1
Survivin
Prame
0
50
100
150
200
250
300
350
400
450
Preinf Wk 4
AFP
MART1
MC1
MA3
MA2B
MA1
NYESO1
mageA4
SSX2
Pt 3
*Two patients not evaluable per protocol as they received > 0.5mg/kg of steroids within 4 weeks of infusion and were replaced for dose escalation : 1) Pt 1 : Stress
dose steroids for sepsis 2) Pt 6 : Steroids for transaminitis (GVHD ruled out later)
Correlative studies
Fig 4. Elispot assays show evidence of expansion of multi-TAA specific T-cell
expansion by week 4 post-infusion in all patients that remained in CR. The one
patient who relapse had no evidence of multiTAA expansion, despite 3 additional
infusions
Fig 5. In-vivo antigen cascade. Elispot assays show evidence of antigen
spreading, probably contributing to tumor control.
Pepmix loaded DC
Cytokine cocktail Cytokine cocktail
WT1, Survivin, Prame

Safety and efficacy of multi-TAA-T cells for Myeloma
Premal Lulla, Ifigeneia Tzannou, George Carrum, Carlos A. Ramos,Rammurti Kamble, Mrinalini Bilgi, Adrian P. Gee Shivani Mukhi, BettyChung, Ayumi Watanabe, Manik Kuvalekar, Bambi Grilley, Malcolm K.Brenner, Helen E. Heslop, Juan F. Vera and Ann M. Leen

Therapy ProblemsDexamethasone Infections, osteoporosis
Melphalan Immunosuppression, second cancersThalidomide Neuropathy, Clots, anemiaLenalidomide Clots, anemia, second cancersBortezomib Neuropathy, viral infections
ASCT Immunosuppression, infections
Problems with myeloma therapy
New therapies needed

MultiTAA T cells
MultiTAA T cell therapy for MM
MAGEA4PRAME SurvivinNYESO1SSX2

• Simultaneously target multiple TAAs
• Target multiple epitopes (CD4 and CD8) within each antigen
• T cells with native T cell receptor specificity (non-engineered)
Our approach

MultiTAA-T Cell Generation
Activation
DC
Overlapping pepmixes
PBMCs MultiTAA T cells
Expansion

n=20
0%
20%
40%
60%
80%
100%
CD3+ CD4+ CD8+ DR+/CD83+
Profile of MultiTAA-T cells
RO+/62L+
RO+/62L- -10%
0%
10%
20%
30%
40%
50%
% P
ositi
ve c
ells
Phenotype Safety
% S
peci
fic ly
sis

1
10
100
1000
MultiTAA T cell specificity/polyclonalitySF
C/2
x105
PRAME NYESO1SSX2 MA4 Survivin
1
10
100
1000
10000
100000
# of
clo
nes
mean = 4,597 clones
n=10
Clonal diversity(vβ deep sequencing)

Clinical trial design- Dose escalation (ARM A and B)
PRAME/SSX/MAGE/NYESO1/Survivin-specific T cells: 2-4 pts at each level, 2 infusions 14 days apartDose Level 1: Day 0 and 14: 5x10⁶ cells/m2
Dose Level 2: Day 0 and 14: 1x10⁷ cells/m2
Dose Level 3: Day 0 and 14: 2x10⁷ cells/m2

• Any patient >18 yrs with myeloma diagnosis (post completion of at least 1 treatment regimen)
Group A:>90 days post autologous or syngeneic transplant
Group B:<90 days post autologous or syngeneic transplant
Clinical Trial - Eligibility
• No lymphodepletion
Group B:<90 days post autologous or syngeneic transplant
Group A:>90 days post autologous or syngeneic transplant

ID Age/G Disease DL Prior Treatments1 53/M IgG-kappa 1 Bor/Dex ASCT6 61/M IgG-kappa 1 RVD ASCT7 44/M IgG-kappa 1 CyBorD ASCT14 47/M IgG-kappa 2 RVD ASCT3* 65/F IgG-kappa 1 RVD ASCT CyBorD Carf/D ASCT13 31/F IgG-kappa 2 VD10 69/F IgG-kappa 2 VD ASCT R Pom/Carf/D
15 70/M IgA-kappa 3RVD ASCT R-vidaza Pom/D ibrutinib/Carfdinaciclib/VD CyBorD Daratumumab RD-Elot
Ixa/RD
2* 40/M Free lambda 2 RVD ASCT Pom/Carf/DASCTmTAA T cells
18 50/F Free Kappa 3 VD ASCT Dara/VD XRT ASCT
20 57/M IgG-lambda 3 RVD ASCT R VD Pom/D KPD ASCT Ixa Dara/D
Group A:Patients Enrolled

ID Age/G Disease Marrow Prior Treatments1 53/M Active 10% Bor/Dex ASCT6 61/M In remission 0% RVD ASCT7 44/M In remission 0% CyBorD ASCT14 47/M Active 0% (MRD+) RVD ASCT3* 65/F Active 90% RVD ASCT CyBorD Carf/D ASCT13 31/F Active 4% VD10 69/F Active 10% VD ASCT R Pom/Carf/D
15 70/M Active 80%RVD ASCT R-vidaza Pom/D ibrutinib/Carfdinaciclib/VD CyBorD Daratumumab RD-Elot
Ixa/RD2* 40/M Active 15% RVD ASCT Pom/Carf/DASCTmTAA T cells18 50/F In remission 0% VD ASCT Dara/VD XRT ASCT
20 57/M Active 5% RVD ASCT R VD Pom/D KPD ASCT Ixa Dara/D
Group A:Patients Infused

ID Age/G Disease DL Prior Treatments2 40/M Free lambda 1 RVD ASCT Pom/Carf/D ASCT3 65/F IgG-kappa 1 RVD ASCT CyBorD Carf/D ASCT5 76/M IgG-kappa 1 CyBorD ASCT8 57/M IgA-kappa 2 VTD ASCT Rd Cy/Carf/D ASCT9 50/F IgG-kappa 2 RVD ASCT11 53/M IgG-lambda 2 VD RVD ASCT12 54/M Free lambda 2 RVD/rituximab Rd ASCT17 44/F IgG-kappa 3 VRD KD ASCT19 70/M Free kappa 3 XRT VD ASCT R VD KPD ASCT
Group B:Patients Enrolled

ID Age/G Disease Marrow Prior Treatments2 40/M Active 20% RVD ASCT Pom/Carf/D ASCT3 65/F Active 15% RVD ASCT CyBorD Carf/D ASCT5 76/M Active 20% CyBorD ASCT8 57/M In remission 0% VTD ASCT Rd Cy/Carf/D ASCT9 50/F In remission 0% RVD ASCT11 53/M In remission 0% VD RVD ASCT12 54/M In remission 0% RVD/rituximab Rd ASCT17 44/F Active 0% (MRD+) VRD KD ASCT19 70/M In remission 0% XRT VD ASCT R VD KPD ASCT
Group B:Patients Infused

Active Disease:Clinical Outcomes
ID Age/G Disease Marrow Week 6 Wk 6 Mo121 53/M Active 10% Unknown SD PR14 47/M Active 0% (MRD+) 0% (MRD+) SD SD3* 65/F Active 90% 85% SD PD (2m)13 31/F Active 4% 0% SD SD10 69/F Active 10% 10% SD PD (7m)15 70/M Active 80% 80% SD PD (3m)2* 40/M Active 15% 15% SD SD (3m) 2* 40/M Active 20% 0% CR CR3* 65/F Active 15% 10% SD PD (6m)5 76/M Active 20% 15% SD PR
17 45/F Active 0% (0.4 g/dl) 0% (0.2 g/dl) PR PR (6m)20 57/M Active 5% (0.97 g/dl) 3% (0.53 g/dl) SD SD (3m)

In remission:Clinical Outcomes
Only one patient has relapsed at a median f/u of 21 months
ID Age/G Disease Marrow Week 6 Wk 6 Mo128 57/M In remission 0% 0% CCR CCR9 50/F In remission 0% 0% CCR CCR11 53/M In remission 0% 0% CCR Relapse (7m)12 54/M In remission 0% 0% CCR CCR6 61/M In remission 0% 0% CCR CCR7 44/M In remission 0% 0% CCR CCR
19 70/M In remission 0% 0% CCR CCR (6m)18 50/F In remission 0% 0% CCR CCR (8m)

Correlating clinical benefit with infused multiTAA T cells

How can we track non-gene-modified multiTAA T cells in vivo?
Rationale:• In PBMCs (pre-infusion) tumor-specific T cell frequency v. low
• below TCR vβ deep sequencing detection threshold (1/100,000) • Tumor-directed clones enriched in multiTAA T cells
• Detectable by vβ deep sequencing
Approach:• Deep sequencing of pre-infusion PBMCs and multiTAA T cells
• Identify vβ sequences unique to the line infused
• Enable in vivo tracking

How many “trackable” clones are present in our multiTAA T cells?
0
20
40
60
80
100
% u
niqu
e cl
ones
1
10
100
1000
10000
100000
# of
clo
nes
mean = 4,597 clones
n=10
Clonal diversity in multiTAA T cells Unique clones
59%
95%
Avg = 80%
Pt#2

• Patients enrolled on different arms depending on proximity to transplant [> (Grp A) or < (Grp B) 90 days]• Does post-transplant lymphodepletion impact expansion?
What drives in vivo multiTAA expansion?
• Patients with and without disease enrolled on study• Does presence of antigen influence in vivo expansion?

0
0.2
0.4
0.6
0.8
1
1.2
Pre Early Late
Antigen drives multiTAA expansion – TCR tracking
0
0.2
0.4
0.6
0.8
1
1.2
1
Prod
uctio
n fre
quen
cy
Peripheral blood Marrow
Post infusion
Prod
uctio
n fre
quen
cy
Post infusion
Active diseaseNo disease

0
10
20
30
40
50
60
70
80
Preinf Week 6 Mo 6 Mo 12
Antigen drives multiTAA expansion – ELIspot
Active diseaseNo disease
SFC
/5x1
05PB
MC
s
Peripheral blood
pre wk6 mo6 mo12
0
20
40
60
Pre wk6 mo6 mo12
0
20
40
60
pre wk6 mo6 mo12
Active disease
No disease SurvivinNYESO1MAGEA4SSX2PRAMESF
C/5
x105
PBM
Cs

T cell kinetics in responders

Clinical Response – Pt#2
20% Clonalplasma cells
Diagnosis Pre 1st ASCT ASCT +6m ASCT +22m Pre 2nd ASCT+27m
Pre-T cells(day+61)
Post-T cells(day+113)
Month 6
2nd line2nd ASCT
1st line
1st ASCT
3rd line
100
1000
10000
0
MultiTAAT cells
Free
lam
bda
mg/
L

Clinical Response – Pt#2
<1% Clonal plasma cells
Cyclin D1 neg
20% Clonalplasma cells
Diagnosis Pre 1st ASCT ASCT +6m ASCT +22m Pre 2nd ASCT+27m
Pre-T cells(day+61)
Post-T cells(day+113)
Month 6
2nd line2nd ASCT
1st line
1st ASCT
3rd line
100
1000
10000
0
Normal MultiTAAT cells
Free
lam
bda
mg/
L

0
50
100
150
200
250
300
Pre Wk4 Wk6 Mo3
SFC
/5x1
05
60
120
180
06 Wk Post
SFC
/5x1
05
MAGE A4SSX2
SurvivinNYESO-1
PRAME
Targeted antigens
PBMC Marrow
Clinical Response – Pt#2
MAGE A4SSX2
SurvivinNYESO-1
PRAME

60
120
180
06 Wk Post
SFC
/5x1
05
MAGE A4SSX2
SurvivinNYESO-1
PRAME
Marrow
Clinical Response – Pt#2MAGE-A4
3+
Pre-
infu
sion
1+
8wk
post
T c
ells

Targeted antigens
SFC
/5x1
05
0
50
100
150
200
250
300
Pre Wk4 Wk6 Mo3
60
120
180
06 Wk Post
MAGE A4SSX2
SurvivinNYESO-1
PRAME
MAGE A4SSX2
SurvivinNYESO-1
PRAME
SFC
/5x1
05
PBMC Marrow
In vivo T cell tracking – Pt#2
0
0.1
0.2
0.3
0.4
0.5
Pre Wk4 Mo6
% P
rodu
ctio
n Fr
eque
ncy
0
0.1
0.2
0.3
Wk 6 Post%
Pro
duct
ion
Freq
uenc
y0
0.1
0.2
0.3
0.4
0.5
Pre Wk4 Mo6
multiTAA-derived clones multiTAA-derived clones

Immune escape post multiTAA T cells

0
1
2
3
4
5
6
7
8
Diagnosis 1st line PD+3y Pre 1st HSCT HSCT +2y Pre 2nd HSCT
Pre-T cells (d+47)
Post-T cells (d+89)
IgG
kapp
a M
-spi
ke (g
/dl)
Clinical Course - Pt#3
2nd line
3rd line
1st HSCT
2nd HSCT
1st line
MultiTAAT cells
15% Clonalplasma cells

0
1
2
3
4
5
6
7
8
Diagnosis 1st line PD+3y Pre 1st HSCT HSCT +2y Pre 2nd HSCT
Pre-T cells (d+47)
Post-T cells (d+89)
IgG
kapp
a M
-spi
ke (g
/dl)
Clinical Course - Pt#3
2nd line
3rd line
1st HSCT
2nd HSCT
1st line
15% Clonalplasma cells
10% Clonalplasma cells
MultiTAAT cells

0
20
40
60
80
100
Pre Wk4 Wk6 Mo3
SFC
/2x1
05
MART1MAGE C1
WT1AFP
MAGE A3MAGE A2BMAGE A1
Non-targeted antigens
020406080
100120
Pre Wk4 Wk6 Mo3
SFC
/5x1
05
MAGE A4SSX2
SurvivinNYESO-1
PRAME
Targeted antigens
PBMC
SFC
/5x1
05
PRAME
Marrow
0
200
400
600
6 wkPOST
Clinical Course - Pt#3 - ELIspot

0
20
40
60
80
100
Pre Wk4 Wk6 Mo3
SFC
/2x1
05
MART1MAGE C1
WT1AFP
MAGE A3MAGE A2BMAGE A1
Non-targeted antigens
020406080
100120
Pre Wk4 Wk6 Mo3
SFC
/5x1
05
MAGE A4SSX2
SurvivinNYESO-1
PRAME
Targeted antigens
PBMC
SFC
/5x1
05
PRAME
Marrow
0
200
400
600
6 wkPOST
Clinical Course - Pt#3multiTAA clones in
0
0.5
1
1.5
2
2.5
Wk6
Prod
uctio
n fre
quen
cypost

0
1
2
3
4
5
6
7
8
Diagnosis 1st line PD+3y Pre 1st HSCT HSCT +2y Pre 2nd HSCT Pre-T cells (d+47)
Post-T cells (d+89)
Month 6 Month 8
Clinical Course - Pt#3
2nd line
3rd line
1st HSCT
2nd HSCT
1st line
MultiTAAT cells
10% Clonalplasma cells
15% Clonalplasma cells
IgG
kap
pa M
-spi
ke (g
/dl)

0
1
2
3
4
5
6
7
8
Diagnosis 1st line PD+3y Pre 1st HSCT HSCT +2y Pre 2nd HSCT Pre-T cells (d+47)
Post-T cells (d+89)
Month 6 Month 8
Clinical Course - Pt#3
2nd line
3rd line
1st HSCT
2nd HSCT
1st line
90% Clonalplasma cells
10% Clonalplasma cells
15% Clonalplasma cells
IgG
kap
pa M
-spi
ke (g
/dl)
MultiTAAT cells

0
20
40
60
80
100
Pre Wk4 Wk6 Mo3 Mo6
SFC
/2x1
05
MART1MAGE C1
WT1AFP
MAGE A3MAGE A2BMAGE A1
Non-targeted antigens
020406080
100120
Pre Wk4 Wk6 Mo3 Mo6
SFC
/5x1
05
MAGE A4SSX2
SurvivinNYESO-1
PRAME
Targeted antigens
PBMC
6 moPOST
SFC
/5x1
05
Marrow
0
200
400
600
6 wkPOST
MAGE A4SSX2
SurvivinNYESO-1
PRAME
Clinical Course - Pt#3

Pre Wk8 mth6
50
40
30
20
10
0Pre Wk8 mth6
80
60
40
20
0
SFC/5x10
5
Pre Wk8 mth6
20
0
15
10
5
Pre Wk8 mth6
100
80
60
40
20
0
2
1
0
IHC
Sco
reMAGE-A4
2+
PRAME
2+
Survivin
1+
NYESO1
neg
Pre
Mechanism of Escape

Pre Wk8 mth6
SFC/5x10
5
100
80
60
40
20
0Pre Wk8 mth6
50
40
30
20
10
0
2
1
0Pre Wk8 mth6
80
60
40
20
0Pre Wk8 mth6
20
0
15
10
5IHC
Sco
reMAGE-A4
2+
PRAME
2+
Survivin
1+
NYESO1
neg
Pre
Mechanism of Escape

Pre Wk8 mth6
SFC/5x10
5
100
80
60
40
20
0Pre Wk8 mth6
50
40
30
20
10
0
2
1
0Pre Wk8 mth6
80
60
40
20
0Pre Wk8 mth6
20
0
15
10
5IHC
Sco
re
020406080
100120
Pre Wk4 Wk6 Mo3 Mo6
SFC
/5x1
05
MAGE A4SSX2
SurvivinNYESO-1
PRAME
Targeted antigens
MAGE-A4 PRAMESurvivin NYESO1
Mechanism of Escape

variable genes (n=1,828)
MS4A1IL1B
CD86
CTLA4LAG3
Pre wk6 mo3 mo6
IL6
PD1
SDmo3
MM cell proliferation (n=407)
Fulciniti M et al, Blood Cancer J, 2016Mitchell JS et al, Nat commun, 2016
Mechanism of Escape
Pre wk6 mo3 mo6
SD PD
SD PDImmune activating genes
Immune inhibitory genes
PDmo6
Linghua Wang, David Wheeler HGSC-BCM

• Safe to date (DL3 – Arm A & B)
• Feasible• In vivo expansion of tumor-specific T cells
directed to target antigens• Antigen spreading• Clinical benefit
MultiTAA T cells for myeloma
TRL Lab PIsHelen HeslopCliona RooneyMalcolm BrennerJuan VeraAnn Leen
QA/QC LaboratoryAdrian GeeSara RichmanNatasha LaptevaDebbie LyonApril DurettSuzanne PooleZhuyong MeiCrystal Silva-Lentz
GMP LaboratoryHuimin ZhangBirju Mehta
Funding:Leukemia Texas Reseach grant,Leukemia and Lymphoma SCOR,ASBMT New Investigator Award,ASH Scholar Award, Ruth L.Kirschstein National Research(NIH), BCM Junior Faculty SeedFunding Award, TACCT-CPRIT,EPCRS-DLDCC, LLS/Rising Tide
TRL LaboratoryIfigeneia TzannouShivani MukhiAster WorkinehManik KuvalekarSujita SukumaranAyumi WatanabePradip BajgainNorihiro Watanabe
Ulrike GerdemannAnastasia Papadopoulou
CollaboratorsDavid WheelerLinghua WangAdaptive Biotech.Marie GingrasBetty ChungArt Zieske
Clinical TeamRobert KranceGeorge CarrumRam KambleSwati NaikCarlos RamosStephen Gottschalk
Clinical ResearchBambi GrilleyBridget MedinaHao LiuMunu BilgiCatherine RobertsonElicia Casteneda
Acknowledgements