Embed Size (px)
Citation preview

73
CHAPTER 5. Tree Mortality
MarK J. aMbrose
INTRODUCTION
Tree mortality is a natural process in all forest ecosystems. Extremely high mortality, however, can also be an indicator of forest
health issues. On a regional scale, high mortality levels may indicate widespread insect or disease problems. High mortality may also occur if a large proportion of the forest in a particular region is made up of older, senescent stands.
In early Forest Health Monitoring (FHM) national reports (2001–04), mortality was analyzed using FHM and Forest Inventory and Analysis (FIA) phase 3 data. Those data spanned a relatively long period (for some States, up to 12 years), but the sample was not spatially intense (approximately 1 plot per 96,000 acres). In the 2007 FHM national report (Ambrose 2011), the same method was applied to FIA phase 2 (P2) data, which were more spatially intense (approximately 1 plot per 6,000 acres) but came from the relatively small number of States in the Eastern United States where repeated plot measurements had been taken. In the 2008 through 2011 reports, the method was applied to successively larger areas, using increasing numbers of plots. For this report, the repeated P2 data cover much of the Central and Eastern United States, and for some States include data from a third cycle of measurements (i.e., a third measurement of the plots).
The mission of FHM is to monitor, assess, and report on the status, changes, and long-term trends in forest ecosystem health in the United States (USDA Forest Service, Forest
Health Monitoring Program 1994). Thus, the aim of this mortality analysis contrasts with how mortality might be approached in other reports, such as FIA State reports or State Forest Health Highlights. The approach to mortality presented here seeks to detect mortality patterns that might reflect subtle changes to fundamental ecosystem processes (due to such large-scale factors as air pollution, global climate change, or fire-regime change) that transcend individual tree species-pest/pathogen interactions. Sometimes, however, the proximate cause of mortality may be discernable. In such cases, the cause of mortality is reported, both because it is of interest in and of itself to many readers and because understanding such proximate causes of mortality might provide insight into whether the mortality is within the range of natural variation or reflects more fundamental changes to ecological processes.
At this point, a mortality baseline is still being established for most of the United States. To discern trends in mortality rates, at least three complete cycles of FIA data are required. With the data currently available, it is only possible to do a spatial comparison of ecoregions and identify regions of higher than average mortality (relative to growth) for further study.
DATAFIA P2 inventory data are collected using
a rotating panel sample design (Bechtold and Patterson 2005). Field plots are divided into spatially balanced panels, with one panel being measured each year. A single cycle of

SECT
ION
1 C
hapte
r 5
Table 5.1—States from which repeated Forest Inventory and Analysis phase 2 measurements were available, the time period spanned by the data, and the effective sample intensity (based on plot density and on proportion of plots that had been remeasured) in the available datasets
Time period States Effective sample intensity
Proportion of plots measured three times
1999–2010 IN, MO 1 plot per 6,000 acresa 1/51999–2010 MN, WI 1 plot per 3,000 acresb 1/51999–2010 ME 1 plot per 6,000 acres 2/52000–2011 IA 1 plot per 6,000 acres 2/52000–2010 MI 1 plot per 2,727 acresc 1/112000–2010 AR, PA 1 plot per 6,000 acres 1/52000–2010 VA 1 plot per 7,500 acres 02001–2011 AL 1 plot per 7,000 acres 02001–2011 TXd 1 plot per 6,000 acres 3/5
2001–2010 GA, IL, KS, NE, ND, SD, TN 1 plot per 6,000 acrese 0
2001–2010 OH 1 plot per 7,500 acres 02002–2010 KY, SC 1 plot per 7,500 acres 02002–2010 NH, NY 1 plot per 10,000 acres 02002–2010 FL 1 plot per 15,000 acres 02003–2010 CT, MA, VT 1 plot per 10,000 acres 02003–2010 RI 1 plot per 5,000 acresb 02003–2010 NC 1 plot per 21,000 acres 02004–2010 DE 1 plot per 7,500 acresb 02004–2010 MD, NJ, WV 1 plot per 15,000 acres 0
a In Indiana and Missouri, the phase 2 (P2) inventory was done at twice the standard Forest Inventory and Analysis (FIA) sample intensity, approximately 1 plot per 3,000 acres, on national forest lands and at the standard intensity, 1 plot per 6,000 acres, on all other lands.b In Delaware, Minnesota, Rhode Island, and Wisconsin, the P2 inventory was done at twice the standard FIA sample intensity, approximately 1 plot per 3,000 acres.c In Michigan, the P2 inventory was done at triple the standard FIA sample intensity, approximately one plot per 2,000 acres, for three of the five inventory panels.d Annualized growth and mortality data were only available for eastern Texas.e In Illinois, the P2 inventory was done at triple the standard FIA sample intensity, approximately 1 plot per 2,000 acres, on national forest lands and at the standard intensity on all other lands.
Fores
t Hea
lth M
onito
ring
74
measurements consists of measuring all panels. This “annualized” method of inventory was adopted, State by State, beginning in 1999. Any analysis of mortality requires data collected at a minimum of two points in time from any given plot. Therefore, mortality analysis was possible for areas where data from repeated plot measurements using consistent sampling protocols were available (i.e., where one cycle of measurements had been completed and at least one panel of the next cycle had been measured, and where there had been no changes to the protocols affecting measurement of trees or saplings). Once all P2 plots have been remeasured in a State, mortality estimates generally will be based on a sample intensity of approximately 1 plot per 6,000 acres of forest. 1 At this time, however, not all plots have been remeasured in all the States included in this analysis. When not all plots have been remeasured, mortality estimates are based on a lower effective sample intensity. Table 5.1 shows the 34 States from which consistent repeated P2 measurements were available, the period spanned by the data, and the effective sample intensity. Additional measurements of any plot, beyond the minimum of two required for a single mortality estimate, improve the mortality estimate. At present, third plot measurements have been taken in some States (table 5.1). The States included in this analysis as well as and the forest cover within those States are shown in figure 5.1.
1 In some States, more intensive sampling has been implemented. See table 5.1 for details.

75
Figure 5.1—Forest cover in the States where mortality was analyzed. Forest cover was derived from Advanced Very High Resolution Radiometer satellite imagery (Zhu and Evans 1994).
Forest coverStates included in mortality analysis

SECT
ION
1 C
hapte
r 5Fo
rest H
ealth
Mon
itorin
g
76
Because the data used here are collected using a rotating panel design and all available annualized data are used, most of the data used in this mortality analysis were also used in the analysis presented in the previous FHM national report. Using the data in this way, it would be very unusual to see any great changes in mortality patterns from one annual report to the next. It is important nevertheless to look at mortality patterns every year so as not to miss detecting mortality patterns that may be indicative of forest health problems as soon as they may become discernible.
METHODSFIA P2 tree (≥5 inches d.b.h) and sapling
(1 inch ≥ d.b.h. > 5 inches) data were used to estimate average annual tree mortality in terms of tons of biomass per acre. The data were obtained from the public FIA Database - version 5.1 (USDA Forest Service, Forest Inventory and Analysis Program 2012). The biomass represented by each tree was calculated by FIA and provided in the FIA Database (USDA Forest Service, Forest Inventory and Analysis program 2011). To compare mortality rates across forest types and climate zones, the ratio of annual mortality to gross growth (MRATIO) is used as a standardized mortality indicator (Coulston and others 2005a). Gross growth rate and mortality rate, in terms of tons of biomass per acre, were independently calculated for each ecoregion section (Cleland and others 2007, McNab and others 2007) using a mixed modeling procedure, wherein plot-to-plot variability is considered a random effect and time is a fixed effect. The
mixed modeling approach has been shown to be particularly efficient for estimation using data in which not all plots have been measured over identical time intervals (Gregoire and others 1995). In the estimation procedure, within-plot temporal correlation was based on a covariance matrix modeled using a Toeplitz matrix. MRATIOs were then calculated from the growth and mortality rates. For details on the method, see appendix A—Supplemental Methods in the Forest Health Monitoring 2001 National Technical Report (Coulston and others 2005b) and appendix A—Supplemental Methods in the Forest Health Monitoring 2003 National Technical Report (Coulston and others 2005c).
In addition, the ratio of average dead tree diameter to average surviving live tree diameter (DDLD ratio) was calculated for each plot where mortality occurred. Low DDLD ratios (much < 1) usually indicate competition-induced mortality typical of young, vigorous stands, and high ratios (much > 1) indicate mortality associated with senescence or some external factors such as insects, disease, or severe drought stress (Smith and Conkling 2004). Intermediate DDLD ratios can be hard to interpret because a variety of stand conditions can produce such DDLD values. The DDLD ratio is most useful for analyzing mortality in regions that also have high MRATIOs. High DDLD values in regions with very low MRATIOs may indicate small areas experiencing high mortality of large trees or locations where the death of a single large tree (such as a remnant pine in a young hardwood stand) has produced a deceptively high DDLD.

77
To further analyze tree mortality, the number of stems and the total biomass of trees that died also were calculated by species within each ecoregion. Identifying the tree species experiencing high mortality in an ecoregion is a first step in identifying what forest health issue may be affecting the forests. Although determining particular causal agents associated with all the observed mortality is beyond the scope of this report, often there are well-known insects and pathogens that are “likely suspects” once the affected tree species are identified.
A biomass-weighted mean mortality age was also calculated by ecoregion and species. For each species experiencing mortality in an ecoregion, the mean stand age was calculated, weighted by the dead biomass on the plot. This value gives a rough indicator of the average age of the stands in which trees died. The age of individual trees may differ significantly, however, from the age assigned to a stand by FIA field crews, especially in mixed-species stands. When the age of trees that die is relatively low compared with the age at which trees of a particular species usually become senescent, it suggests that some pest, pathogen, or other forest health problem may be affecting the forest.
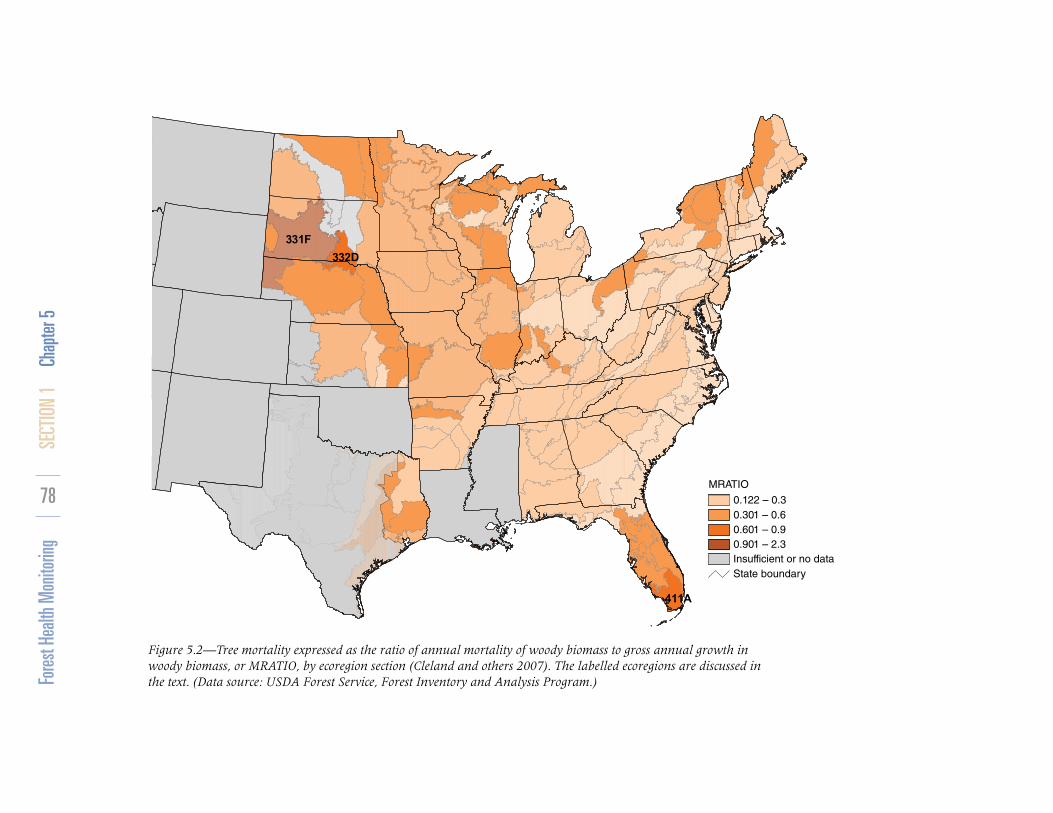
RESULTS AND DISCUSSIONThe MRATIO values are shown in figure 5.2.
The MRATIO can be large if an over-mature forest is senescing and losing a cohort of older trees. If forests are not naturally senescing, a high MRATIO (>0.6) may indicate high
mortality due to some acute cause (insects or pathogens) or due to generally deteriorating forest health conditions. An MRATIO value >1 indicates that mortality exceeds growth, and live standing biomass is actually decreasing.
The highest MRATIO occurred in ecoregion section 331F-Western Great Plains (MRATIO = 1.47) in South Dakota and Nebraska, where mortality actually exceeded growth. Other areas of high mortality relative to growth were sections 332D-North-Central Great Plains, also in South Dakota and Nebraska (MRATIO = 0.65), and 411A-Everglades in Florida (MRATIO = 0.86). Table 5.2 shows the tree species experiencing the greatest mortality in those ecoregions.
The results of the analysis of the relative sizes of trees that died to those that lived, the DDLD ratio, are shown in table 5.3. The DDLD ratio is a plot-level indicator, so I obtained summary statistics for the ecoregions where mortality relative to growth was highest. In all cases the mean and median DDLDs were rather close to 1, meaning that the trees that died were similar in size to the trees that survived. However, there were some plots with extremely high DDLD values. Interestingly, the same pattern of mean and median DDLD close to 1 and some high DDLD values was observed in nearly all ecoregions, regardless of the overall mortality level.
In two of the ecoregion sections exhibiting highest mortality relative to growth (331F-Western Great Plains and 332D-North-
SECT
ION
1 C
hapte
r 5
MRATIO
0.301 – 0.60.601 – 0.90.901 – 2.3Insufficient or no dataState boundary
0.122 – 0.3
Fores
t Hea
lth M
onito
ring
78
Figure 5.2—Tree mortality expressed as the ratio of annual mortality of woody biomass to gross annual growth in woody biomass, or MRATIO, by ecoregion section (Cleland and others 2007). The labelled ecoregions are discussed in the text. (Data source: USDA Forest Service, Forest Inventory and Analysis Program.)

79
Table 5.2—Tree species responsible for at least 5 percent of the mortality (in terms of biomass) for ecoregions where the ratio of annual mortality to gross growth (MRATIO) was ≥ 0.60
Ecoregion section MRATIO Tree speciesPercent of total ecoregion
mortality biomassMean age ofdead treesa
Species percent mortality
Biomass Stems
331F-Western Great Plains 1.47
Ponderosa pine (Pinus ponderosa) 58.72 59 6.21 12.13Green ash (Fraxinus pennsylvanica) 20.53 42 19.82 19.36Eastern cottonwood (Populus deltoides) 5.38 85 3.96 3.33
332D-North-Central Great Plains 0.65
Bur oak (Quercus macrocarpa) 29.35 74 4.73 5.05Hackberry (Celtis occidentalis) 19.33 60 11.91 0.78Green ash (F. pennsylvanica) 15.26 77 13.21 17.32Ponderosa pine (Pinus ponderosa) 10.91 59 8.17 31.58American elm (Ulmus americana) 9.61 57 7.67 9.76Boxelder (Acer negundo) 6.78 53 49.28 40.00Eastern redcedar (Juniperus virginiana) 5.35 43 2.70 5.04
411A-Everglades 0.86
Slash pine (Pinus elliotii) 61.28 22 19.80 45.58Pondcypress (Taxodium ascendens) 15.70 22 5.58 6.78Red maple (A. rubrum) 8.53 55 39.82 4.69Melaleuca (Melaleuca quinquenervia) 5.22 16 28.83 59.51
a Ages are estimated from the stand age as determined by the Forest Inventory and Analysis field crew. It is possible, especially in mixed-species stands, that the age of individual trees that died differed significantly from the stand age.
Table 5.3—Dead diameter live diameter ratios for ecoregion sections where the ratio of annual mortality to gross growth (MRATIO) was ≥ 0.60
Ecoregion section Mean DDLD
Maximum DDLD
Median DDLD
Minimum DDLD
331F-Western Great Plains 0.97 3.29 0.91 0.08332D-North-Central Great Plains 0.89 1.83 0.96 0.29411A-Everglades 1.23 3.63 1.18 0.11
DDLD = dead diameter live diameter.
Central Great Plains), the predominant vegetation is grassland (see the forest cover in fig. 5.1), and there were relatively few forested plots measured (92 plots in region 331F and 52 plots in region 332D). Tree growth rates in these regions (especially in 331F) are quite low, so the high MRATIOs are due to a combination of low growth and high mortality. Much of the forest in these sections is riparian forest, and, indeed, most of the species experiencing greatest mortality (table 5.2) are commonly found in riparian areas. The one exception was high ponderosa pine mortality in ecoregion section 331F-Western Great Plains. Ponderosa pine is

SECT
ION
1 C
hapte
r 5Fo
rest H
ealth
Mon
itorin
g
80
not a riparian species, but like the riparian tree species, it only occurs in a relatively small area of the ecoregion; it occurs only on discontinuous mountains, plateaus, canyons, and breaks in the plains (Burns and Honkala 1990a).
DDLD values vary widely within each of these sections. There is a small number of plots with high DDLDs, and these plots represent most of the biomass that died in these sections. However, on many of these plots the overall level of mortality is relatively low, as would be the case when remnant larger trees die, leaving young, vigorous stands behind. Tree growth is generally slow in these ecoregion sections because of naturally dry conditions. Where the number of sample plots is small and tree growth is slow, care must be taken in interpreting mortality relative to growth over short time intervals.
In ecoregion section 331F-Western Great Plains, where the MRATIO was highest (MRATIO = 1.47), by far the largest amount of biomass that died was ponderosa pine (table 5.2); however, this represented a relatively small proportion of the ponderosa pine in the ecoregion. This pine mortality may be related to mountain pine beetle (Dendroctonus ponderosae). There was an ongoing pine beetle outbreak in the adjacent Black Hills (South Dakota Department of Agriculture 2011), and mountain pine beetle mortality was reported in western Nebraska (Nebraska Forest Service 2011). Green ash, which made up only half as much of the ecoregion mortality as ponderosa pine, suffered a much larger loss of the total ash stock (about 20 percent of both biomass and stems). This
suggests that ash may have suffered from much more serious forest health issues than pine in this ecoregion.
In ecoregion section 332D-North-Central Great Plains, five species experienced the highest total mortality in terms of biomass and together represent about 75 percent of the mortality in the ecoregion: bur oak, hackberry, green ash, and ponderosa pine, (table 5.21 ). Of these, hackberry and green ash suffered the greatest proportional loss of biomass (11.91 and 13.21 percent, respectively). The relatively high mean age of the dead trees suggests that the mortality is at least partially due to senescence of older stands. In the case of hackberry, the mortality in terms of biomass (11.91 percent) was much higher than the mortality in terms of number of stems (0.78 percent), which means that the trees that died were a relatively small number of very large trees. Three other species, American elm, boxelder, and eastern redcedar account for an additional 22 percent of the mortality in the ecoregion. Of these, boxelder suffered extremely high relative mortality (49.28 percent of biomass and 40.00 percent of stems). The average age of the dead boxelder was 53 years, while the species on average only live to about 60 (Burns and Honkala 1990b), so, again, the species mortality is likely related to senescence of older stands.
1 The species mortality values reported for ecoregion 332D-North-Central Great Plains are exactly the same as those reported in the 2011 Forest Health Monitoring national report. This ecoregion is mostly grassland. There were only three additional forested plots in the additional year of data included in this year’s analysis, and no mortality occurred on those plots.

81
One might be tempted to suspect the invasive emerald ash borer as the cause of the ash mortality in sections 331F–Western Great Plains and 332D-North-Central Great Plains. However, this insect pest had not yet been reported in or near these regions (USDA Forest Service and others, N.d.; Nebraska Forest Service 2011).
Although it has a very different climate, ecoregion 411A-Everglades, like the plains ecoregions previously discussed, contains a relatively small proportion of forest (only 41 forested plots for the analysis). Most of the ecoregion is a grassland that is flooded for much of the year. Trees in the ecoregion only occur on hardwood hammocks, “upland” pine forest, cypress swamps, and coastal mangrove forests. The two tree species representing most of the mortality in the Everglades, slash pine and pondcypress, occur in different ecosystems within the ecoregion, so very different factors are likely responsible for the mortality. The species having the highest mortality was slash pine, representing 61 percent of the mortality (by biomass) in the ecoregion. About 46 percent of slash pine stems died, but only 20 percent of the slash pine biomass died. The mean stand age of the dead trees was relatively low (22 years), so much of the mortality was smaller, younger trees, and might be competition-induced. Researchers in Florida are investigating southern pine beetle, which affects slash pine. However, these research and monitoring efforts are focused in northern Florida, not in most of the area identified here as experiencing high mortality (Florida Department of Agriculture
and Consumer, Division of Forestry 2010). Pondcypress represented about 16 percent of the mortality in the region. This mortality also occurred in relatively young stands (average of 22 years old). No particular pondcypress forest health issues have been reported.
Red maple accounted for about 9 percent of the mortality in the Everglades. The red maple stands with mortality were older than those of pine or cypress (55 years). About 5 percent of red maples stems died, but they represented about 40 percent of the red maple biomass, so larger, older red maple trees were dying.
One of the species having high mortality in the Everglades is melaleuca. This is an invasive exotic species that has created ecological problems in south Florida. Two insects were introduced into Florida in 1997 and 2002 as biological control agents for melaleuca. Research indicates that these insects have resulted in melaleuca mortality and reduced seed production (Tipping and others 2009, 2012). The observed melaleuca mortality is likely due to these introduced insects, and, in this case, increased mortality is a positive development.
The mortality patterns shown in these analyses do not immediately suggest large-scale forest health issues. Mortality is rather low in most of the areas for which data are available. The areas of highest mortality occur in the mostly riparian forests of Great Plains ecoregions. A common characteristic of all the ecoregions having high mortality is that they are on the margins of land suitable for forest

SECT
ION
1 C
hapte
r 5Fo
rest H
ealth
Mon
itorin
g
82
growth, being mostly very dry (Great Plains ecoregions) or very wet (the Everglades). As a result, the implications of the high mortality are unclear. Trees growing in these marginal situations may be especially susceptible to new or changed biotic or abiotic stressors. Yet, because of the small number of forested plots used to analyze these ecoregions, the mortality may be due to highly localized phenomena. Therefore, further study of the health of these forests may be warranted.
LITERATURE CITEDAmbrose, M.J. 2013. Mortality. In: Potter, K.M.; Conkling,
B.L., eds. Forest Health Monitoring: national status, trends, and analysis 2011. Gen. Tech. Rep. SRS-185. Asheville, NC: U.S. Department of Agriculture Forest Service, Southern Research Station: 59-68.
Ambrose, M.J. 2011.Mortality. In: Ambrose, M.J.; Conkling, B.L., eds. Forest Health Monitoring 2007 national technical report. Gen. Tech. Rep. SRS-147. Asheville, NC: U.S. Department of Agriculture Forest Service, Southern Research Station: 97-105.
Bechtold, W.A.; Patterson, P.L., eds. 2005. The enhanced Forest Inventory and Analysis program—national sampling design and estimation procedures. Gen. Tech. Rep. SRS-80. Asheville, NC: U.S. Department of Agriculture Forest Service, Southern Research Station. 85 p.
Burns, R.M.; Honkala, B.H. 1990a. Silvics of North America: 1, conifers. Agric. Handb. 654. Washington, DC: U.S. Department of Agriculture Forest Service. 675 p.
Burns, R.M.; Honkala, B.H. 1990b. Silvics of North America: 2, hardwoods. Agric. Handb. 654. Washington, DC: U.S. Department of Agriculture Forest Service. 877 p.
Cleland, D.T.; Freeouf, J.A.; Keys, J.E., Jr. [and others]. 2007. Ecological subregions: sections and subsections for the conterminous United States. 1:3,500,000; Albers equal area projection; colored. In: Sloan, A.M., tech. ed. Gen. Tech. Rep. WO-76. Washington, DC: U.S. Department of Agriculture Forest Service. Also as a GIS coverage in ArcINFO format on CD-ROM or at http://fsgeodata.fs.fed.us/other_resources/ecosubregions.html. [Date accessed: March 18, 2011].
Coulston, J.W.; Ambrose, M.J.; Stolte, K.S. [and others]. 2005a. Criterion 3—health and vitality. In: Conkling, B.L.; Coulston, J.W.; Ambrose, M.J., eds. Forest Health Monitoring 2001 national technical report. Gen. Tech. Rep. SRS-81. Asheville, NC: U.S. Department of Agriculture Forest Service, Southern Research Station. 203 p.
Coulston, J.W.; Smith, W.D.; Ambrose, M.J. [and others]. 2005b. Appendix A—supplemental methods. In: Conkling, B.L.; Coulston, J.W.; Ambrose, M.J., eds. Forest Health Monitoring 2001 national technical report. Gen. Tech. Rep. SRS-81. Asheville, NC: U.S. Department of Agriculture Forest Service, Southern Research Station. 203 p.
Coulston, J.W.; Ambrose, M.J.; Riitters, K.H. [and others]. 2005c. Appendix A—supplemental methods. In: Forest Health Monitoring 2003 national technical report. Gen. Tech. Rep. SRS-85. Asheville, NC: U.S. Department of Agriculture Forest Service, Southern Research Station. 97 p.
Florida Department of Agriculture and Consumer Services, Division of Forestry. 2010. Florida forest health highlights 2010. 3 p. http://fhm.fs.fed.us/fhh/sregion.shtml. [Date accessed: June 2, 2012].
Gregoire, T.G.; Schabenberger, O.; Barret, J.P. 1995. Linear modeling of irregularly spaced, unbalanced, longitudinal data from permanent plot measurements. Canadian Journal of Forest Research. 25: 137 156.
McNab, W.H.; Cleland, D.T.; Freeouf, J.A. [and others], comps. 2007. Description of ecological subregions: sections of the conterminous United States [CD-ROM]. Gen. Tech. Rep. WO-76B. Washington, DC: U.S. Department of Agriculture Forest Service. 80 p.

83
Nebraska Forest Service. 2011. Nebraska forest health highlights 2011. 5 p. http://fhm.fs.fed.us/fhh/ncregion.shtml. [Date accessed: June 1, 2012].
Smith, W.D.; Conkling, B.L. 2004. Analyzing forest health data. Gen. Tech. Rep. SRS-77. Asheville, NC: U.S. Department of Agriculture Forest Service, Southern Research Station. 35 p.
South Dakota Department of Agriculture. 2011. South Dakota forest health highlights 2011. Pierre, SD: South Dakota Department of Agriculture, Division of Resource Conservation and Forestry. 4 p. http://fhm.fs.fed.us/fhh/ncregion.shtml/. [Date accessed: June 1, 2012].
Tipping , P.W.; Martin, M.R.; Nimmoa, K.R. [and others]. 2009. Invasion of a West Everglades wetland by Melaleuca quinquenervia countered by classical biological control. Biological Control. 38: 73-78.
Tipping , P.W.; Martin, M.R.; Pierce, R. [and others]. 2012. Post-biological control invasion trajectory for Melaleuca quinquenervia in a seasonally inundated wetland. Biological Control. 60: 163-168.
U.S. Department of Agriculture (USDA) Forest Service, Forest Health Monitoring program. 1994. Forest Health Monitoring: a national strategic plan. Research Triangle Park, NC: U.S. Department of Agriculture Forest Service, Forest Health Monitoring program. 13 p.
U.S. Department of Agriculture (USDA) Forest Service, Forest Inventory and Analysis program. 2011. The forest inventory and analysis database: database description and users manual version 5.1 for phase 2. Washington: U.S. Department of Agriculture Forest Service. http://fia.fs.fed.us/library/database-documentation/. [Date accessed: April 4].
U.S. Department of Agriculture (USDA) Forest Service, Forest Inventory and Analysis program. 2012. FIA DataMart FIADB version 5.1 (Online database). Washington: U.S. Department of Agriculture Forest Service. http://apps.fs.fed.us/fiadb-downloads/datamart.html/. [Date accessed: March 27].
U.S. Department of Agriculture (USDA) Forest Service; Michigan State University; Purdue University; Ohio State University. [N.d.]. Emerald ash borer: Where is EAB? http://www.emeraldashborer.info/surveyinfo.cfm.[Date accessed: June 29, 2011].
Zhu, Z.; Evans, D.L. 1994. U.S. forest types and predicted percent forest cover from AVHRR data. Photogrammetric Engineering and Remote Sensing. 60: 525-531.