Embed Size (px)
Citation preview

Chapter 1
Introduction
Jan M. Rabaey
Introduction
Slide 1.1
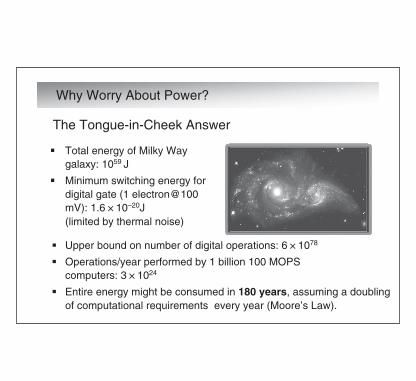
Why Worry About Power?
Total energy of Milky Way galaxy: 1059 J
Minimum switching energy for digital gate (1 electron@100mV): 1.6 × 10⁻²⁰J (limited by thermal noise)
Upper bound on number of digital operations: 6 × 1078
Operations/year performed by 1 billion 100 MOPS computers: 3 × 1024
Entire energy might be consumed in 180 years, assuming a doublingof computational requirements every year (Moore’s Law).
The Tongue-in-Cheek Answer
Slide 1.2

Power: The Dominant Design Constraint (1)
Cost of large data centers solely determined by power bill …
Google Data Center, The Dalles, OregonGoogle Data Center, The Dalles, Oregon
Columbia River
8,000100,000
450,000
NY Times, June 06
400 Millions of Personal Computers worldwide (Year 2000)
-Assumed to consume 0.16 Tera (1012) kWh per year-Equivalent to 26 nuclear power plants
Over 1 Giga kWh per year just for cooling-Including manufacturing electricity
[Ref: Bar-Cohen et al., 2000]
Slide 1.3

Power: The Dominant Design Constraint
[Ref: R. Schmidt, ACEED’03]
Slide 1.4

[Ref: R. Yung, ESSCIRC’02]
Chip Architecture and Power Density
Integration of diverse functionality on SoC causes major variations in activity(and hence power density)
The past: temperature uniformity
Today: steep gradients
Temperature variations cause performance degradation –higher temperature means slower clock speed
Slide 1.5

Temperature Gradients (and Performance)
IBM PowerPC 4 temperature map
Hot spot:138 W/cm2
(3.6 x chip avg flux)
Glass ceramic substrate
SiC spreader (chip underneath spreader)
Copper hat (heat sink on top not shown)
[Ref: R. Schmidt, ACEED’03]
Slide 1.6
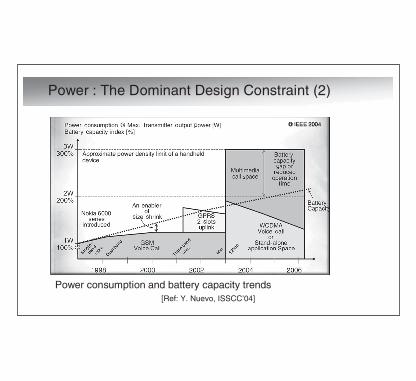
Power consumption and battery capacity trends[Ref: Y. Nuevo, ISSCC’04]
Power : The Dominant Design Constraint (2)
© IEEE 2004
Slide 1.7

[Ref: F. Snijders, Ambient Intelligence’05]
Slide 1.8

Battery Storage a Limiting Factor
Basic technology has evolved little– store energy using a chemical reaction
Battery capacity increases between 3% and 7% per year (doubled during the 1990s, relatively flat before that)
Energy density/size and safe handling are limiting factors
Energy density of material
kWh/kg
Gasoline 14
Lead-acid 0.04
Li polymer 0.15
For extensive information on energy density of various materials, check http://en.wikipedia.org/wiki/Energy_density
Slide 1.9

Battery Evolution
020406080
100120140160
1940 1950 1960 1970 1980 1990 2000 2010
First Commercial Use
Energy Density(Wh/kg)
Trend Line
Accelerated since the 1990s, but slower than IC power growth.
Li-ion
Slide 1.10

Battery Technology Saturating
Battery capacity naturally plateaus as systems develop
[Courtesy: M. Doyle, Dupont]
Slide 1.11

Need Higher Energy Density
Fuel cells may increase stored energy bymore than an order of magnitudeExample: Methanol = 5 kWh/kg
Ano
de
Ele
ctro
lyte
Cat
hode
+ ions
Load
e–
+–
Fue
l
2H2
4H+
+ 4
e–
Oxi
dant
O2
+ 4
H+
+ 4
e–2H
2O
H O
[Ref: R. Nowak, SECA’01]
Slide 1.12

Fuel CellsMethanol fuel cellsfor portable PCs and MP3 players
Fuel cell for PC (12 W avg – 24% effiency)
Fuel cell for portable MP3 player(300 mW from 10 mlreservoir)
Dur
atio
n [h
]
[Ref: Toshiba, 2003-2004]
Slide 1.13

Micro batteries: When Size Is an Issue
Battery printed on wireless sensor node
Using micro-electronics or thin-film manufacturing techniques to create integrated miniature (backup) batteries on chip or on board
Stencil press for printing patterns
[Courtesy: P. Wright, D. Steingart, UCB]
Slide 1.14
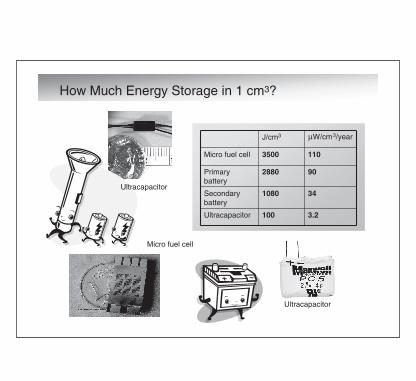
How Much Energy Storage in 1 cm3?
J/cm3 μW/cm3/year
Micro fuel cell 3500 110
Primary battery
2880 90
Secondary battery
1080 34
Ultracapacitor 100 3.2
Ultracapacitor
Micro fuel cell
Ultracapacitor
Slide 1.15

Power: The Dominant Design Constraint (3)
Exciting emerging applications requiring “zero-power”
Example: Computation/communication nodes
[Ref: J. Rabaey, ISSCC’01]
for wireless sensor networks
Meso-scale low-cost wireless transceivers for ubiquitous wireless data acquisition that• are fully integrated
– size smaller than 1 cm3
• are dirt cheap–at or below 1$
• minimize power/energy dissipation– limiting power dissipation to 100 μW
enables energy scavenging, and
• form self-configuring, robust, ad hoc networks containing 100s to 1000s of nodes
Slide 1.16
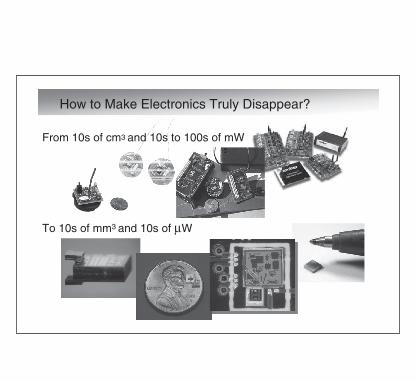
How to Make Electronics Truly Disappear?
From 10s of cm3 and 10s to 100s of mW
To 10s of mm3 and 10s of μW
Slide 1.17

Power: The Dominant Design Constraint
Exciting emerging applications requiring “zero-power”
Real-time Health Monitoring
Smart Surfaces
Artificial Skin
Philips Sand module
UCB mm3 radio
UCB PicoCube
Still at least one order of magnitude away
Slide 1.18

How Much Energy Can One Scavenge in 1 cm3?
Thermal
Air Flow
Solar
Vibrations
Slide 1.19
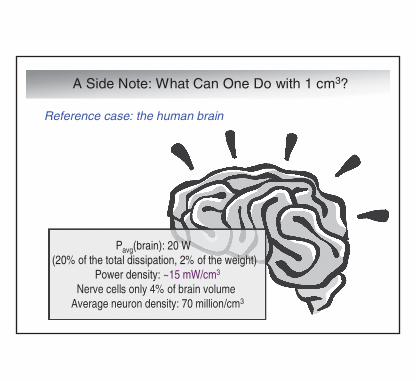
A Side Note: What Can One Do with 1 cm3?
Reference case: the human brain
Pavg(brain): 20 W (20% of the total dissipation, 2% of the weight)
Power density: ~15 mW/cm3
Nerve cells only 4% of brain volume Nerve cells only 4% of brain volume Average neuron density: 70 million/cmAverage neuron density: 70 million/cm33
Slide 1.20

Power Versus Energy
� Power in high-performance systems– Heat removal– Peak power and its impact on power delivery networks
� Energy in portable systems– Battery life
� Energy/power in “zero-power systems”– Energy-scavenging and storage capabilites
� Dynamic (energy) vs. static (power) consumption– Determined by operation modes
Slide 1.21
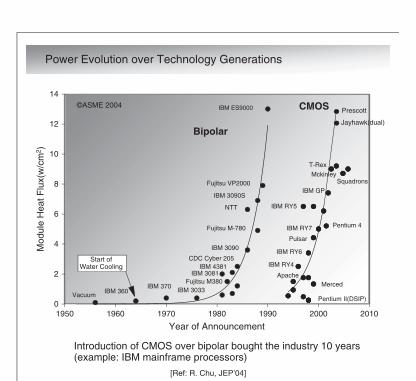
Power Evolution over Technology Generations
Introduction of CMOS over bipolar bought the industry 10 years(example: IBM mainframe processors)
[Ref: R. Chu, JEP’04]
Year of Announcement1950 1960 1970 1980 1990 2000 2010
Mod
ule
Hea
t Flu
x(w
/cm
2 )
0
2
4
6
8
10
12
14
Bipolar
CMOS
VacuumIBM 360
IBM 370IBM 3033
IBM ES9000
Fujitsu VP2000
IBM 3090S
NTT
Fujitsu M-780
IBM 3090
CDC Cyber 205IBM 4381
IBM 3081Fujitsu M380
IBM RY5
IBM GP
IBM RY6
Apache
Pulsar
Merced
IBM RY7
IBM RY4
Pentium II(DSIP)
T-Rex
Squadrons
Pentium 4
Mckinley
Start ofWater Cooling
Prescott
Jayhawk(dual)
©ASME 2004
Slide 1.22

Power Trends for ProcessorsP
ower
per
chi
p [W
]
1980 1985 1990 1995 20000.01
0.1
1
10
100
1000
Year[Ref: T. Sakurai, ISSCC’03]
MPU
x4 / 3
year
s
DSP
x1.4 / 3 years© IEEE 2003
Slide 1.23

PDYNAMIC k0.7
Proportional V scaling and short-channel devices
PDYNAMIC k0kk .7
Proportional V scaling andshort-channel devices
Power Density Trend for Processors
P = PDYNAMIC (+ PLEAK)
Scaling the Prime Reason!
Pow
er d
ensi
ty :
p [W
/cm
2 ]
0.1
1
10
100
1000
1 10
Design rule [µm]0.11
Scaling variable: k
k3
10000
k0.7
MPU DSP
Constant-voltage scalingand long-channel devices
PDYNAMIC k 3
Proportional-voltage scalingand short-channel devicest
P
© IEEE 2003
∝
∝
∝
DYNAMIC k 0.7∝
→→
[Ref: T. Sakurai, ISSCC’03]
Slide 1.24

Evolution of Supply Voltages in the Past
Minimum Feature Size (μm)10–11
0.5
1
1.5
2
2.5
3
3.5
4
4.5
5
Sup
ply
Vol
tage
(V
)
Supply voltage scaling only from the 1990s
Slide 1.25
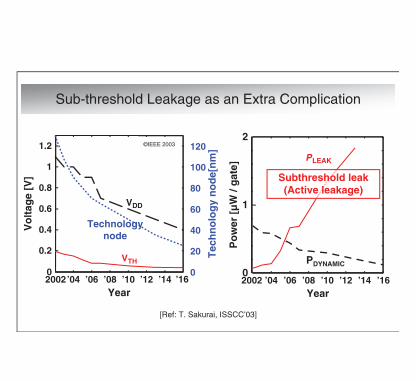
Sub-threshold Leakage as an Extra Complication
[Ref: T. Sakurai, ISSCC’03]
2002 ’04 ’06 ’08 ’10 ’12 ’14 ’160
1
2
Year
PDYNAMIC
P LEAK
Po
wer
[µ
W /
gat
e]
Subthreshold leak(Active leakage)
Year2002’04 ’06 ’08 ’10 ’12 ’14 ’160
0.2
0.4
0.6
0.8
1
1.2
0
20
40
60
80
100
120
Tec
hn
olo
gy
no
de[
nm
]
Vo
ltag
e [V
]
VTH
VDD
Technologynode
©IEEE 2003
Slide 1.26
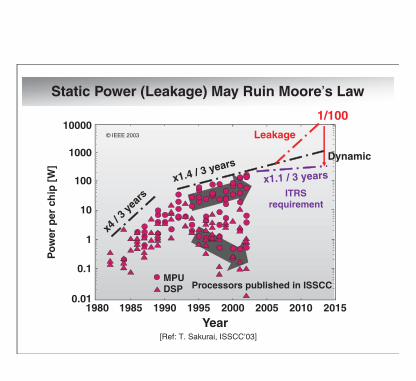
Static Power (Leakage) May Ruin Moore’s Law
Pow
er p
er c
hip
[W
]
1980 1985 1990 1995 20000.01
0.1
1
10
100
1000
Year
MPU
x4 / 3
year
s
DSP
x1.4 / 3 years
Processors published in ISSCC
2005 2010 2015
x1.1 / 3 years
ITRS requirement
10000
Dynamic
[Ref: T. Sakurai, ISSCC’03]
Leakage
1/100© IEEE 2003
Slide 1.27
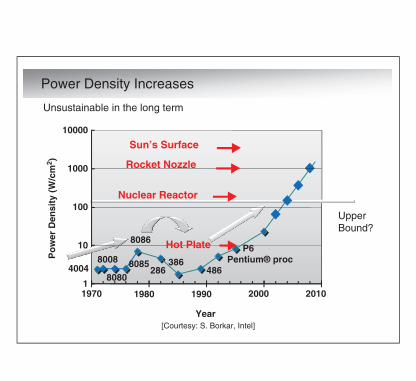
Power Density Increases
4004
20102000199019801970
8008
80808085
8086
286386
486Pentium® proc
P6
1
10
100
1000
10000
Year
Po
wer
Den
sity
(W
/cm
2 )
Hot Plate
Nuclear Reactor
Rocket Nozzle
Sun’s Surface
UpperBound?
Unsustainable in the long term
[Courtesy: S. Borkar, Intel]
Slide 1.28

Projecting into the Future
1
10
100
1000
2006 20082004 20162014 20202018 202220122010
Active power density: k
1.9
Leakage power density: k
2.7
Computing density: k
3
FD-SOI Dual Gate
Power density (active and static) accelerating anewTechnology innovations help, but impact limited
Slide 1.29

Complicating the Issue: The Diversity of SoCs
Power budgets of leading general purpose (MPU) and specialpurpose (ASSP) processors
[Ref: many combined sources]
Slide 1.30

Supply and Threshold Voltage Trends
VDD
VT
0
0.1
0.2
0.3
0.4
0.5
0.6
0.7
0.8
0.9
1
VDD /
VTH = 2
Voltage reduction projected to saturateOptimistic scenario – some claims exist that VDD may get stuck around 1 V
[Ref: ITRS 05, Low power scenario]
2006 20082004 20162014 20202018 202220122010
Slide 1.31

A 20 nm Scenario
Assume VDD = 1.2 VFO4 delay < 5 psAssuming no architectural changes, digital circuits couldbe run at 30 GHz Leading to power density of 20 kW/cm2 (??)
FO4 delay 10 ps
Reduce VDD to 0.6 V~~
The clock frequency is lowered to 10 GHzPower density reduces to
[Ref: S. Borkar, Intel]
5 kW/cm2 (still way too high)
Slide 1.32
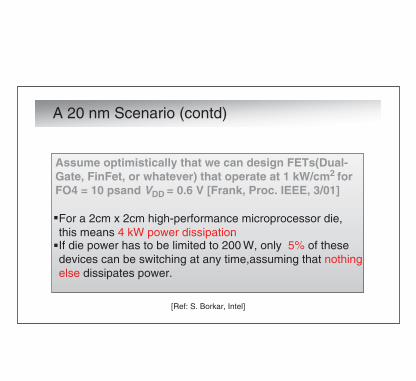
A 20 nm Scenario (contd)
Assume optimistically that we can design FETs(Dual-Gate, FinFet, or whatever) that operate at 1 kW/cm2 for FO4 = 10 psand VDD = 0.6 V [Frank, Proc. IEEE, 3/01]
For a 2cm x 2cm high-performance microprocessor die,this means 4 kW power dissipation.If die power has to be limited to 200 W, only 5% of thesedevices can be switching at any time,assuming that nothingelse dissipates power.
[Ref: S. Borkar, Intel]
Slide 1.33

An Era of Power-Limited Technology Scaling
Technology innovations offer some reliefDevices that perform better at low voltage without leaking toomuch
But also are adding major griefImpact of increasing process variations and various failuremechanisms more pronounced in low-power design regime
Most plausible scenarioCircuit- and system-level solutions essential to keeppower/energy dissipation in check Slow down growth in computational density and use theobtained slack to control power density increaseIntroduce design techniques to operate circuits atnominal, not worst-case, conditions
–
–
–
–
–
Slide 1.34
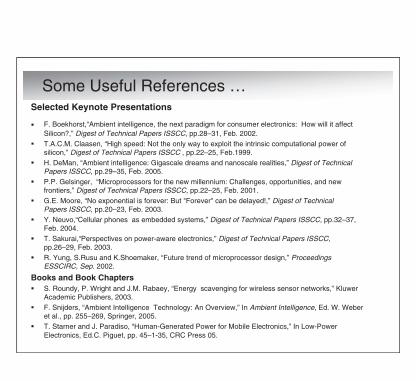
Some Useful References …Selected Keynote Presentations
F. Boekhorst,“Ambient intelligence, the next paradigm for consumer electronics: How will it affect Silicon?,” Digest of Technical Papers ISSCC, pp.28–31, Feb. 2002. T.A.C.M. Claasen, “High speed: Not the only way to exploit the intrinsic computational power of silicon,” Digest of Technical Papers ISSCC , pp.22–25, Feb.1999.H. DeMan, “Ambient intelligence: Gigascale dreams and nanoscale realities,” Digest of Technical Papers ISSCC, pp.29–35, Feb. 2005. P.P. Gelsinger, “Microprocessors for the new millennium: Challenges, opportunities, and new frontiers,” Digest of Technical Papers ISSCC, pp.22–25, Feb. 2001. G.E. Moore, “No exponential is forever: But "Forever" can be delayed!,” Digest of Technical Papers ISSCC, pp.20–23, Feb. 2003. Y. Neuvo,“Cellular phones as embedded systems,” Digest of Technical Papers ISSCC, pp.32–37, Feb. 2004.T. Sakurai,“Perspectives on power-aware electronics,” Digest of Technical Papers ISSCC, pp.26–29, Feb. 2003.R. Yung, S.Rusu and K.Shoemaker, “Future trend of microprocessor design,” Proceedings ESSCIRC, Sep. 2002.
Books and Book ChaptersS. Roundy, P. Wright and J.M. Rabaey, “Energy scavenging for wireless sensor networks,” KluwerAcademic Publishers, 2003.F. Snijders, “Ambient Intelligence Technology: An Overview,” In Ambient Intelligence, Ed. W. Weberet al., pp. 255–269, Springer, 2005. T. Starner and J. Paradiso, “Human-Generated Power for Mobile Electronics,” In Low-Power Electronics, Ed.C. Piguet, pp. 45–1-35, CRC Press 05.
Slide 1.35

Some Useful References (cntd)
PublicationsA. Bar-Cohen, S. Prstic, K. Yazawa and M. Iyengar. “Design and Optimization of Forced Convection Heat Sinks for Sustainable Development”, Euro Conference – New and Renewable Technologies for Sustainable Development, 2000.S. Borkar, numerous presentations over the past decade.R. Chu, “The challenges of electronic cooling: Past, current and future,”Journal of Electronic Packaging, 126, p. 491, Dec. 2004. D. Frank, R. Dennard, E. Nowak, P. Solomon, Y. Taur, and P. Wong, “Device scaling limits of SiMOSFETs and their application dependencies,” Proceedings of the IEEE, Vol 89 (3),pp. 259 –288, Mar. 2001.International Technology Roadmap for Semiconductors, http://www.itrs.net/J. Markoff and S. Hansell, “Hiding in Plain Sight, Google Seeks More Power”, NY Times, http://www.nytimes.com/2006/06/14/technology/14search.html? r=1&oref=slogin, June 2006..R. Nowak, “A DARPA Perspective on Small Fuel Cells for the Military,” presented at Solid State Energy Conversion Alliance (SECA) Workshop, Arlington, Mar. 2001.J. Rabaey et al. "PicoRadios for wireless sensor networks: the next challenge in ultra-low power design,”Proc. 2002 IEEE ISSCC Conference, pp. 200–201, San Francisco, Feb. 2002.R. Schmidt, “Power Trends in the Electronics Industry –Thermal Impacts,” ACEED03, IBM Austin Conference on Energy-Efficient Design, 2003.Toshiba, “Toshiba Announces World's Smallest Direct Methanol Fuel Cell With Energy Output of 100 Milliwatts,” http://www.toshiba.co.jp/about/press/2004_06/pr2401.htm, June 2004.
Slide 1.36