Embed Size (px)
Citation preview
Introduction Biostatistics Analysis:
Lecture 1
Definitions and Data Collection
Lecture Goals
After completing this chapter, you should be able to:
• Describe key data collection methods
• Know key definitions:Population vs. Sample Primary vs. Secondary data types
Qualitative vs. Qualitative data Time Series vs. Cross-Sectional data
• Explain the difference between descriptive and
inferential statistics
• Describe different sampling methods
• Descriptive statistics–Collecting, presenting, and describing
data
• Inferential statistics–Drawing conclusions and/or making
decisions concerning a population based only on sample data
Tools of Statistics
Descriptive Statistics
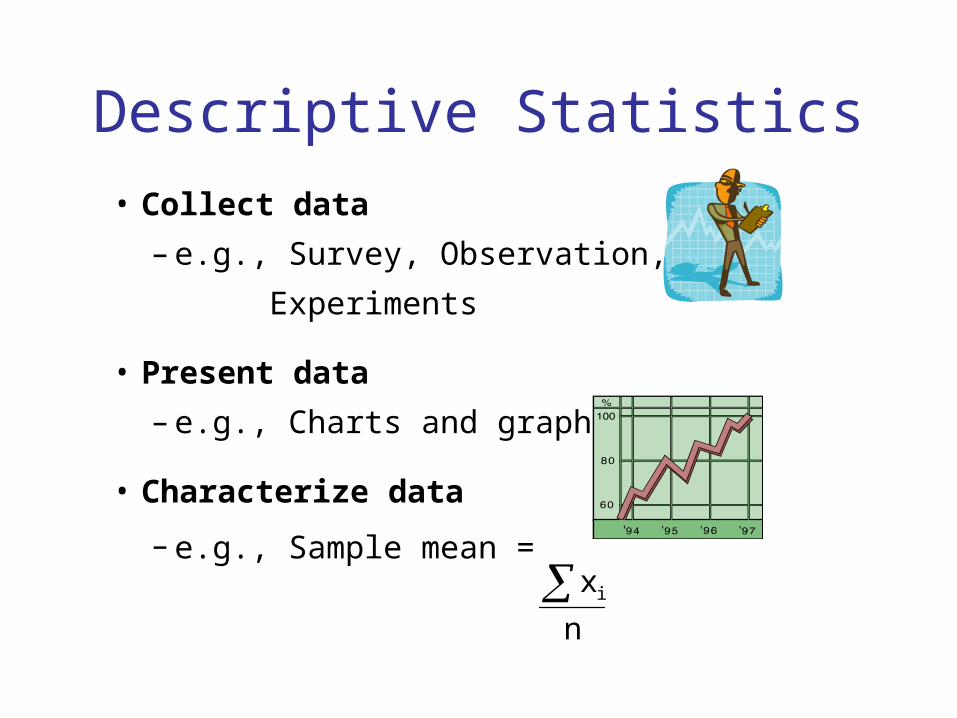
• Collect data
– e.g., Survey, Observation,
Experiments
• Present data
– e.g., Charts and graphs
• Characterize data
– e.g., Sample mean = n
x i
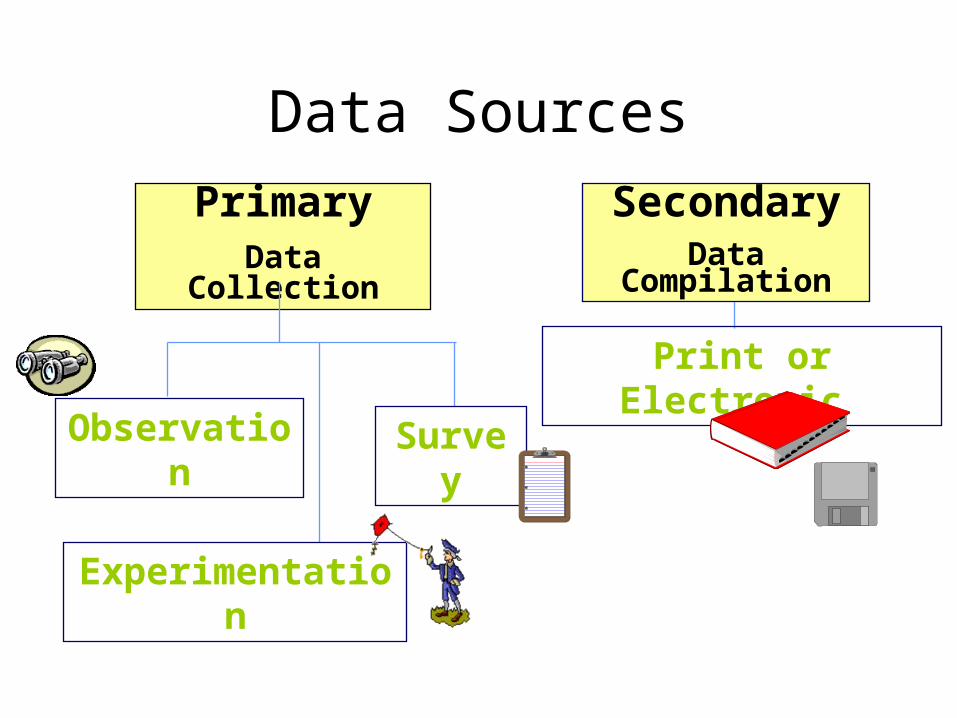
Data Sources
PrimaryData Collection
SecondaryData Compilation
Observation
Experimentation
Survey
Print or Electronic
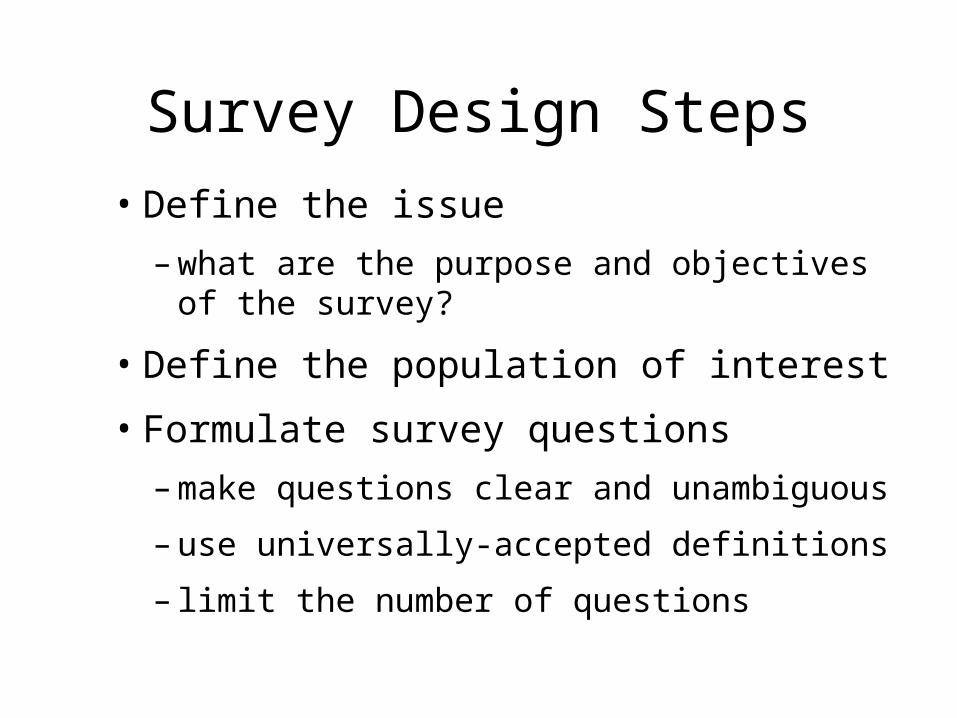
Survey Design Steps
• Define the issue
– what are the purpose and objectives of the survey?
• Define the population of interest
• Formulate survey questions
– make questions clear and unambiguous
– use universally-accepted definitions
– limit the number of questions
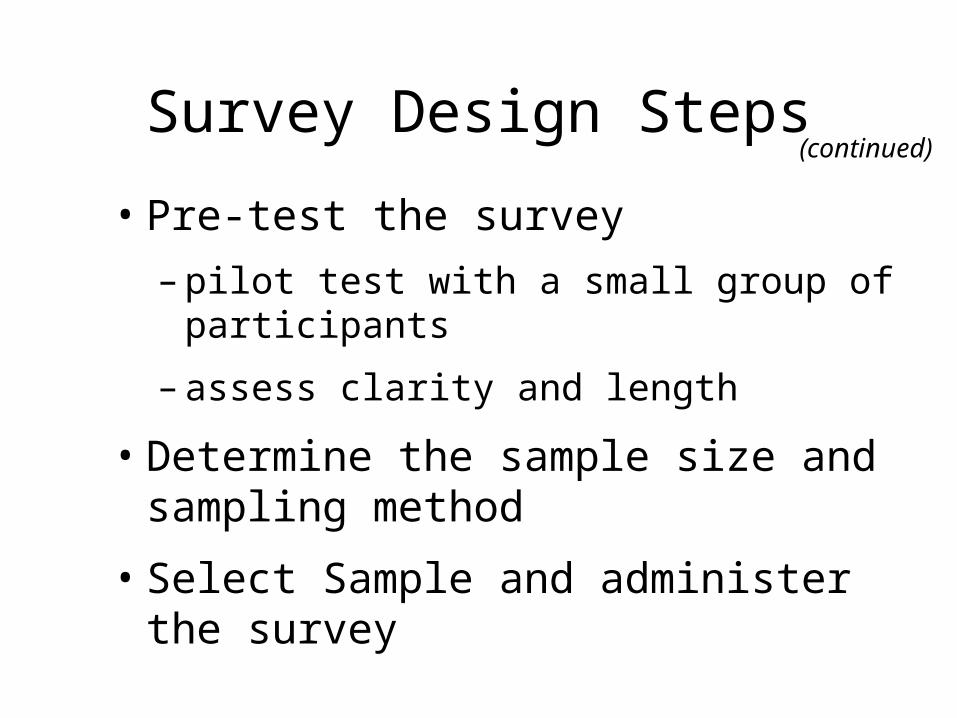
Survey Design Steps
• Pre-test the survey
– pilot test with a small group of participants
– assess clarity and length
• Determine the sample size and sampling method
• Select Sample and administer the survey
(continued)
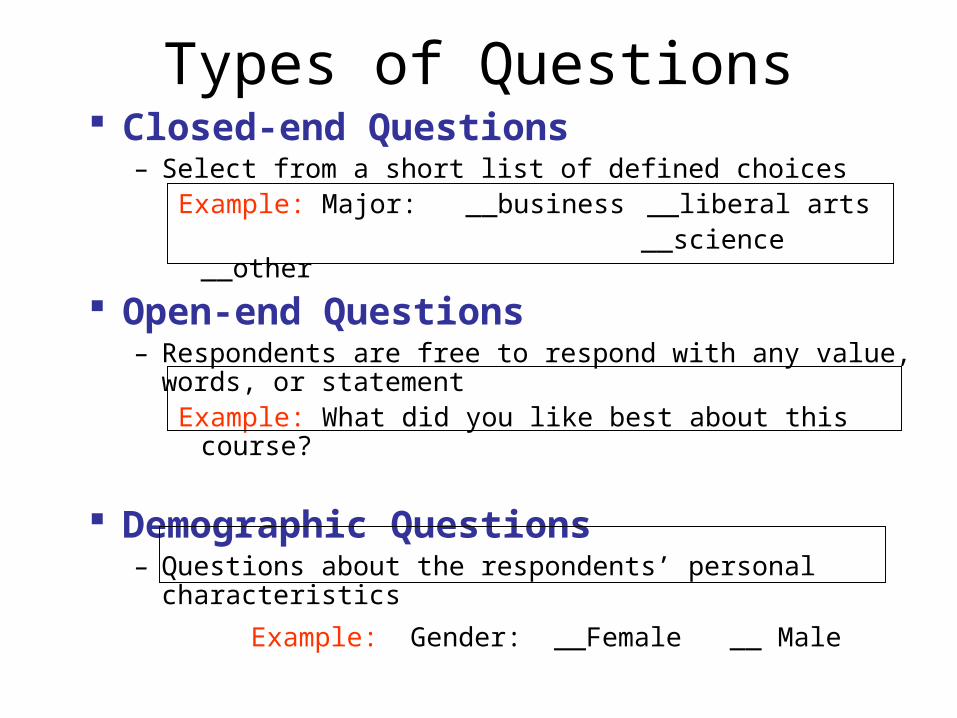
Types of Questions Closed-end Questions
– Select from a short list of defined choicesExample: Major: __business __liberal arts __science __other
Open-end Questions– Respondents are free to respond with any value, words, or
statementExample: What did you like best about this course?
Demographic Questions– Questions about the respondents’ personal characteristics
Example: Gender: __Female __ Male
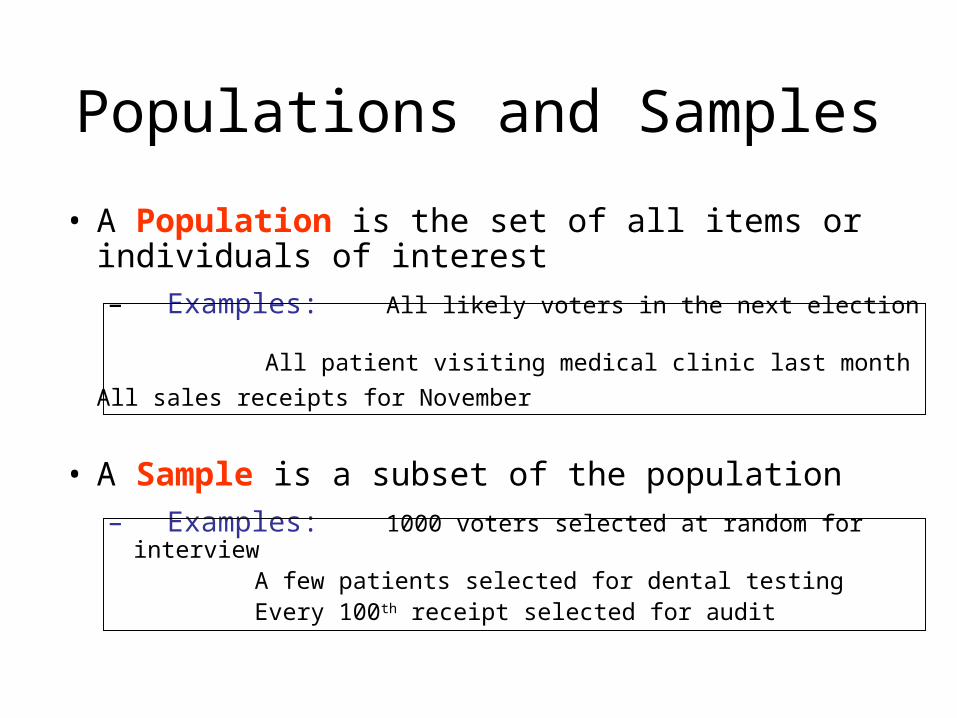
• A Population is the set of all items or individuals of interest– Examples: All likely voters in the next election
All patient visiting medical clinic last month
All sales receipts for November
• A Sample is a subset of the population– Examples: 1000 voters selected at random for interview
A few patients selected for dental testing
Every 100th receipt selected for audit
Populations and Samples
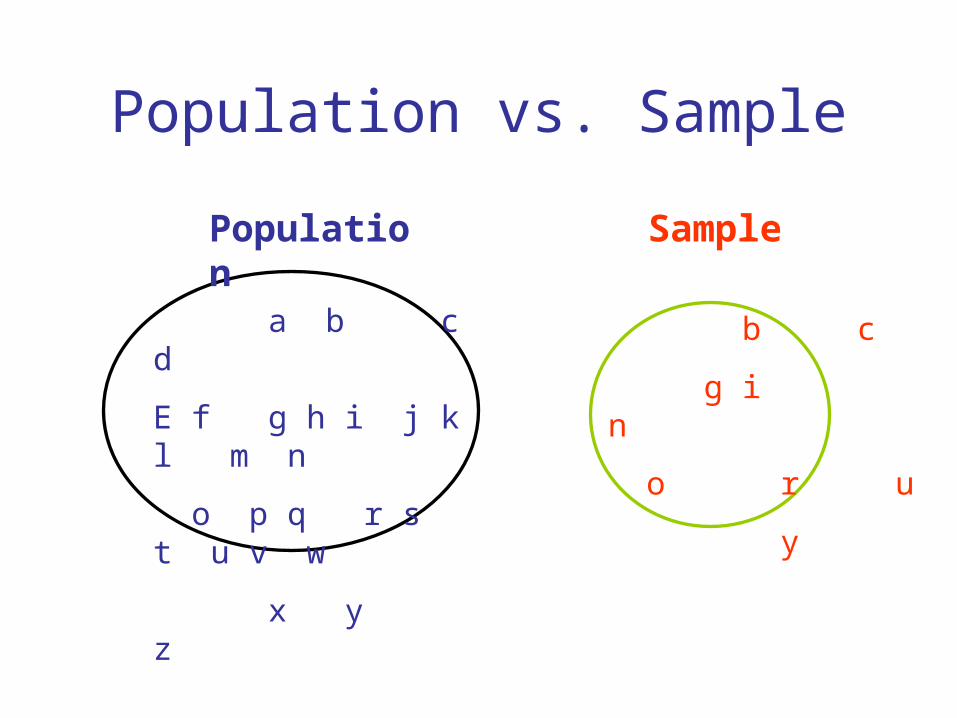
Population vs. Sample
a b c d
E f g h i j k l m n
o p q r s t u v w
x y z
Population Sample
b c
g i n
o r u
y
Why Sample?
• Less time consuming than a census
• Less costly to administer than a census
• It is possible to obtain statistical results of a sufficiently high precision based on samples.
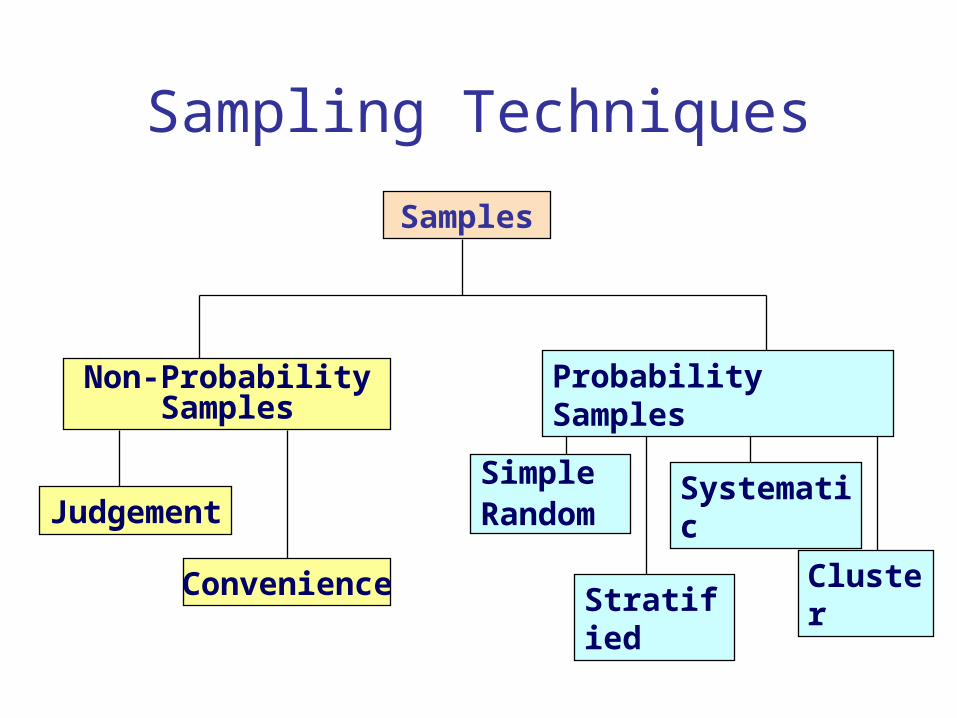
Sampling Techniques
Convenience
Samples
Non-Probability Samples
Judgement
Probability Samples
Simple Random
Systematic
StratifiedCluster
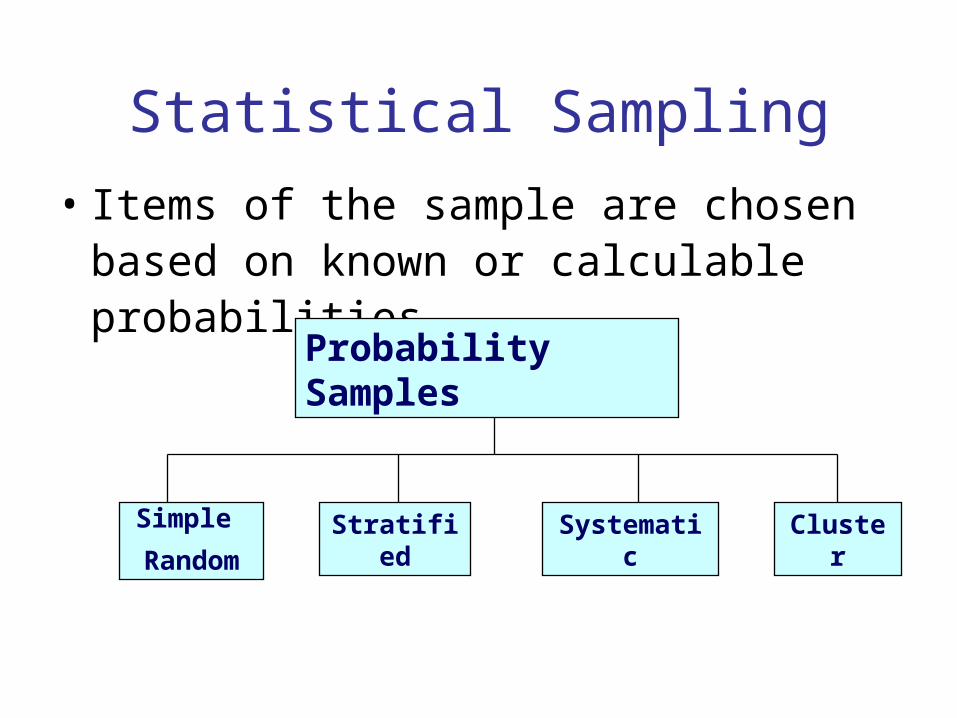
Statistical Sampling
• Items of the sample are chosen based on known or calculable probabilities
Probability Samples
Simple
RandomSystematicStratified Cluster
Simple Random Samples
• Every individual or item from the population has an equal chance of being selected
• Selection may be with replacement or without replacement
• Samples can be obtained from a table of random numbers or computer random number generators
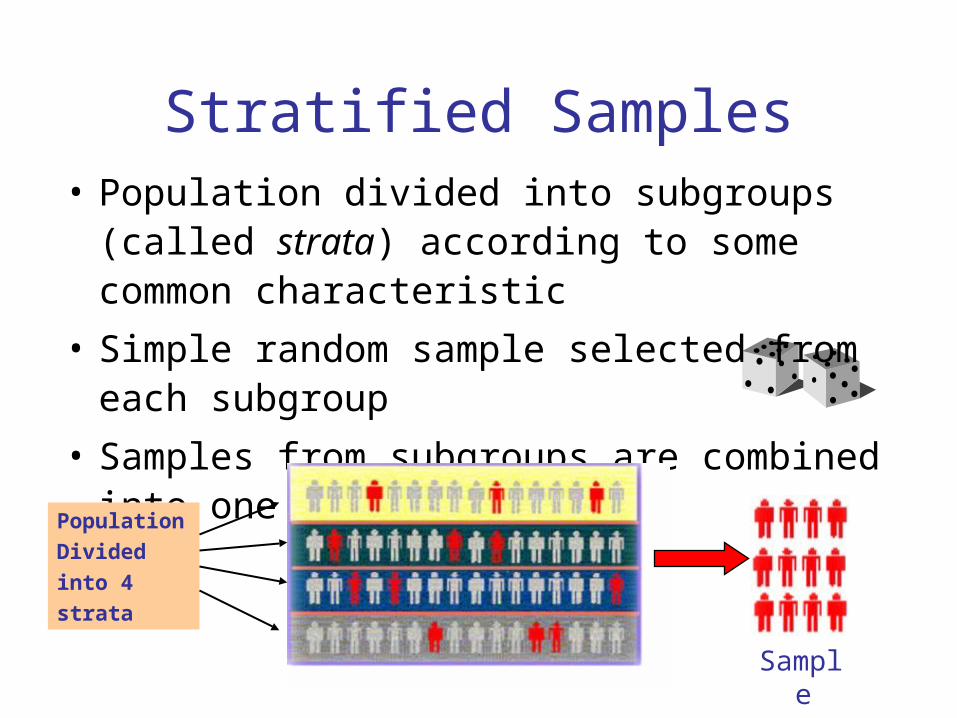
Stratified Samples• Population divided into subgroups (called strata)
according to some common characteristic
• Simple random sample selected from each subgroup
• Samples from subgroups are combined into one
PopulationDividedinto 4strata
Sample
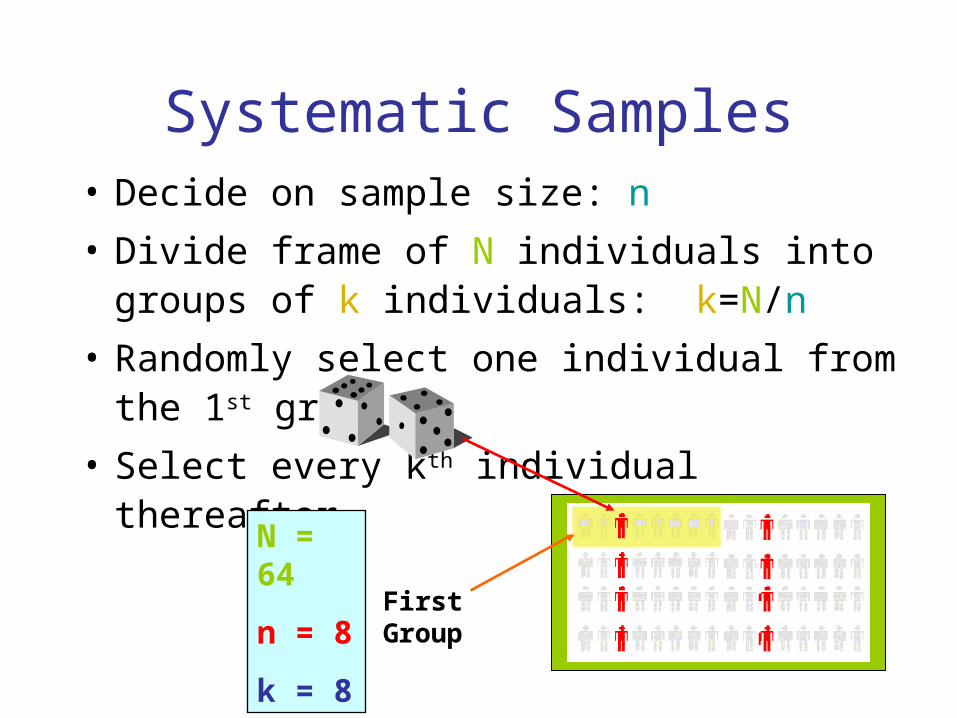
• Decide on sample size: n
• Divide frame of N individuals into groups of k individuals: k=N/n
• Randomly select one individual from the 1st group
• Select every kth individual thereafter
Systematic Samples
N = 64
n = 8
k = 8
First Group
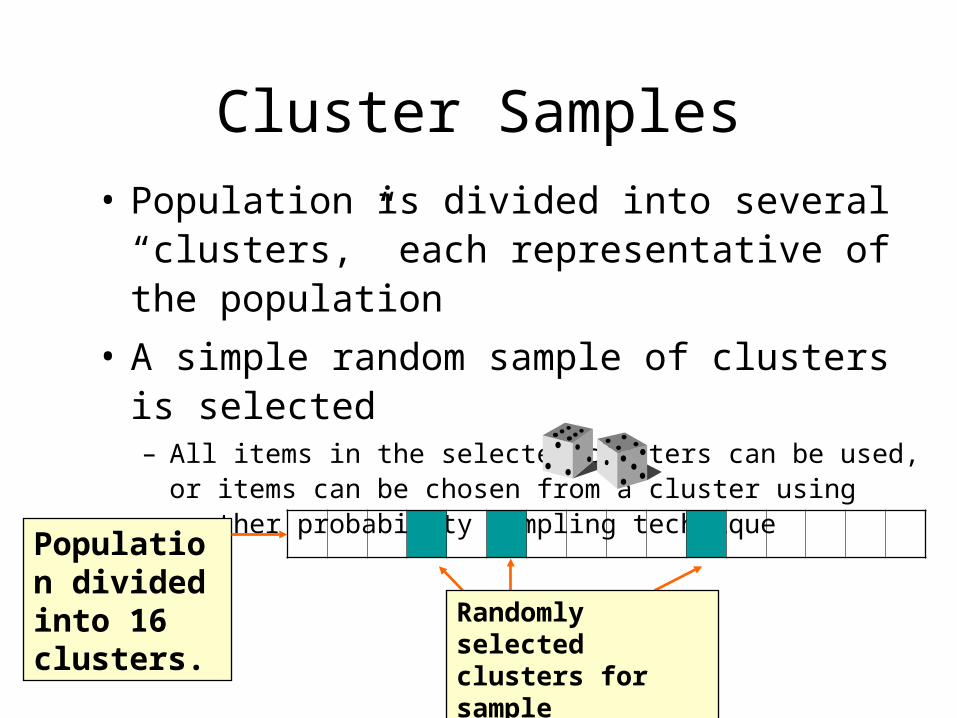
Cluster Samples• Population is divided into several “clusters,”
each representative of the population
• A simple random sample of clusters is selected– All items in the selected clusters can be used, or items can be
chosen from a cluster using another probability sampling technique
Population divided into 16 clusters. Randomly selected
clusters for sample
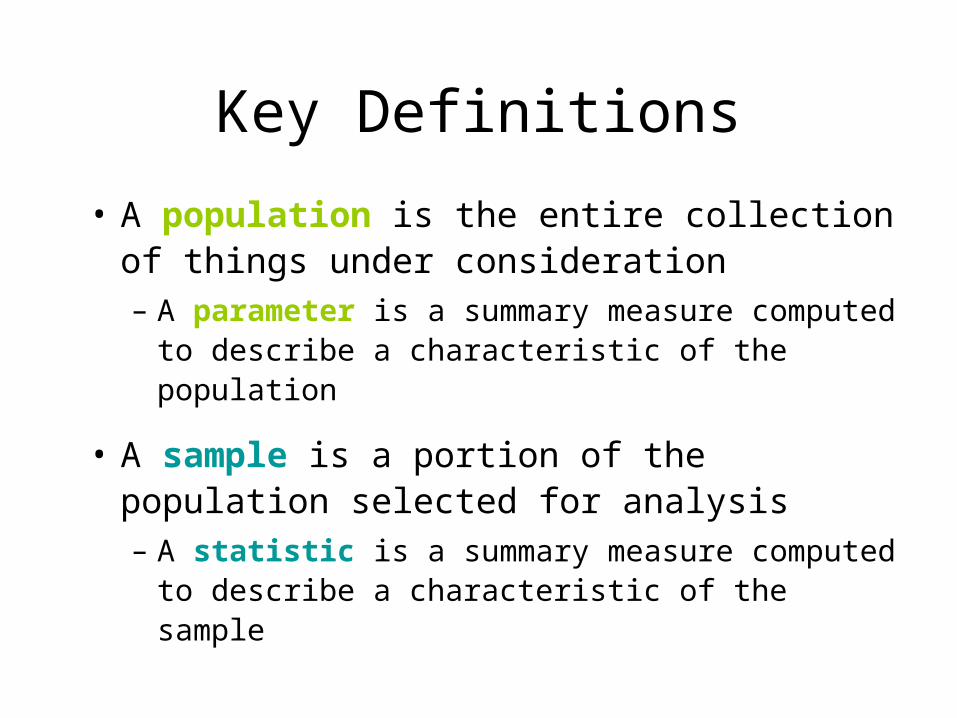
Key Definitions
• A population is the entire collection of things under consideration– A parameter is a summary measure computed to
describe a characteristic of the population
• A sample is a portion of the population selected for analysis– A statistic is a summary measure computed to
describe a characteristic of the sample
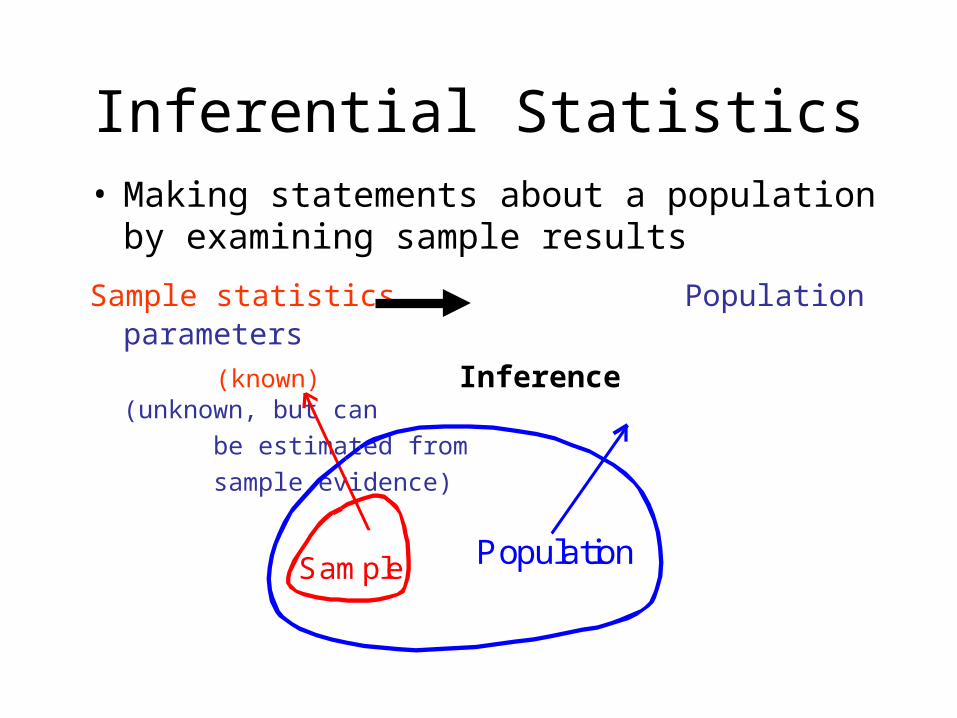
• Making statements about a population by examining sample results
Sample statistics Population parameters (known) Inference (unknown, but can
be estimated from
sample evidence)
Sample Population
Inferential Statistics
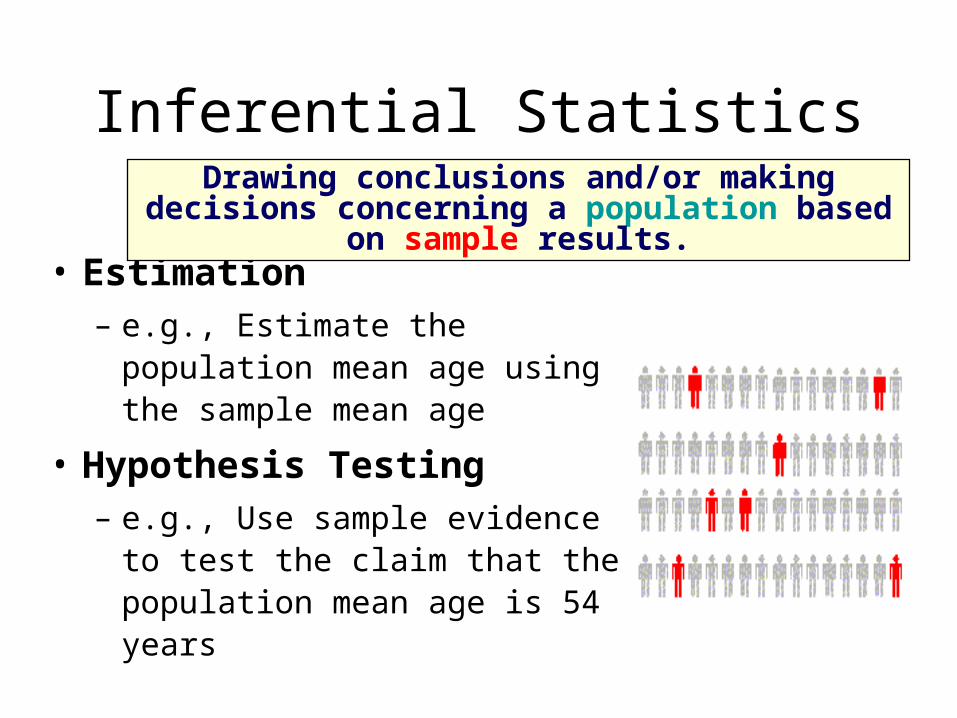
Inferential Statistics
• Estimation– e.g., Estimate the population mean
age using the sample mean age
• Hypothesis Testing– e.g., Use sample evidence to test
the claim that the population mean age is 54 years
Drawing conclusions and/or making decisions concerning a population based on sample results.
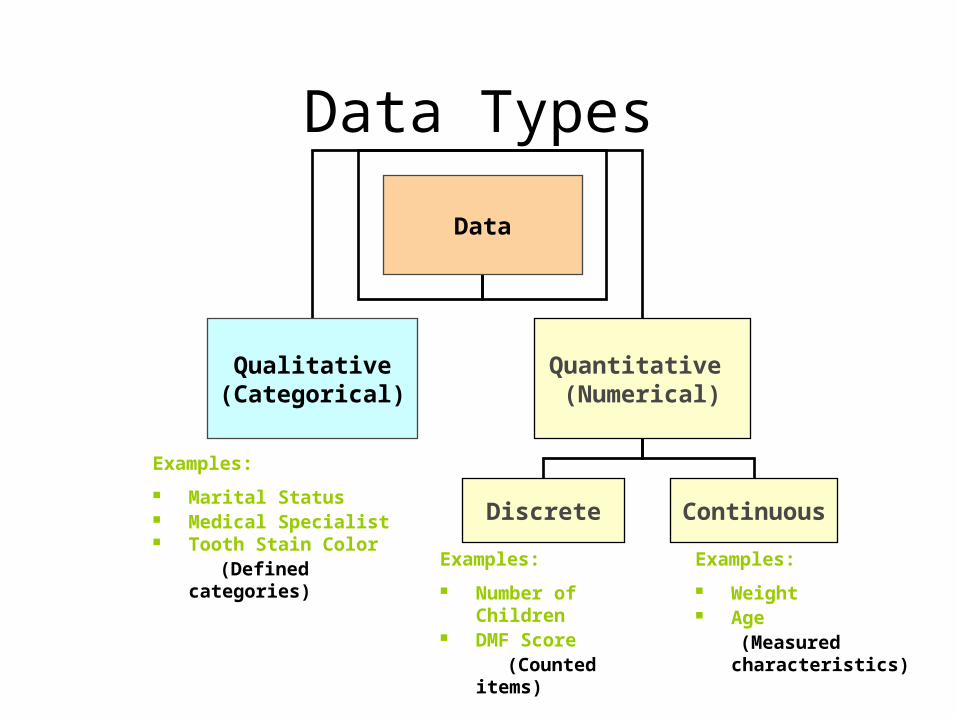
Data Types
Data
Qualitative(Categorical)
Quantitative (Numerical)
Discrete Continuous
Examples:
Marital Status Medical Specialist Tooth Stain Color (Defined categories) Examples:
Number of Children DMF Score (Counted items)
Examples:
Weight Age (Measured
characteristics)
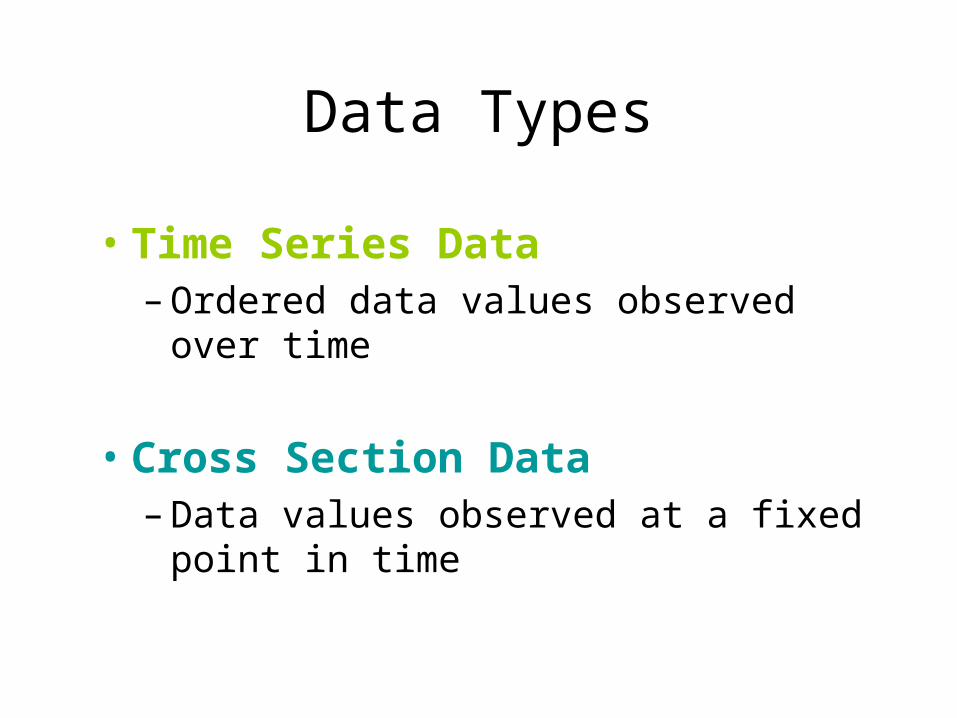
Data Types
• Time Series Data– Ordered data values observed over time
• Cross Section Data– Data values observed at a fixed point in
time
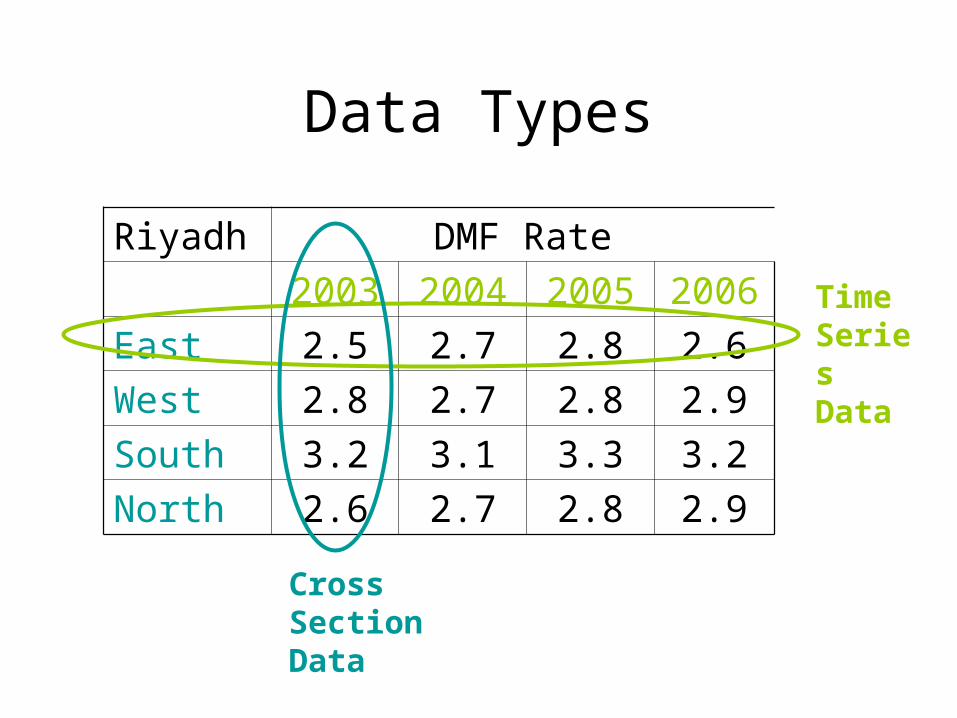
Data Types
Riyadh DMF Rate
2003 2004 2005 2006
East 2.5 2.7 2.8 2.6
West 2.8 2.7 2.8 2.9
South 3.2 3.1 3.3 3.2
North 2.6 2.7 2.8 2.9
Time Series Data
Cross Section Data
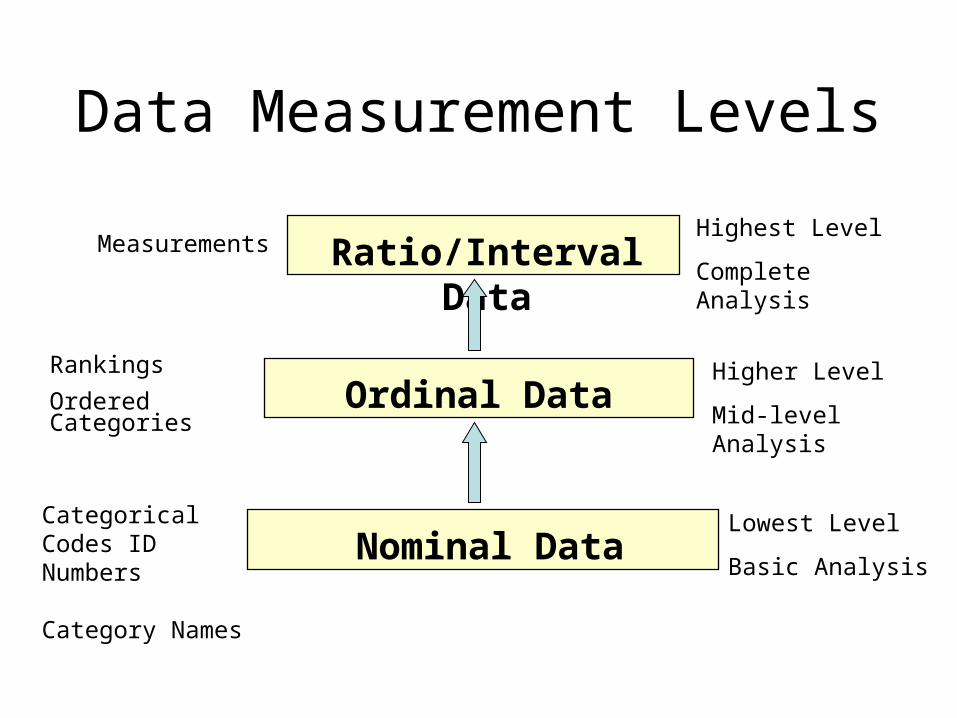
Data Measurement Levels
Ratio/Interval Data
Ordinal Data
Nominal Data
Highest Level
Complete Analysis
Higher Level
Mid-level Analysis
Lowest Level
Basic Analysis
Categorical Codes ID Numbers Category Names
Rankings
Ordered Categories
Measurements
Summary
• Reviewed key data collection methods
• Introduced key definitions:Population vs. Sample Primary vs. Secondary data types
Qualitative vs. Qualitative data Time Series vs. Cross-Sectional data
• Examined descriptive vs. inferential statistics
• Described different sampling techniques
• Reviewed data types and measurement levels