Embed Size (px)
Citation preview

APT REPORT on
CASE STUDIES ON TYPICAL RADIO INTERFERENCE, THEIR CAUSES AND SOLUTIONS
No. APT/AWG/REP-25(Rev.1)
Edition: March 2013
Adopted by
The 14th APT Wireless Group Meeting18 – 21 March 2013Bangkok, Thailand

ASIA-PACIFIC TELECOMMUNITYAPT Wireless Group (AWG)
SOURCE: AWG14/OUT-18
APT REPORT ON CASE STUDIES ON TYPICAL RADIO INTERFERENCE, THEIR CAUSES AND SOLUTIONS
(Rev. 1)
Table of Contents
1. Introduction.....................................................................................................................................42. Brief description of the case studies................................................................................................43. Studies on radio interference in ITU-R...........................................................................................5Annex 1 Case studies contributed by China..........................................................................................6
Part 1: Case studies on terrestrial radio interference solutions (VHF/UHF).................................6Case.1.1 Detection of instantaneous broadband radio interference.......................................6Case 1.2 The interference to COSPAS-SARSAT satellite by the co-channel unauthorized emission of local wireless access system...............................................................................8Case 1.3 Interference to wireless car locks by an infrared alarming unit............................12Case 1.4: A Case Study of television outside broadcast (TVOB) interfered by Vehicle Antitheft Alarm Device........................................................................................................13
Part 2: Case studies on terrestrial radio interference solutions (HF)...........................................14Case 1.5 Monitoring and location of an international radio interference in the HF band....14
Part 3: Case studies on space radio interference solutions...........................................................15Case 1.6 Geolocation of an unauthorized emissions from a GSO satellite..........................15
Annex 2 Case studies contributed by Japan.........................................................................................21Case 2.1 Interference with MCA radio control station by a baby monitor and other devices..............................................................................................................................................21Case 2.2 Interference with the Fire Department's emergency communication by a LED exterior display.....................................................................................................................22Case 2.3 Interference with mobile phone base station by a communications scrambler.....23Case 2.4 Harmonic emission on 406MHz from a high-frequency equipment.....................23Case 2.5 Interference with the Fire Department’s communication by leak radiation from a communal TV antenna system.............................................................................................24Case 2.6 Interference with disaster prevention radio communication by a communal TV antenna system.....................................................................................................................25Case 2.7 Interference with the reception of standard TV broadcasting by a LED street light..............................................................................................................................................26Case 2.8 Interference with fire department radio system caused by a laptop computer cooler....................................................................................................................................27
AWG/REP-25 (Rev.1) Page 2 of 43

Case 2.9 Interference with radio broadcasting service caused by a communal TV antenna system...................................................................................................................................29Case 2.10 Interference with the airport control system (SSR: Secondary Surveillance Radar) at the Kansai International Airport and how it was resolved...................................30Case 2.11: Interference with mobile phone base station caused by a peripheral (cordless) device for personal computers and how it was resolved......................................................34
Annex 3 Case studies contributed by Republic of Korea....................................................................38Case 3.1 2.4GHz Wi-Fi Interference management..............................................................38
AWG/REP-25 (Rev.1) Page 3 of 43

1. IntroductionRadio Interference in many cases may degrade the quality of service of radiocommunication operators, and sometimes even worse, lead to very heavy losses. Therefore its detection and elimination is a major task and an important national monitoring goal of the spectrum monitoring organizations.
Most of the APT administrations have been conducting exercises concerning enforcement issues including interference resolution. This Report provides details of the number of interference complaints or resolution cases addressed for various types of service has been proved difficult due to the variation in reporting methods. The present Report is a collection of case studies of radio interference incidents in the Asia-Pacific Region and is expected to serve as a useful reference for the spectrum monitoring organizations in this Region.
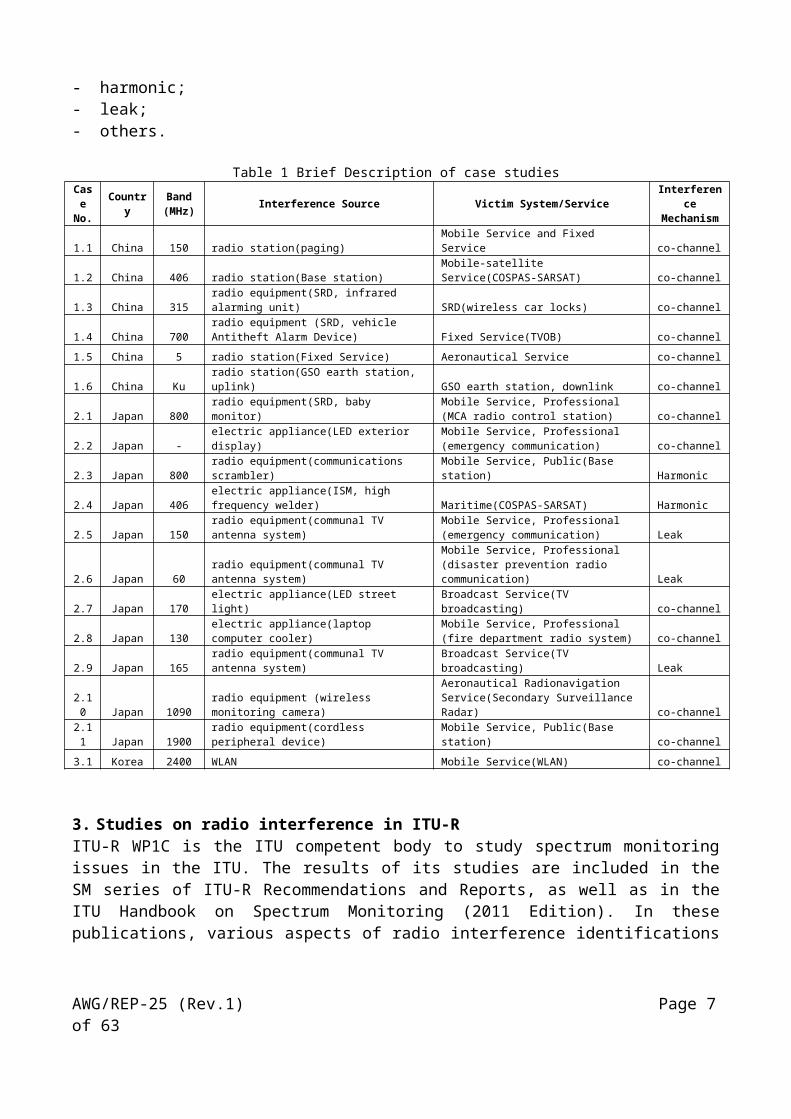
2. Brief description of the case studiesThe case studies are shown in Table 1. The table has to be clear and simple in order to provide relatively easily collectable and comparable information.
Only interferences that involve radio services as victim should be included in the report. The minimum requirement for this kind of statistics is to be able to sort the data by both 'source' and 'victim' of interference. The interference source includes:- radio station- radio equipment- electric appliance
The interference statistics should also include information on the interference mechanism based on for example the following categories:- co-channel interference;- spurious emissions/out-of-band emissions;- adjacent channel interference;- intermodulation/ mixing products;- blocking;- harmonic;- leak;- others.
Table 1 Brief Description of case studiesCase No. Country Band
(MHz) Interference Source Victim System/Service Interference Mechanism
1.1 China 150 radio station(paging) Mobile Service and Fixed Service co-channel
1.2 China 406 radio station(Base station) Mobile-satellite Service(COSPAS-SARSAT) co-channel
1.3 China 315 radio equipment(SRD, infrared alarming unit) SRD(wireless car locks) co-channel
1.4 China 700radio equipment (SRD, vehicle Antitheft Alarm Device) Fixed Service(TVOB) co-channel
1.5 China 5 radio station(Fixed Service) Aeronautical Service co-channel
1.6 China Ku radio station(GSO earth station, uplink) GSO earth station, downlink co-channel
2.1 Japan 800 radio equipment(SRD, baby monitor)Mobile Service, Professional (MCA radio control station) co-channel
2.2 Japan - electric appliance(LED exterior display)Mobile Service, Professional (emergency communication) co-channel
AWG/REP-25 (Rev.1) Page 4 of 43

2.3 Japan 800 radio equipment(communications scrambler) Mobile Service, Public(Base station) Harmonic
2.4 Japan 406 electric appliance(ISM, high frequency welder) Maritime(COSPAS-SARSAT) Harmonic
2.5 Japan 150 radio equipment(communal TV antenna system)Mobile Service, Professional (emergency communication) Leak
2.6 Japan 60 radio equipment(communal TV antenna system)Mobile Service, Professional (disaster prevention radio communication) Leak
2.7 Japan 170 electric appliance(LED street light) Broadcast Service(TV broadcasting) co-channel
2.8 Japan 130 electric appliance(laptop computer cooler)Mobile Service, Professional (fire department radio system) co-channel
2.9 Japan 165 radio equipment(communal TV antenna system) Broadcast Service(TV broadcasting) Leak
2.10 Japan 1090 radio equipment (wireless monitoring camera)Aeronautical Radionavigation Service(Secondary Surveillance Radar) co-channel
2.11 Japan 1900 radio equipment(cordless peripheral device) Mobile Service, Public(Base station) co-channel
3.1 Korea 2400 WLAN Mobile Service(WLAN) co-channel
3. Studies on radio interference in ITU-RITU-R WP1C is the ITU competent body to study spectrum monitoring issues in the ITU. The results of its studies are included in the SM series of ITU-R Recommendations and Reports, as well as in the ITU Handbook on Spectrum Monitoring (2011 Edition). In these publications, various aspects of radio interference identifications are discussed, including its procedures, techniques and measuring equipment. However, there is virtually no material concerning case studies on interference solutions in the ITU-R WP1C documentations.On the other hand, ITU-R WP 1C has started at its June 2012 meeting to develop a working document towards a preliminary draft new recommendation in response to Question ITU-R 235/1 on Spectrum Monitoring Evolution.The case studies provided in this APT Report could also provide useful information for the studies in response to Question ITU-R 235/1.
Annex 1 Case studies contributed by ChinaAnnex 2 Case studies contributed by JapanAnnex 3 Case studies contributed by Korea (Republic of)Note: Country names organized in alphabetical order.
AWG/REP-25 (Rev.1) Page 5 of 43

Annex 1 Case studies contributed by China
IntroductionIn China, depending upon the bands in which the interference occurs, its related services, the monitoring capabilities necessary for its detection, measurement and location, interference cases can be broadly and roughly divided into three categories:
Terrestrial radio interference in the VHF and UHF band. To resolve this type of interference generally requires monitoring facilities to be located near the origin of the interference.
Terrestrial radio interference in the HF band. Due to the propagation characteristics of radio waves in the HF band, this type of interference generally is located and resolved with the cooperation of a number of HF monitoring stations much farther apart. In some cases, international cooperation is needed to resolve interference in this band.
Radio interference which requires space monitoring. Although space monitoring does not differ from terrestrial monitoring in principle, it does require some special techniques and much more expensive monitoring equipment.
The following cases are presented according to the above classifications.
Part 1: Case studies on terrestrial radio interference solutions (VHF/UHF)Case.1.1 Detection of instantaneous broadband radio interference1. IntroductionWith the ever increasing use of electronic equipment and increased types of radio signals, instantaneous broadband radio interference becomes more and more common. This type of interference present potential threat to the order of the spectrum use and it may be much more difficult to eliminate. Administrations have come to recognize the need to enhance their capability to detect, monitor and locate this type of interference. Using high performance monitoring receivers is one of the solutions. The following text presents a case of how an instantaneous broadband interference found during the Beijing Olympic Games was detected before being located and eliminated.
2. The solution of using high performance monitoring receiverHigh performance monitoring receiver is also known as a scanning signal analysis system. Compared with traditional scanning analyzers, it has many good features such as:
The rate of its fiber bus can be as high as 2GB/s, much higher than traditional ones Up to six DSP modules can be used instead of only one of the traditional ones In the real time bandwidth, the FFT points can be as high as 80,000. The function of zooming and multi-window display enables the operator to view the subtleties of
the spectrum
Because there can be a great variety of sources of instantaneous broadband interference, and normally their power and time of appearance are unknown, their detection is very difficult. The possibility of interception is directly associated with the scanning bandwidth, the resolution bandwidth (RBW), the local noise level of monitoring receivers, scanning speed and the method of detection used. A high performance monitoring receiver is capable of a scanning of 150MHz/s (RBW=140Hz and local noise level=-120dBm). Meanwhile, multiple detection modes help improve
AWG/REP-25 (Rev.1) Page 6 of 43
the possibility of interception for broadband instantaneous interference. Energy detections and signal detections are the most useful tools (See Figure 1.1.1.1 and Figure 1.1.1.2).
Figure 1.1.1.1
Figure 1.1.1.2
3. A case of instantaneous broadband radio interference and its detectionA broadband instantaneous interferer was detected in one of the venues during the rehearsal of the opening ceremony of the 2008 Olympic Games held in Beijing. It swept across a wide frequency range of 137-150MHz. From the upper half of Figure 1.1.1.3, it can be seen that only by viewing the spectrum, the interference could hardly be found, while the lower half clearly shows the sweeping action of this signal.
AWG/REP-25 (Rev.1) Page 7 of 43

Figure 1.1.1.3The signal was then located at the north ease of Beijing and it proved to be a faulty paging which caused this interference.
Case 1.2 The interference to COSPAS-SARSAT satellite by the co-channel unauthorized emission of local wireless access systemBackgroundThe working scheme of COSPAS-SARSAT is as follows: the satellite receives the radio distress alert signal sent from the Emergency Position-Indicating Radio Beacons, transmits it to the Local User Terminals (LUT) located around the world which can calculate the position of the original sender. The position information will be sent to relevant departments for search and rescue purpose. However, if there is a false signal, being steady and strong, and co-channel to the emergency radio signal sent to the satellite, such a signal would be mistakenly interpreted as an emergency signal by the COSPAS-SARSAT system. The interference caused by the false signals may lead to delayed processing of real emergency radio signal, and eventually result in delayed search and rescue.
IntroductionAn interference complaint was reported about an unauthorized emission in 406-406.1MHz in some area of China, the COSPAS-SARSAT system misunderstood the interference signal as an emergency signal. In accordance with the ITU relevant resolutions of protecting 406-406.1MHz allocated to the mobile satellite service, for the unauthorized emission source in the jurisdiction of radio management authority, the administration needs to take all the necessary measures immediately to eliminate unauthorized emission. In the following, a case study is introduced to analyze and search for the interference.
Analysis processThe characteristics of the interference were as follows: First, there was more than one suspicious interference source in the target area. Second, the interference sources were in suburb and rural areas. Based on the above observations, it was inferred that the interference might be caused by the continuous and strong signal emitted without authorization or malfunctions by some types of radio station. In addition, since there were more than one emission source, it was very likely that the radio stations were deployed in different places and possibly for the purpose of rural radio business.
Solution
AWG/REP-25 (Rev.1) Page 8 of 43

1 Clue from databaseAll the large radio stations operated by organizations and corporations were analyzed in our database and found that the suspicious radio signal emitter was a local wireless access system in rural area constructed and operated by an authorized operator. Our estimation was based on the fact that this system used the bands 406.5-409.5MHz which was assigned by radio administrative departments and which was near to the 406-406.1MHz used by COSPAS-SARSAT. In the meantime, it was found that the approximate area of interference sources matched with the deployed location of the system.
2 Monitoring and direction findingAt the beginning, it was supposed to use fixed UHF monitoring receivers with a view to capturing the interference signal. But this attempt eventually failed because the target signals were very weak. The UHF direction finding system encountered the same problem, which could not yield any valuable result. Then the strategies had to be changed, the breakthrough point was the rough latitude and longitude information about interference source in the complaint, the approximate sites of the interference source could be identified in the electronic map system easily. Therefore it would be feasible by the monitoring staff to carry out near-field ground search using monitoring vehicles and direction finder.
On the first day of the search, the monitoring staff was divided into six groups to six sites of suspected interference sources. Suspicious signals (central frequency 406.250 MHz, bandwidth 500kHz) were stably detected at all six sites, although the signals strength were very weak, ranged from 5dBμV to 30dBμV . The waveforms captured by the detecting devices are shown in Figure 1. As can be seen, the waveforms are in the shape of local signals, which were different from other kinds of radio signals and their harmonics. However, it was impossible to find any radio equipment or station in any of these sites.
The spectrum at the site No. 1 The spectrum at the site No. 3
The spectrum at the site of No. 5 The spectrum at the site of No. 6
Figure 1 The Results of monitoring and direction finding By measuring the signals with direction finders, it was found that the arriving directions of signals measured in the two sites could converge at a point A on the map, and the arrival directions of
AWG/REP-25 (Rev.1) Page 9 of 43

signals measured in the other four sites could converge in a quadrilateral region on the map. After a day's searching, a base station was found in Mountain A nearby the point A, and another base station in Mountain B in the edge of the quadrilateral region. The scheme is shown in Figure 2
Figure 2 a sketch of locating the radio source using direction finders.
On the next day, in order to pinpoint the interferer, the monitoring staff gathered at the top of the Mountain A and B where they found the base stations, the signals received by direction finder were stronger than the previous day; the level value exceeded 50dBμV . The result is shown in Figure 3. The monitoring staff contacted with the corporation which the base station belongs to, in the cooperation with the technician, our monitoring staff further conducted switch on and off tests for the two base stations in a networked manner. When the base stations were switched on, the signals centered at frequency 406.250MHz with a bandwidth of 500kHz were received. When they were switched off, the signals disappeared.
Figure 3 The spectrum measured near the interfering station at the Mountain A
On the last day, in order to confirm that the interference sources were the base stations at the top of the Mountain A and B, the monitoring staff was sent to all the 6 sites marked earlier in the mapping software to track the interference signals by using direction finders. In the two buildings contained base stations at Mountain A and B, with the help of operator technician, the monitoring staff
AWG/REP-25 (Rev.1) Page 10 of 43

conducted switch on and off test on two base stations simultaneously. When two base stations were switched on at the same time, the monitoring staff at all six sites would receive the interference signals, when they were switched off at the same time, only noise could be received. Some test results are shown in Figure 4.
The spectrum when Switch ON The spectrum when Switch OFF
at Mountain A station at Mountain A stationFigure 4 The spectrum of switch on off test
3 Characteristics of the interference sourcesAfter careful observation, it could be seen that the antennas of the base stations were installed at the top of two 50-meter high iron towers separately. One tower is on the top of mountain A; the other is in the mountain B; the altitude of each mountain exceed 3000 meters. According to the information collected, the RF power of these two base stations were close to 50W, plus, amplifier might be used at the tower top. These two base stations are shown in Figure 5.
The antenna of local wireless The antenna of local wireless access system on Mountain A access system on Mountain B
The antenna of local wireless The antenna of local wireless access system on Mountain A access system in Mountain B
AWG/REP-25 (Rev.1) Page 11 of 43

( Close view) ( Close view) Figure 5 the antenna of the local wireless access system
ConclusionIt was confirmed that the interference to the COSPAS-SARSAT was caused by co-channel unauthorized radio signal of local wireless access system due to mistaken operations of the controlling software. In this case, the interference source was located through field observations.
Case 1.3 Interference to wireless car locks by an infrared alarming unit1. IntroductionNowadays, almost all wireless car locks/keys are operated by radio signal, i.e., a radio “passcode” released in a combination of several digital numbers by wireless car keys at a given radio frequency. Upon receiving the signal, the car determines to lock or unlock by comparing it with the passcode in the memory. The frequency for general wireless car locks/keys is set at 315 MHz -316 MHz and 430 MHz - 432 MHz
From the regulatory perspective, being a type of license-exempt device, wireless car locks/keys shall not claim protection from other licensed applications, nor cause harmful interference. Therefore, it is generally not the radio administration’s responsibility to resolve cases of harmful interference to these devices. However, the administrative agencies across China, when they have sufficient resources, will help resolve serious interference accidents for car owners in order to protect the safety of private property.
2. Process of screening and detecting interferenceA complaint of interference, submitted by a local company to Tianjin Radio Monitoring Station, that a large number of cars in the company’s parking lot experienced wireless car locks/keys malfunctions and were unable to lock and/or unlock. A number of these cars were unable to start and had to be towed away. This created large potential risk to assets of car owners.
The spectrum monitoring operators arrived at the parking lot shortly with necessary equipment. They checked one of the malfunctioning wireless car locks/keys and assured that they were operated at frequency of 314.9 MHz. Later on, they searched the parking lot area with the direction finders and a signal at 315 MHz was found to have always been on. The signal became stronger as the monitoring equipment moved towards the main entrance, and reached 77 dBµV at the entrance. An infrared alarming unit, which had measured maximum signal strength at 86 dBµV of the alarming detecting antenna, was spotted there after a careful inspection on the entrance area. After the company manager had the infrared alarming unit turned off, the interfering signal vanished and all wireless car locks/keys became working normally.
To conclude, the infrared alarming unit used the same or had overlapping frequency with the wireless car locks/keys and its power surpassed the limit stipulated, resulting the co-channel or adjacent channel interference to the wireless car locks/keys.
AWG/REP-25 (Rev.1) Page 12 of 43

3. Experience from the caseInterference to car remote control happens more often in the past few years, mainly because of nearby short range devices (SRDs). Equipment possibly interfering with wireless car locks/keys includes indoor anti-theft alarm, radio infrared anti-theft alarm, remote control of same model, radio ordering menus, etc.
The gigantic number of different short range devices keeps expanding with on-going innovation and development. The radio administration agencies may need to pay additional attentions to the increasing possibility of harmful interference between different types of SRDs. It might be reasonable for spectrum regulators to consider:
making available more radio-frequency resource to SRDs, enforcing stricter technical regulations and management, and controlling strictly product specification of short range devices.
On the other hand, the manufacturers are encouraged to consider how to improve anti-interference performance of their short range devices.Case 1.4: A Case Study of television outside broadcast (TVOB) interfered by Vehicle Antitheft Alarm Device
Outside broadcasting (OB) is the temporary provision of program making facilities at the location of ongoing news, sport or other events, lasting from a few hours to several weeks. Video and/or sound reporting radio links (channels) might be required for mobile links, portable links and cordless cameras or microphones at the OB location. Additionally, video and/or sound reporting radio links may be required as part of a temporary point to point connection between the OB vehicle and the studio.In the 10th Tour de Qinghai Lake International Road Cycling Competition, the local radio administration received an interference complaint about the TVOB Van interfered by unidentified signals in 700MHz band.
One task team was sent out to investigate the complaint. They communicated with the sports activities organizing committee and confirmed that the interfered frequency band was exclusively authorized to the usage of TVOB in this area.
AWG/REP-25 (Rev.1) Page 13 of 43

The task team used portable receiver to scan the frequency band, and discovered a FSK modulated signal in the same channel. They noticed that the signals were emitted from several off-road vehicles in the vicinity of the TVOB van. When they approach these vehicles, the signal power level kept increasing until the receiver reached its maximum display value and showed the overload warning mark. All the vehicles were equipped with vehicle antitheft alarm device. The task team conducted switch on-off test and found out that when the devices power off, the interfered signal disappeared. Finally, all the vehicles were requested to keep a distance with TVOB van.
The Antitheft Alarm Device The interference signal
Part 2: Case studies on terrestrial radio interference solutions (HF)Case 1.5 Monitoring and location of an international radio interference in the HF bandThe HF band, as defined in the ITU Radio Regulation, ranges from 3MHz to 30MHz. In practice, an HF monitoring station should be equipped with monitoring (including listening) and direction finding (DF) equipment to undertake interference resolution tasks.
As mentioned in the Introduction to Annex 1 of this Report, radio interference in the HF band should normally be addressed by the cooperation of a number (three or more) of competent monitoring stations which are located well apart from one another geographically. These stations are generally connected via network for the convenience of the operation. Among them, a control station can be designated and the equipment of the other stations may be remotely accessed by the operator at the control station. The resolution of an interference case in the HF band can be roughly divided into three steps:
Step 1 spectrum monitoring: The operator makes full uses of his monitoring/listening resources and equipment (generally having relatively high sensitivity than direction finders) at his/her disposal to acquire necessary information of the interfering signal, including its centre frequency, modulation type, number of channels, audio characteristics, duty cycle and call sign etc. By these measurements, the operator is able to verify that the signal under test matches the one being complained. Additionally, knowing this information would be beneficial to the following steps to locate and identify the interferer.
Step 2, direction finding and triangulation: The operator selects a set of competent DF stations, inputs the DF technical parameters and runs the triangulation based on the bearings results drawn from other DF stations.
Step 3, ground search: In a majority number of cases, with a good location result, the operator is able to identify the interferer after checking with the radio station database. In the other cases when there is no matching database result, it may be necessary to perform a ground search of the interferer, which will require the use of one or more monitoring vehicle(s).
The following is a case of resolution of international interference in the HF band. The frequency channel at 5,547kHz was interfered with by an unknown transmitter, as reported in the complaint
AWG/REP-25 (Rev.1) Page 14 of 43

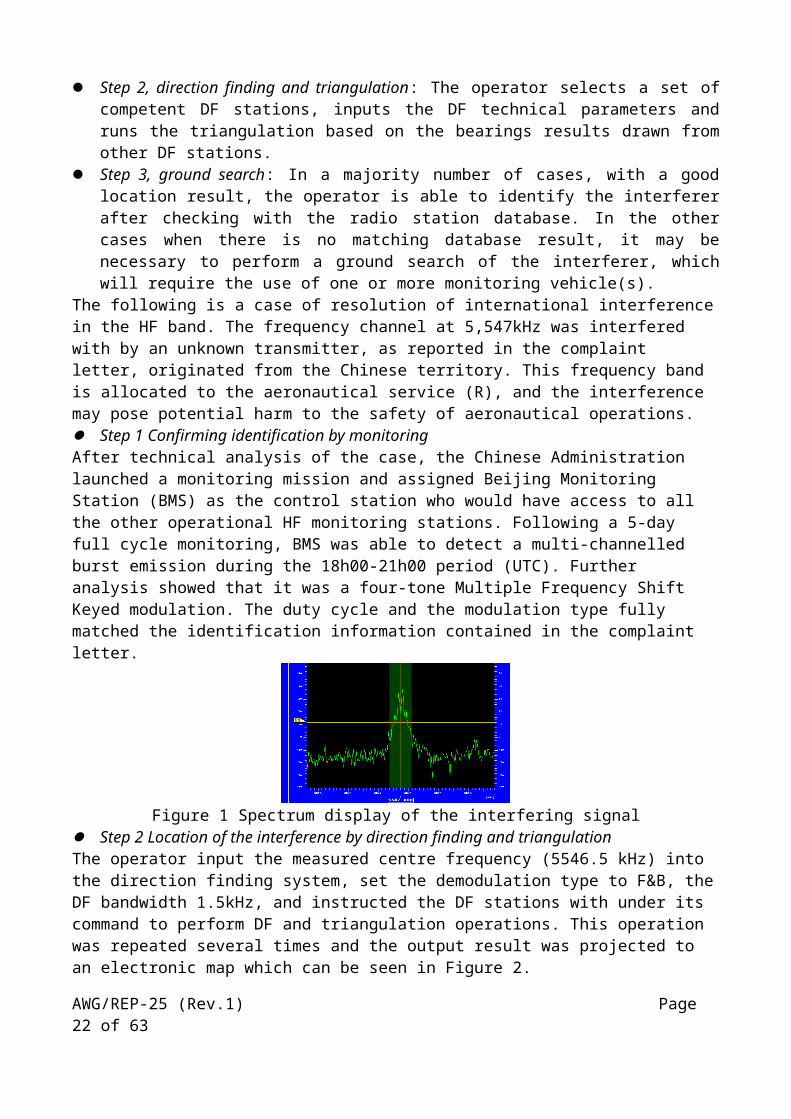
letter, originated from the Chinese territory. This frequency band is allocated to the aeronautical service (R), and the interference may pose potential harm to the safety of aeronautical operations. Step 1 Confirming identification by monitoringAfter technical analysis of the case, the Chinese Administration launched a monitoring mission and assigned Beijing Monitoring Station (BMS) as the control station who would have access to all the other operational HF monitoring stations. Following a 5-day full cycle monitoring, BMS was able to detect a multi-channelled burst emission during the 18h00-21h00 period (UTC). Further analysis showed that it was a four-tone Multiple Frequency Shift Keyed modulation. The duty cycle and the modulation type fully matched the identification information contained in the complaint letter.
Figure 1 Spectrum display of the interfering signal Step 2 Location of the interference by direction finding and triangulationThe operator input the measured centre frequency (5546.5 kHz) into the direction finding system, set the demodulation type to F&B, the DF bandwidth 1.5kHz, and instructed the DF stations with under its command to perform DF and triangulation operations. This operation was repeated several times and the output result was projected to an electronic map which can be seen in Figure 2.
Figure 2 Triangulation result Step 3 Ground searchBecause the location result still covered a wide area, it was difficult to identify the interfering station without a ground based search. Three monitoring vehicles equipped with HF direction finders were dispatched to check the target area from three directions namely the north-west, the east and the west directions. Field strength and the DF indicator were closely monitored while the vehicles were moving. When the monitoring vehicle entered the 3km range apart from the transmitter, the fluctuation of the DF indicator dropped significantly and the signal became stronger. By simple triangulation measurement on the map, the operator was able to reach the location where the transmitter was installed (103.7E, 31.3N).
Figure 3 Antenna of the interfering transmitter
AWG/REP-25 (Rev.1) Page 15 of 43

Part 3: Case studies on space radio interference solutionsCase 1.6 Geolocation of an unauthorized emissions from a GSO satellite1. General descriptions
To locate an uplink transmitter toward a GSO satellite, it is necessary to select an adjacent satellite and measure the time difference of arrival (TDOA) and frequency difference of arrival (FDOA) of the emission through the two satellites at the monitoring station. The measured TDOA and FDOA can be used to calculate the location of the transmitter with precise knowledge of the ephemeris of both satellites. This measurement is usually known as “geolocation” or a “TLS” activity. A dedicated geolocation system and two antenna systems are the minimum hardware requirements for a geolocation measurement. To the operator of the adjacent satellite, the measurement process can be completely passive without being affected.Figure 1.3.1.1 illustrates the scenario of the geolocation process.
Figure 1.3.1.1 scenario of the geolocation
2. Geolocation using TDOA and FDOA from two GSO satellites
The measurements of TDOA and FDOA require that the transmissions be monitored through a second GSO satellite that lies within the transmitter beam. The GSO satellite carrying the unknown signal is usually referred to as the “primary satellite” and the above mentioned second GSO satellite as “adjacent satellite”. A TDOA measurement yields the difference in the time the same signal arrives at one ground-based receiver through the primary satellite and another ground-based receiver through the adjacent satellite. An FDOA measurement yields the difference in frequency measured between the signal paths which separately arrives at the two receivers. Usually, the two receivers are co-located at the same geographic site, but this is not a requirement.
The arrival time varies because the transmitted signal travels different distances as it passes through the two different satellites to each receiver. The received frequency differs because, generally, there is relative motion between the two satellites causing different Doppler frequency shifts on the transmissions. Although the positions of GSO satellites are loosely described as being fixed at specific positions over the Earth's equator, they actually do move about these nominal positions within certain limits. It is these movements that induce a measurable Doppler shift in the received
AWG/REP-25 (Rev.1) Page 16 of 43

signals. The received frequencies can also differ as the result of drifts in the oscillators which set the retransmission frequency on the downlink of each satellite.
Single TDOA or FDOA measurements combined with the satellite and ground station configuration each describe different surfaces on which the unknown transmitter must be located. The figure of the Earth (where nearly all transmitters of interest occur) provides a third surface that constrains the unknown’s location. The intersection of these three surfaces provides an estimate of the unknown signal from a single pair of TDOA and FDOA measurements. Since measurement or modeling errors can lead to errors in the geolocation, additional TDOA and FDOA measurements combined in a statistical solution can serve to reduce such errors.
3. Measuring TDOA and FDOA
The two time series of the transmitter signal downlinked from each of the two GSO satellites are recorded and analyzed to obtain time and frequency differences between them (i.e., TDOA and FDOA). This is done through the calculation of the cross ambiguity function (CAF) or correlation map in two dimensions. The value of CAF for a given time and frequency difference is the cross-correlation of the two recorded signals. In the special case of continuous wave (CW) emitters, no TDOA measurement can be generated since the two signals correlate for all delay time differences.
The CAF can be visualized in three dimensions where the value of the CAF is a function of both TDOA and FDOA. For the case of a single interference signal in the selected frequency range, the maximum value of CAF with respect to TDOA and FDOA selects those shifts as the TDOA and FDOA values that are presented to the geolocation algorithm that calculates the location of a single transmitter. For a CW emitter, a ridge along a line of constant FDOA is the result. Alternatively, several broadband transmitters from multiple locations will produce multiple CAF peaks.
4. Geolocation algorithm
The geolocation algorithm often uses TDOA and/or FDOA measurements in an iterative least squares procedure to estimate the location where the transmitted signal originates. In its simplest form, an initial guess of the transmitter location and the given orbits of the two satellites are combined with the physical laws of satellite motion to generate predicted TDOA and FDOA measurements. The difference between the actual and predicted TDOA and FDOA measurement values (the residuals) are used to generate adjustments to the transmitter position. This adjusted transmitter location is used to generate a second set of predicted TDOA and FDOA measurements which imply further adjustments to the transmitter position and so forth. An iterative solution is required because the problem is inherently nonlinear. Iterations continue until the adjustments in the transmitter position are sufficiently small at which point the geolocation solution is said to have converged.
TDOA and FDOA measurements made over time converge on the transmitter location based on the laws of physics. Additional geolocation solutions are also available for other combinations of measurement types. For example, geolocations of CW emitters are possible from a series of FDOA measurements alone with reduced accuracy over what would have been available with the corresponding TDOA measurements that are accessible from a broadbanded signal. Alternatively, use of a third satellite to generate a second set of TDOA and/or FDOA measurements can also provide improved solutions, however, this comes at the expense of greater use of receiver antenna resources. TDOA-only solutions are possible by the use of a third satellite, but the surfaces of
AWG/REP-25 (Rev.1) Page 17 of 43

constant TDOA derived from the two satellite pairs are nearly parallel making their practical use more dependent on TDOA measurement precision or more time for gathering measurements.
In practice, the accuracy of the satellite ephemeris of each of the two satellites limits the accuracy of the geolocation solution. Improved geolocation performance is achieved through TDOA and FDOA measurements of separate transmitter signals, sometimes referred to as reference locators, which originate from known locations and pass through the same pair of satellites as the signal of interest. These reference locators are used to refine the orbital ephemeris of one or both of the satellites which, in turn, improves the accuracy of the estimate of the location of the transmitter of the signal of interest.
5 A case of an unauthorized emission located by a space monitoring station in China
An interference complaint was reported to the Chinese Administration of an unauthorized emission found on GSO satellite S. The task to locate the source of the interference was delegated to Beijing Monitoring Station, State Radio Monitoring Center, which has state-of-the-art capability and more than nine years of expertise to conduct such measurements.
Step 1: The interference was in the first place monitored using a 7-meter Cassegrain antenna and some characteristics of the interference were found as follows:
Frequency measured (downlink) 12523.018472MHzFrequency calculated (uplink) 14273.018472MHz Date of measurement (yyyy-mm-dd) 2010-6-18 Time of measurement (UTC) 14:03:31Bandwidth [kHz] 1120time domain characteristics or descriptions(Dates and times (UTC) of occurrence of harmful interference) Time invariantfrequency domain characteristics or descriptions Frequency invariant, FDMA modulation type QPSKPower flux density [dBW/m²] -216.94 dBW/m²/HzClass of emission
Table 1.3.1.1 Characteristics of the interference concerned
The spectrum of the signal can be seen in the following figures:
AWG/REP-25 (Rev.1) Page 18 of 43

Figure 1.3.1.2 spectrum of affected transponder
Figure 1.3.1.3 spectrum of interfering signal
Step 2: Preparations of geolocationMajor preparations include the selection of a suitable adjacent satellite, selection of a group of reference signals and the obtaining of high-quality ephemeris for at least one of the satellites. , The criteria to select a usable adjacent satellite are: same uplink frequency coverage as the affected satellite; same uplink polarization as the affected satellite; similar uplink beam coverage as the affected satellite; small angular separation from the primary satellite along the geostationary arc; transponder does not use on board processing.
AWG/REP-25 (Rev.1) Page 19 of 43

In this case, a GSO satellite located 5 degrees apart from satellite S was found to meeting these criteria and was used in the geolocation as an adjacent satellite.The quality of the reference signals has a direct impact on the accuracy of the geolocation measurement. With respect to the reference signals, the operator should try to use reference signals: uplinked from a relatively small antenna; which are well distributed geographically; with suitable modulation; whose frequency is unused transponder sections on the adjacent satellites.The quality of the ephemeris data for the satellite pair is another important factor. The operator can acquire ephemeris data in the following way: request data from the satellite operator(s); download the published data from websites.
Step 3: geolocationWith good preparations, the geolocation measurement can be very easy. In the present case, an elliptical result was drawn to show the source of the interference with a set of parameters describing the ellipse. It was shown that the source of the interference was with a 95% possibility within the ellipse, which was centered at 30.721°N, 104.013°E , and which has a semi-major axis of 52km and a semi-minor axis of 10km.
Figure 1.3.1.4 elliptical result shown on a map
Geolocation result (centre of ellipse) [Lat. / Lon.] 30.721°N 104.013°ESemi-major axis (km) 52Semi-minor axis (km) 10Angle (degrees, true north clockwise) 177.39Confidence level (%) 95
Table 1.3.1.2 Result of measurement
AWG/REP-25 (Rev.1) Page 20 of 43

Annex 2 Case studies contributed by Japan
In April, 2007, Radio Interference Analysis Division, specializing in the analysis of radio interference, was established within the Kanto Bureau of Telecommunications, one of the regional branches of the Ministry of Internal Affairs and Communications in Japan.Kanto Bureau is the only bureau among the 11 regional bureaus in Japan with a specialized Radio Interference Analysis Division. It collects information on radio interference from regional bureaus across Japan. This information is then analyzed, accumulated and provided back to the radio monitoring departments of the regional bureaus.The Radio Interference Analysis Division investigates, analyzes and identify patterns of the cause mechanisms of radio interference and compiles a database of interference cases. This database is useful in determining the cause of difficult cases that would previously have been unidentifiable, leading to prompt elimination of interference sources.Approaches to analyzing and determining interference causes include: Measurement of the intensity of radio waves emitted from the radio devices, etc. in an anechoic
chamber Collection of information on the mechanism of interference caused by unnecessary radiation Exploration and development of new techniques for radio monitoring
Eleven recent typical cases of interference with important radio communications and their causes in Japan are introduced below.
Case 2.1 Interference with MCA radio control station by a baby monitor and other devicesMulti-Channel Access (MCA) is a mobile radio system where multiple users share multiple radio channels under the direction of the control station to enable efficient use of the frequency band. All communication between the base station and the mobile stations are relayed at the control station. MCA radio system uses the 800MHz band.
One of our regional monitoring bureau received a report on interference with a MCA control station. The monitoring team conducted field investigation and detected a radio wave that seemed to be the cause of the interference. The suspected wave was very weak, however, and it took time for the monitoring team to identify the emission source. After repeated investigations, the team found out that the source was a baby monitor and a wireless intercom module manufactured overseas.
In this case, the user of the baby monitor and wireless intercom was a foreign resident family with a baby. A baby monitor is a device to transfer the crying sound and images of a baby, so the parents can monitor the baby from another room. A wireless intercom is a device to enable conversation between discrete rooms.
These devices use the 800-900 MHz band and have a strong output, thus the use of these products are not permitted in Japan. We explained to the user that the baby monitor is a radio device whose use is prohibited in Japan based on the Radio Act, and that it is interfering with other important radio communications. We requested the user to discontinue use, and successfully eliminated the emission source.
AWG/REP-25 (Rev.1) Page 21 of 43
Case 2.2 Interference with the Fire Department's emergency communication by a LED exterior displayOur Regional Bureau received a report from the Fire Department that their mobile stations experience noise disturbance in a certain area. We conducted field investigation based on this information.
At first, we suspected wave leakage from a CATV facility and searched for leak waves, but we could not detect any unnecessary radiation. Then, we conducted a detailed investigation in the area and identified that a LED exterior display of a pachinko parlor was emitting unnecessary radiation.
Strong emission of radio waves was confirmed using a spectrum analyzer in the proximity of the LED display. Wave patterns appeared and disappeared as we turned on and off the LED display, thus it was identified as the interference source. We measured unnecessary radiation of field intensity up to 51dBμV/m at a location 10 meters away from the facility. Further investigation revealed a defect in the LED substrate, which was causing the unusually strong radiation.
After the substrate was repaired, we visited the pachinko parlor again to measure unnecessary radiation in the proximity of the LED display and confirmed that the radiation was reduced to 20dBμV/m at a point 10 meters away from the device. It was confirmed that interference with the Fire Department’s radio communication had been eliminated.
AWG/REP-25 (Rev.1) Page 22 of 43
【upper left】 center frequency: 910MHz, SPAN2MHz【lower left】 wireless intercom【upper right】 baby monitor camera【lower right】 baby monitor screen

Case 2.3 Interference with mobile phone base station by a communications scramblerA mobile phone operator reported communication interference with a mobile phone base station. We probed the cause in the area surrounding the base station. As a result, we identified a residential household emitting a high level of unnecessary radiation.
Upon obtaining consent from the resident, we investigated the house. Power source circuit breakers were turned off one by one to identify which room was the source of the radiation. This is a probing method based on the assumption that if the interference wave disappears when the power source to a certain section of the building is cut off, then the relevant radio equipment should be in that section of the building. Using this method, we identified that the radiation came from a room upstairs. We searched this room and found a communications scrambler, which was the cause of the interference.
Communication scramblers mix noise to the radio wave emitted from bugging devices so that the sound received by the bugging receiver becomes incomprehensible. They emit radio waves of 390-410MHz modulated with a beep sound, since most bugging devices use band frequency around 400MHz.
We measured the field intensity of radiation from this device in an anechoic chamber. As a result, we confirmed strong unnecessary waves at 800 MHz, which is the double harmonic of the base frequency. This 800 MHz wave was identified to be responsible for the interference with the mobile phone base station. We explained to the resident that the communication scrambler was emitting unnecessary radio waves interfering with mobile phone operation. We requested the user to discontinue use of and remove the scrambler, and successfully eliminated the emission source.
AWG/REP-25 (Rev.1) Page 23 of 43
LED exterior display
【left】Wave pattern by spectrum analyzer (850 MHz)【right】communications scrambler

Case 2.4 Harmonic emission on 406MHz from a high-frequency equipmentOur regional bureau received a report that a false signal seems to be emitted on 406.025MHz, the marine distress frequency. While we were investigating a certain area, we found out the noise signals were being emitted on 406MHz at an interval of 100 seconds.
An industrial plant was located in the area where high intensity noise signals were measured. We searched for the emission source and detected unnecessary radiation from a high frequency welder (a high-frequency equipment for welding plastics), which was being used under formal permission.
The base frequency of the equipment was 27.12MHz. However, the 15th harmonic of this base frequency was being emitted on 405-409MHz band, which was sensed as noise on 406.025MHz. The welder was repaired by the manufacturer. The fluctuation band of the base frequency was adjusted so the 15th harmonic won’t coincide with 406.025MHz. It was also treated to reduce the intensity of unnecessary radiation.
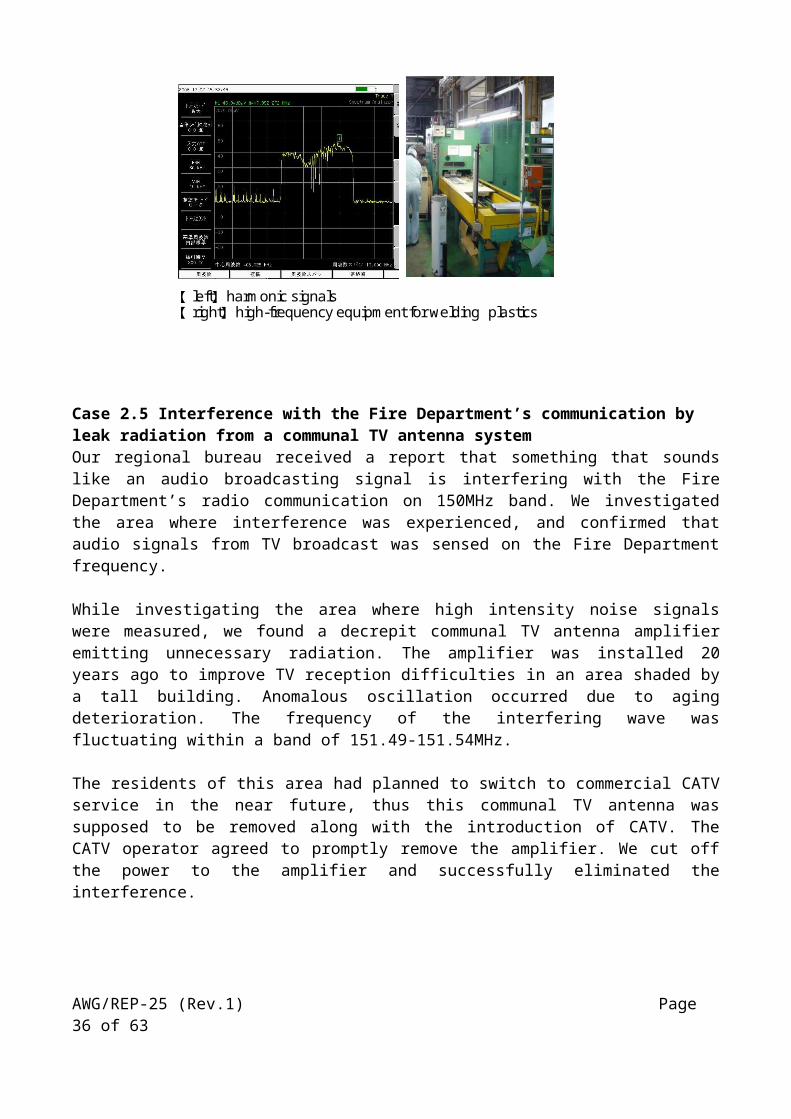
Case 2.5 Interference with the Fire Department’s communication by leak radiation from a communal TV antenna systemOur regional bureau received a report that something that sounds like an audio broadcasting signal is interfering with the Fire Department’s radio communication on 150MHz band. We investigated the area where interference was experienced, and confirmed that audio signals from TV broadcast was sensed on the Fire Department frequency.
While investigating the area where high intensity noise signals were measured, we found a decrepit communal TV antenna amplifier emitting unnecessary radiation. The amplifier was installed 20 years ago to improve TV reception difficulties in an area shaded by a tall building. Anomalous oscillation occurred due to aging deterioration. The frequency of the interfering wave was fluctuating within a band of 151.49-151.54MHz.
The residents of this area had planned to switch to commercial CATV service in the near future, thus this communal TV antenna was supposed to be removed along with the introduction of CATV. The CATV operator agreed to promptly remove the amplifier. We cut off the power to the amplifier and successfully eliminated the interference.
AWG/REP-25 (Rev.1) Page 24 of 43
【left】harmonic signals【right】high-frequency equipment for welding plastics

Case 2.6 Interference with disaster prevention radio communication by a communal TV antenna systemOur regional bureau received a report that a strong noise is interfering with the community broadcasting station (60MHz) of the disaster prevention radio system. It was reported that the interference was causing malfunction of the community broadcasting station, and a strong noise was contaminating the reports received. We investigated the area around the community broadcasting station, but it took quite a while for us to identify the interference source because the interference wave was emitted with low intensity for random and short periods of time.
After a thorough and detailed investigation of the surrounding area, we identified a suspicious building and conducted field intensity measurement in the building. We noticed that a power pilot lamp of a TV booster of an old communal TV antenna system was synchronizing with the timing of noise generation, and finally, identified this device as the interference source. After examining the power switch, it was ascertained that spark discharge from a thermostat embedded in the power transformer was generating the interference noise. It is considered that the noise was radiated into the air via surrounding coaxial cables and AC cords which acted as an aerial antenna.
TV boosters currently sold have a different component instead of a thermostat, therefore we believe the same kind of event is unlikely to happen again.
AWG/REP-25 (Rev.1) Page 25 of 43
【left】 wave pattern on a spectrum analyzer screen (15m away from the interference source)
【right】communal TV antenna amplifier (red circle) (the device on the right is the power supply part)

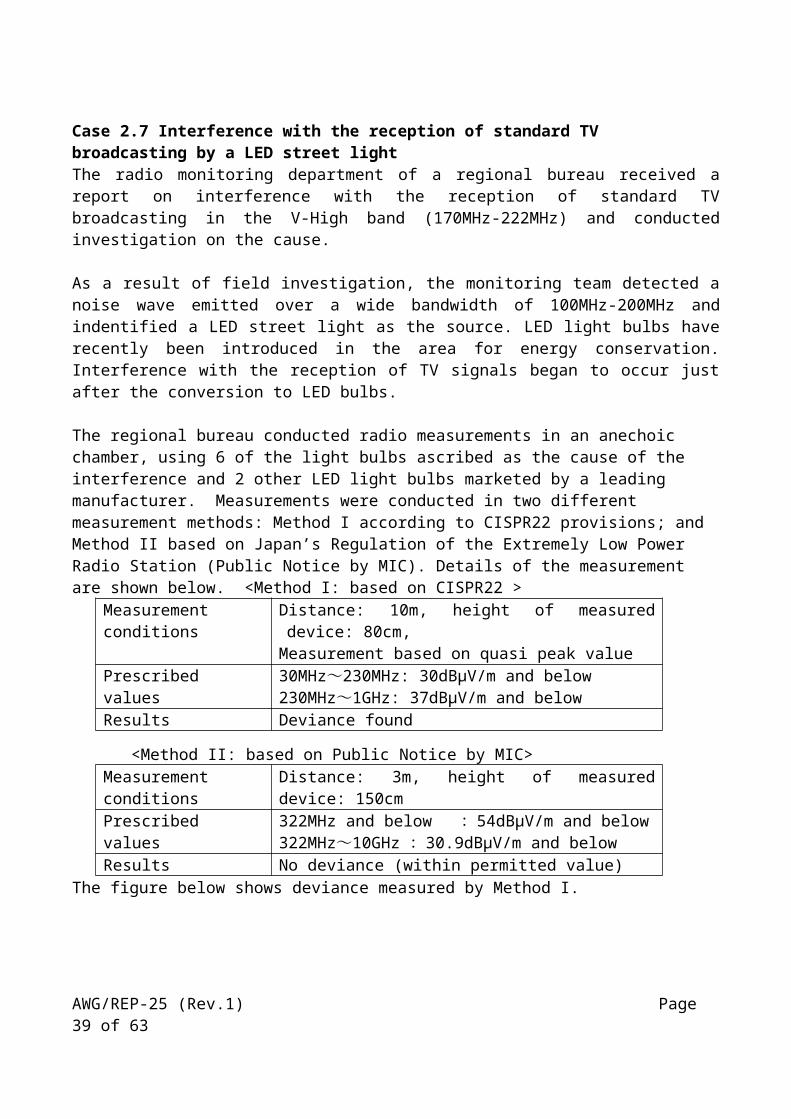
Case 2.7 Interference with the reception of standard TV broadcasting by a LED street lightThe radio monitoring department of a regional bureau received a report on interference with the reception of standard TV broadcasting in the V-High band (170MHz-222MHz) and conducted investigation on the cause.
As a result of field investigation, the monitoring team detected a noise wave emitted over a wide bandwidth of 100MHz-200MHz and indentified a LED street light as the source. LED light bulbs have recently been introduced in the area for energy conservation. Interference with the reception of TV signals began to occur just after the conversion to LED bulbs.
The regional bureau conducted radio measurements in an anechoic chamber, using 6 of the light bulbs ascribed as the cause of the interference and 2 other LED light bulbs marketed by a leading manufacturer. Measurements were conducted in two different measurement methods: Method I according to CISPR22 provisions; and Method II based on Japan’s Regulation of the Extremely Low Power Radio Station (Public Notice by MIC). Details of the measurement are shown below. <Method I: based on CISPR22 >
Measurement conditions Distance: 10m, height of measured device: 80cm, Measurement based on quasi peak value
Prescribed values 30MHz~230MHz: 30dBμV/m and below230MHz~1GHz: 37dBμV/m and below
Results Deviance found
<Method II: based on Public Notice by MIC>Measurement conditions Distance: 3m, height of measured device: 150cm
AWG/REP-25 (Rev.1) Page 26 of 43
【upper left】community broadcasting station 【upper right 】household TV booster 【lower left 】noise measured by a spectrum analyzer【lower right】thermostat embedded in the power transformer
thermostat

Prescribed values 322MHz and below :54dBμV/m and below322MHz~10GHz :30.9dBμV/m and below
Results No deviance (within permitted value)The figure below shows deviance measured by Method I.
Recent advancement in the research and development of LED technology has accelerated the commercialization of LED lighting devices in Japan as a means for energy conservation. There is a possibility that products with electromagnetic interference problems may be distributed. Therefore, information on this case has been shared among all regional bureaus as a unique interference case caused by a LED device to prevent recurrence and ensure prompt recovery in a similar case.
【Street light causing interference】 【Measurement in an anechoic chamber】
Case 2.8 Interference with fire department radio system caused by a laptop computer coolerThe radio monitoring department of a regional bureau received a report of noise interference with the fire department’s radio communications system (143.4MHz band). Upon receiving this report, the monitoring team conducted field investigation.
When measuring the interfering signal with a real-time spectrum analyzer and a directional antenna, the input terminal voltage reached its maximum in front of an ordinary residence approximately 140
AWG/REP-25 (Rev.1) Page 27 of 43

meters away from the fire department’s radio station (located within the fire department building). Upon obtaining consent from the owner of the residence, the monitoring team investigated the residence and identified that a laptop cooler fan was emitting spurious signals as strong as up to 103dBμV/m (maximum field intensity). When the power was cut off from the cooler, it was confirmed that the interfering signal stopped as well.
The regional bureau instructed the manufacturer of the device to conduct investigation to determine the cause and prevent recurrence. Subsequently, the manufacturer reported that they confirmed pulsed spurious signals from their product and will take measures (recall and modification of the product) to prevent recurrence. The report was accepted and the case was closed.
【Interference signal: wave form】 【Laptop computer cooler】Center frequency: 143.4MHz
【Measurement in an anechoic chamber 】【Anechoic chamber/measurement screen】
AWG/REP-25 (Rev.1) Page 28 of 43

【Anechoic chamber/measurement data】Frequency Level Cable Amp. Ant. Result 3m Margin
Ver. Hor. Loss Gain Factor Ver. Hor. Limit Ver. Hor.
(MHz) (dBμV) (dB) (dB)(dB/m) (dBμV/m)
(dBμV/m) (dB)
71.05 81.6 1.7 -27.3 12.3 68.3 54.0 -14.3 71.14 87.5 1.7 -27.3 12.3 74.2 54.0 -20.2
142.10 93.6 2.4 -27.2 21.2 90.0 54.0 -36.0
142.17 92.7 2.4 -27.2
21.2
89.1 54.0 -35.1 143.40 88.1 2.4 -27.2 21.2 84.5 54.0 -30.5
143.40 90.2 2.4 -27.2 21.2
86.6 54.0 -32.6
213.17 65.0 3.0 -27.2 23.6 64.4 54.0 -10.4 213.32 69.8 3.0 -27.2 23.6 69.2 54.0 -15.2
355.05 58.2 3.9 -27.3 15.2 50.0 30.9 -19.1
355.18 55.7 3.9 -27.3 15.2 47.5 30.9 -16.6
AWG/REP-25 (Rev.1) Page 29 of 43

30 100050 100 5000
100
10
20
30
40
50
60
70
80
90
周波数
レベ
ル
[MHz]
[dB(μ V/m)]
Case 2.9 Interference with radio broadcasting service caused by a communal TV antenna systemThe radio monitoring department of a regional bureau received a report from a radio broadcasting base station that it is frequently experiencing interference with its broadcasting signals at 165.57MHz. Upon receiving this report, the monitoring team conducted field investigation. The interference signal was characterized i) to be an unmodulated carrier wave, ii) to have a stable amplitude, and iii) to have a wide frequency variation of ±several hundred kHz.
The emission source was estimated to be located in an area undergoing urban development and surrounded by tall buildings. The direction of the emission source was hard to determine because the azimuth value was unstable due to radio reflection. To reduce the azimuth error as much as possible the team chose rooftops of tall buildings with relatively clear views and repeatedly conducted measurements. After several visits to the area, the team identified that a communal TV antenna system installed on the roof of a residential building was emitting strong spurious signals exceeding 100dBµV/m in field intensity.
Direction measurement on ground surface is extremely difficult in urban areas surrounded by many high-rise buildings. This is especially true when the interference source is located high above the ground, such as on the rooftop of a building or inside the building on the upper floors. In such cases, not only field intensity but other data on the interference signal need to be collected which will be carefully analyzed to narrow down the investigation.
The cause of the interference was a communal TV antenna amplifier. When the communal antenna was renewed to a new model, the power switch of the old amplifier should have been cut off, but the owner of the building had forgotten to cut it off. This was causing the spurious emission.
Currently, the amplifier is being studied to determine the cause mechanism of the spurious emission. It is presumed that wire connection failure due to aging of the amplifier has lead to the leakage of
AWG/REP-25 (Rev.1) Page 30 of 43

high frequency signals. A team specializing in analysis of communication interference is now investigating the cause mechanism through measurements in an anechoic chamber and other means.
Case 2.10 Interference with the airport control system (SSR: Secondary Surveillance Radar) at the Kansai International Airport and how it was resolved
1) Date of investigation: May 17-18, 20072) Interfered station: SSR system (Kansai International Airport)3) Interfering station: Illegal wireless monitoring camera4) Frequency of interfering wave: 1092MHz5) Situation of interference: Alarm of the SSR system (No.2) was activated
Interference by an external radio wave was confirmed by monitoring the SSR systemLuckily, flight control was not affected by the interference because SSR system no. 2 was being used for training purposes at that time.
6) District: Osaka Prefecture (Kansai International Airport and its vicinity) 7) Results of investigation:
a) Direction of the interfering source was measured by DEURAS Izumisano sensor station. Results of the measurement indicated that the source was located to the north of the Airport.
b) Field investigation was conducted in the area surrounding the Airport using a radio monitoring vehicle (DEURAS-M). ・ Mainland coast on the east of the Airport (Point A): Not detected at 1090MHz ・ Mainland coast on the east of the Airport (Point B): ~65dB at 1090MHz・ Mainland coast on the east of the Airport (Point C): 55dB at 1090MHz, increase in
reception level observed on the Kanku Bridge ・ Center of the Kanku Bridge: 60dB at 1090MHz・ Near Kanku Island: 70dB at 1090MHz, though direction unstable・ Area surrounding Kanku Island: 50-60dB at 1090MHz, though direction unstable・ Harbor at the northern end of the Airport: Increase in reception level was observed at
several points, but further investigation was impossible because there were numerous emission sources in the area.
・ Mainland coast on the east of the Airport (Point D): Not detected・ Shopping mall on the mainland coast: Found a spot where reception level rose to 80dB
at 1090MHzc) Conducted spectrum analysis measurements in the parking lot of the shopping mall. A
wideband radio wave of 1087-1095MHz was identified.d) Investigated the distribution of field intensity in the parking lot using a field intensity
meter. We located a point where field intensity was as high as 95dBμV/m (log-periodic gain: approx. 10dB), which was right under a monitoring camera installed near the gateway to the parking lot. The wireless type monitoring camera was identified as the emission source.
AWG/REP-25 (Rev.1) Page 31 of 43
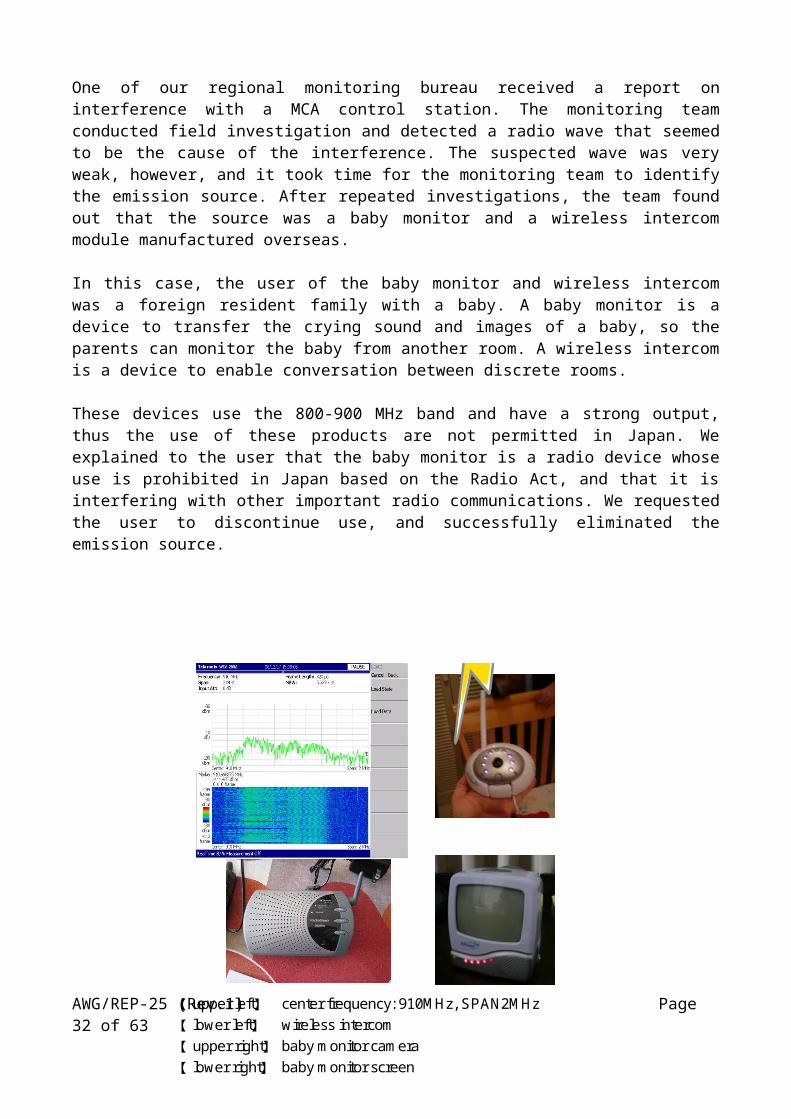
Figure 2: Result of direction measurement by DEURAS
AWG/REP-25 (Rev.1) Page 32 of 43

AWG/REP-25 (Rev.1) Page 33 of 43

Figure 3: Measurement points and emission source (parking lot of the shopping mall)
Figure 4: Photos of the investigation and the monitoring camera
8) Date of investigation and number of staff a. Date of investigation: May 17-18, 2007 (investigation conducted over 2 days)b. Staff: A team of 4 staff members for both days
Leader: 1 (Manages and directs the mission) Measurement and recording staff: 2Driver: 1
9) Equipment used: ・ Measurement system: DEURAS (Fixed sensor stations)
DEURAS-M (vehicle with onboard sensors)・ Measurement device: Spectrum analyzer
Handy direction finderField intensity meterLog-periodic antenna
10) Tips for investigationInvestigation procedure: 【Day 1】
a) Roughly identified the location of the interference source using DEURAS fixed sensors. ・ Conducted repeated measurements step by step from 1085MHz to 1095MHz
incrementing frequency by 200kHz each time, because reception bandwidth needed to be limited.
・ It was determined that an intersection of directions is formed near Point A at 1091.6MHz.
b) Conducted field investigation using DEURAS-M (a vehicle with spectrum analyzer, log-periodic antenna and handy direction finder on board). Investigated the area where the intersection was formed. ・ Conducted direction measurements at several vantage points surrounding the
intersection point. ・ Compared measurement results obtained by DEURAS and DEURAS-M. Field
intensity was also recorded for each measurement point. ・ Monitored changes in field intensity while moving to the next measurement point.
(Know how for using DEURAS-M) One of the largest advantages of DEURAS-M is that it can move around while conducting measurements. Not only the direction but also field intensity is measured at
AWG/REP-25 (Rev.1) Page 34 of 43

the same time, so areas with the strongest field intensity can be easily identified by keeping a record of the field intensity measurements.
・ On our way back to the office, we found a point near a shopping mall where the field intensity reached 80dB at 1090MHz.
【Day 2】・ Headed directly to the shopping mall where high field intensity was marked on the
previous day.
c) Conducted spectrum analysis of the interfering wave at places where field intensity was sufficiently high.
(Know-how for identification of emission source, no.1: How to detect the location at places where the field intensity is high)
In places where the field intensity is high, the handy direction finder may not be indicating the accurate direction of the emission source due to the influence of multipath and other effects.When the field intensity is high, it also means that you have come quite close to the emission source, so the location can be found using the field intensity meter by approaching the direction in which the field intensity grows stronger.
(Know-how for identification of emission source, no.2: Understanding the characteristics of the emission source)
When the field intensity is high enough, the interfering wave and its neighboring frequencies can be observed using a spectrum analyzer. The bandwidth of the interfering wave and emissions outside the measurement bandwidth of the field intensity meter should be recorded. This data will be utilized later when finally determining the interference source to judge whether the detected radio wave and the radio wave that caused the interference are identical or not. If the interfering radio wave is intentionally being emitted for some purpose, the spectrum analysis data will also be used to judge whether the bandwidth of the emission can be reasonably explained in light of the purpose of the radio wave.
d) Searched the emission source on foot, using the field intensity meter. ・ If the field intensity meter has a directional antenna, turn the antenna around 360
degrees to identify the direction in which the field intensity is strongest. ・ If the polarization of the antenna can be changed, try both vertical and horizontal and
then choose the polarization receiving a stronger signal. ・ Next, move several tens of meters toward the direction showing the strongest field
intensity and then again measure the field intensity and confirm the direction in which field intensity grows stronger. (Repeat this procedure as needed until the emission source is identified)
・ When you see, in the direction of the stronger field intensity, any machines or structures that may be emitting radio waves, approach as close as possible to the machine or structure and observe the changes in the intensity field.
Results of the investigation
AWG/REP-25 (Rev.1) Page 35 of 43
・ A wireless monitoring camera was installed on top of a pole. An antenna for data transmission was also confirmed next to the camera.
・ The transmit frequency of the camera had been modified, which was confirmed through spectrum analysis.
・ Radio waves over a wide bandwidth had been observed by spectrum analysis. Wideband radio waves are often used to transmit image from a camera, so it can be concluded that the measurement results and actual usage is consistent. Thus the monitoring camera was determined as the interference source.
Case 2.11: Interference with mobile phone base station caused by a peripheral (cordless) device for personal computers and how it was resolved
1) Date of investigation : February 23, 2011 2) Interfered station: Mobile phone base station3) Interfering station: Peripheral device for personal computers (cordless device)4) Frequency of interfering wave: 1926.250MHz, 1927.500MHz, 1928.750MHz5) Situation of interference: Interference was experienced in the reception frequencies (the
above three frequencies) assigned for mobile phone communication, resulting in communication delay. Interference does not occur regularly every day but rather intermittently.
6) District: Okinawa Prefecture7) Result of investigation:
a) Through interviews with the mobile phone carrier, we obtained information that “external radio waves coming from east and south-east seem to be causing the interference.” Based on this information we focused our investigations on these directions. Measurements were conducted using a spectrum analyzer and a directional Yagi antenna in empty lands and road junctions where influence by reflection can be minimized.
b) Measurement data (field intensity and direction) obtained from each of the measurement points were plotted on to a map. Location of the interference source is identified as the intersection of the measured directions.
c) As a result, we identified as the emission source a 5 storied apartment building located at approximately 300 meters south-east of the mobile phone base station.
d) By directing the Yagi antenna to right/left and upper/lower directions as well as trying both horizontal and vertical polarizations, it was estimated that the emission source was located in the upper stories of the building.
e) After searching up and down the stairways and corridors, we identified the room at which the field intensity becomes the largest.
f) After investigating inside the residence following the direction in which the field intensity grows stronger, we arrived at a room with a personal computer. The computer and peripheral devices were switched on and off in turns to identify which was the emission source. It turned out that a cordless peripheral device was the emission source. This peripheral device was unapproved for domestic use.
g) To make sure, we contacted the engineers of the affected mobile phone carrier, and confirmed that the switching on and off of the said peripheral device synchronizes with the alarm display of the surveillance monitor at the mobile phone base station.
h) Explained to the user of the interfering device (the PC peripheral device identified as the interference source) that the device is not approved for use within Japan and gained consent from the user not to use it anymore.
AWG/REP-25 (Rev.1) Page 36 of 43

Figure 5: Photo taken during investigation (the apartment building estimated as the interference source) and waveform of the interfering wave (measured outdoor)
Figure 6 Interfering device (cordless peripheral device for personal computers) and waveform of the interfering wave (measured inside the residence)
8) Date of investigation and number of staff a) Date of investigation: February 23, 2010 (1 day)b) Number of staff: 2
Operation of measurement device: 1Data recording and analysis: 1
9) Equipment used: ・ Measurement device: Portable spectrum analyzer (measurable frequency range: 9kHz-
7.5GHz)・ Antenna: Directional Yagi antenna (measurable frequency range: 1920-2170MHz)・ Cable: RG-55/U
10) Tips for investigation(Know how of the investigation) ・ In cases of low powered emitting devices, the area affected is very limited. It is therefore
important to understand about the local structures and geography surrounding the affected station prior to field investigation.
AWG/REP-25 (Rev.1) Page 37 of 43

・ Measurement can be conducted effectively by combining a portable spectrum analyzer (hand-held type) and a directional antenna for measuring the direction.
・ First, analyze the spectrum distribution of the interfering wave and identify the most stable and strong frequency point. Adjust the spectrum analyser to that frequency, and follow the direction in which the field intensity grows stronger.
・ In this particular case, although the interference occurred irregularly and randomly, the direction (sector) from which the interference wave came was quite clear from the out start, so we were able to facilitate our investigation by focusing on that direction.
・ During the investigation, we took reflection from residential walls into account, because the interfering wave was in the quasi microwave band. (It is important to take reflection into account, so as not to be confused by the arrival directions captured by the antenna)
・ We chose empty spaces and road crossings as measurement points avoiding reflection as much as possible. This helped to effectively narrow down the location of the emission source.
After identifying a suspicious building, we tried to identify the exact direction by turning the antenna not only horizontally but also vertically from outside the building and estimated that the interference cause is located somewhere in the upper stories.
Conclusion of the Japanese casesUnnecessary radiation from faulty or decrepit radio devices is still a major cause of communication interference; however, interference cases caused by household appliances other than radio devices are growing due to diversification and increase of electronic appliances.
Lighting apparatus such as street lights and fluorescent lights are now increasingly equipped with inverters and noise generated from these inverters are also causing interference with Fire Department or Aircraft Station communications.
Any kind of electronic device has a potential to become an interference source. Therefore it is becoming increasingly important to analyze and accumulate data such as, categorization of characteristic phenomena by cause mechanism, and spectrum patterns based on frequency and time axes, for prompt determination of the interference source.
AWG/REP-25 (Rev.1) Page 38 of 43
Annex 3 Case studies contributed by Republic of Korea
Case 3.1 2.4GHz Wi-Fi Interference management
1. IntroductionThe Wireless Local Area Network (WLAN) operating at 2.4 GHz is regarded as radio station to be opened without registration or permission in Korea. It also should admit interferences from other equipments as in the 47CFR Part 15.5 of FCC which describes as follows; Operation of WLAN systems is subject to the conditions that no harmful interference is caused and that interference must be accepted that may be caused by the operation of an authorized radio station, by another intentional or unintentional radiator, by industrial, scientific and medical (ISM) equipment, or by an incidental radiator. Under this kind of operating condition with interference acceptance, wireless equipments like smart phone and wireless phone installed loaded with WiFi RF chip operating at 2.4 GHz have been increasing rapidly in recent years. As mobile communication providers use the WLAN for the dispersion of wireless internet traffic, the interference cases of WLAN operating at 2.4 GHz have been reported in hot spots such as electric shopping district, coffee shop, office in downtown area and so on.Therefore, the Korea Communications Commission (KCC) developed the minimizing method of radio interference of WLAN for manufacturers, service providers and general users of WLAN in hot spots through experimental tests.This document aims at introducing the minimization method of radio interference of WLAN through experimental results accomplished in Korea. It is expected that the proposed guideline for minimizing radio interferences between 2.4 ㎓ WLAN systems would be helpful for Asia Pacific Group (APG) countries.
2 Overview of IEEE 802.11 StandardIEEE 802.11 is the standard of WLAN defined by Institute of Electrical and Electronics Engineers (IEEE) and there are 3 standards such as 802.11b/g/n using 2.4 GHz in Korea. The 802.11b supports 11 Mbps and the 802.11g supports 54 Mbps. The 802.11n supports 600 Mbps and bonding function combining 2 channels. Table 1 shows the comparison of 802.11 b/g/n standard.
<Table 1. Comparison of IEEE 802.11b/g/n>Classification 802.11b 802.11g 802.11nFrequency 2.4 GHz 2.4 GHz 2.4 and 5 GHz Modulation DSSS OFDM OFDMData Rate 11 Mbps 54 Mbps 600 MbpsBonding Function Impossible Impossible Possible
There are 11 channels in USA and 13 channels in Korea for WLAN channel and the channel separation is 5 MHz. Table 2 represents channel number and frequency of WLAN standard based on IEEE 802.11 using frequency range from 2.4 GHz to 2.4835 GHz.
<Table 2. Channel number vs. frequency>Channel Number
Center frequency(MHz)
AWG/REP-25 (Rev.1) Page 39 of 43

1 2412 2 24173 24224 24275 24326 24377 24428 24479 245210 245711 246212 246713 2472
The channel numbers are supposed to be selected as 1, 6 and 11 to avoid radio interference in case of operating of WLAN systems at the same time since the channel bandwidth of WLAN is 22 MHz.
3 Interference Test of WLAN Test environment is set up by placing 20 WLANs(AP01 ~ AP20) with same interval in an auditorium blocked from external interferences as in figure 1.
Figure 1. Test environment for radio interference of WLANs
3.1. Impact of the number of Access Point (AP) The variation of data rate is observed according to the change of AP numbers such as 20, 12 and 8 to investigate the impact of radio interference on data rate of WLAN. The results are summarized in table 3.
<Table 3. Data rate vs. the number of AP>
AWG/REP-25 (Rev.1) Page 40 of 43

Data rate(Mbps)
Number of AP 20 12 8
Total 21.791 31.47 83.488Average 1.090 2.623 10.436
3.2. Optimal Channel CombinationThe channel combination of 1/6/11 and 1/5/9/3/ is selected, respectively, in order to get optimal channel combination. Those combinations are minimal frequency overlap among channel numbers from 1 to 13, and 8 APs are operating at the moment. The relationship between data rate and channel combination through experiment results is summarized in table 4.
<Table 4. Data rate vs. channel combination>
Data Rate(Mbps)Channel Combination 1/5/9/13 1/6/11
Total 83.488 22.135
Average 10.436 2.767
3.3. Impact of Bonding The variation of data rate is checked according to bonding function of 802.11n by fixing channel combination of AP as 1/5/9/13 and the test results are summarized in table 5.
<Table 5. Data rate vs. bonding function>
Data Rate (Mbps)
AP number Without bonding function
With bonding function
Total 101.697 15.555
Average 12.712 1.944
3.4. Separation distance of APSeparation distance of 0.5 m between APs (a) and separation distance of 1.5 m between APs(b) are set up in experimental environment as in figure 2 to compare the variation of data rate with separation distance of WLAN sharing device based on 802.11g.
AWG/REP-25 (Rev.1) Page 41 of 43

(a) 0.5 m (b) 1.5 m
Figure 2. Experiment environment for separation distances between APs
Test results are summarized in table 6.
<Table 6. Data rate vs. separation distance between APs>
Data Rate(Mbps)Separation distance of APs 0.5 m 1.5 m
Total 8.09 60.28
Average 2.02 15.07
4. Results of practical testThe test results of radio interference of 2.4 GHz WLAN are summarized as follows and the guidelines are included in section 5.
4.1. Impact of the number of Access Point (AP)As shown in table 3, average data rate was 1.09 Mbps for 20 APs, 2.623 Mbps for 12 APs and 10.436 Mbps for 8 APs. It is recognized that the data rate is decreased due to radio interference between APs as the number of AP is increased.
4.2. Optimal Channel CombinationAs shown in table 4, using of 4 channels (1, 5, 9, 13) is more efficient than using of 3 channels (1, 6, 11) in respect of data rate.
4.3. Impact of BondingAs shown in table 4, average data rate of AP was 1.944 Mbps with bonding function, however, average data rate of AP was 12.712 Mbps without bonding function. Therefore, it is not desirable to have bonding function of 802.11n.
4.4. Separation distance of APAs shown in table 6, the average data rate was 2.02 Mbps when separation distance was 0.5 m and the average data rate was 15.07 Mbps when separation distance was 1.5 m. As a result, the data rate is increased with the increase of separation distance.
5. Guidelines to reduce WiFi interference at 2.4 GHz5.1 User of WLAN AP (Office, Company, Home, etc. )
AWG/REP-25 (Rev.1) Page 42 of 43

In establishing WLAN AP, recommend to select one channel among channels of 1, 5, 9, and 13, since they are minimum channels among WLAN channels(1~13) in respect of radio interference. It is recommended that the channel bandwidth of WLAN should be 22㎒ below.
5.2. Manufacturer of WLAN It is recommended that AP should be released with one of channels such as 1, 5, 9 and 13 which should be minimum value in radio interference. Also, channel selection function should be provided for user. It is recommended that guideline for minimization of radio interference should be included and
attached in product brochure or in an annexed paper.
5.3. Service provider of WLAN (Mobil Communications Providers) It is recommended that one channel among 1, 5, 9 and 13 should be selected and then operated. Network ID of WLAN AP should be made for everyone to recognize easily. ※ SKT(T wifi zone), KT(QOOKnSHOW), LGU+(myLGnet, U+ACN)
____________
AWG/REP-25 (Rev.1) Page 43 of 43